| Param | Original file | Final file |
|---|---|---|
| Filename | modeM0/AS1G07_010T03_9000001224_08790cztM0_level2.evt | modeM0/AS1G07_010T03_9000001224_08790cztM0_level2_quad_clean.evt |
| Size (bytes) | 695,972,160 | 100,405,440 |
| Size | 663.7 MB | 95.8 MB |
| Events in quadrant A | 4,197,215 | 648,329 |
| Events in quadrant B | 3,577,858 | 671,240 |
| Events in quadrant C | 3,504,043 | 666,546 |
| Events in quadrant D | 9,288,378 | 529,984 |
| Mode SS | |||
|---|---|---|---|
| Quadrant | BADHDUFLAG | Total packets | Discarded packets |
| A | 0 | 162 | 14 |
| B | 0 | 162 | 0 |
| C | 0 | 162 | 0 |
| D | 0 | 162 | 4 |
| Mode M0 | |||
|---|---|---|---|
| Quadrant | BADHDUFLAG | Total packets | Discarded packets |
| A | 0 | 18457 | 649 |
| B | 0 | 16410 | 544 |
| C | 0 | 16311 | 507 |
| D | 0 | 35061 | 2267 |
| Mode M9 | |||
|---|---|---|---|
| Quadrant | BADHDUFLAG | Total packets | Discarded packets |
| A | 0 | 6 | 1 |
| B | 0 | 6 | 0 |
| C | 0 | 6 | 0 |
| D | 0 | 6 | 0 |
| Quadrant | Total seconds | Saturated seconds | Saturation percentage |
|---|---|---|---|
| A | 7569 | 262 | 3.461488% |
| B | 7580 | 87 | 1.147757% |
| C | 7597 | 32 | 0.421219% |
| D | 7333 | 1787 | 24.369290% |
Noise dominated data is calculated using 1-second bins in cleaned event files. If a bin has >2000 counts, and if more than 50% of those come from <1% of pixels, then it is considered to be noise-dominated and hence unusable.
| Quadrant | # 1 sec bins | Bins with >0 counts | Bins with >2000 counts | High rate bins dominated by noise | Noise dominated (total time) | Noise dominated (detector-on time) | Marked lightcurve |
|---|---|---|---|---|---|---|---|
| A | 8426 | 7807 | 119 | 119 | 1.41% | 1.52% | 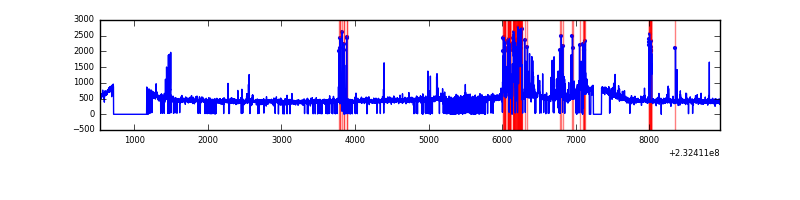 |
| B | 8426 | 7811 | 3 | 3 | 0.04% | 0.04% | 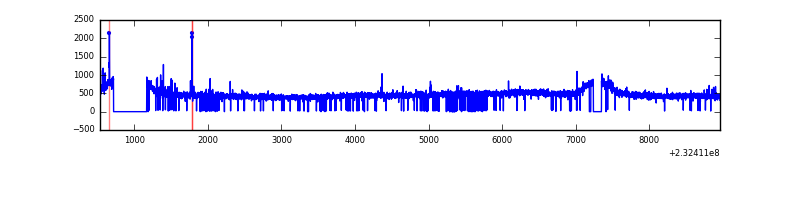 |
| C | 8426 | 7822 | 0 | 0 | 0.00% | 0.00% | 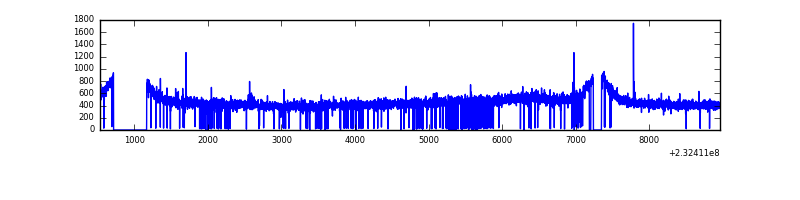 |
| D | 8426 | 7683 | 1309 | 1309 | 15.54% | 17.04% | 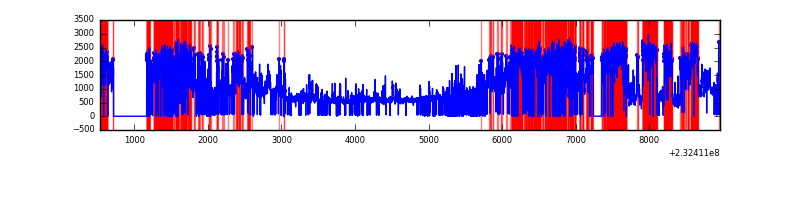 |
Top three noisy pixels from each quadrant. If the there are fewer than three noisy pixels in the level2.evt file, extra rows are filled as -1
| Pixel properties | Quadrant properties | ||||||
|---|---|---|---|---|---|---|---|
| Quadrant | DetID | PixID | Counts | Sigma | Mean | Median | Sigma |
| A | 15 | 223 | 497326 | 2705.82 | 888 | 866 | 183.5 |
| A | 15 | 239 | 140729 | 762.29 | 888 | 866 | 183.5 |
| A | 8 | 5 | 91129 | 491.95 | 888 | 866 | 183.5 |
| B | 4 | 173 | 53208 | 301.31 | 905 | 878 | 173.7 |
| B | 12 | 111 | 19683 | 108.28 | 905 | 878 | 173.7 |
| B | 11 | 111 | 15827 | 86.07 | 905 | 878 | 173.7 |
| C | 14 | 67 | 26125 | 121.11 | 888 | 891 | 208.4 |
| C | 14 | 234 | 6773 | 28.23 | 888 | 891 | 208.4 |
| C | 13 | 61 | 6733 | 28.04 | 888 | 891 | 208.4 |
| D | 2 | 16 | 5976525 | 31837.27 | 772 | 753 | 187.7 |
| D | 2 | 152 | 89448 | 472.54 | 772 | 753 | 187.7 |
| D | 2 | 14 | 68481 | 360.84 | 772 | 753 | 187.7 |
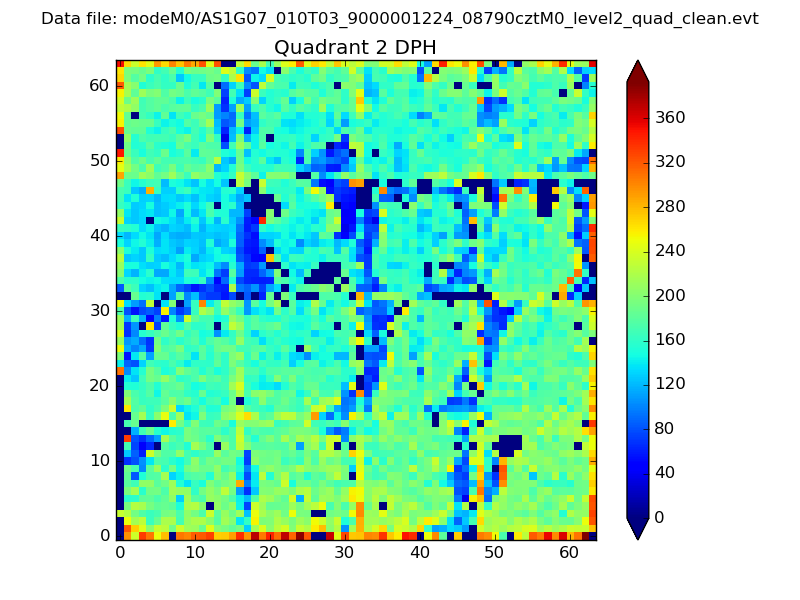
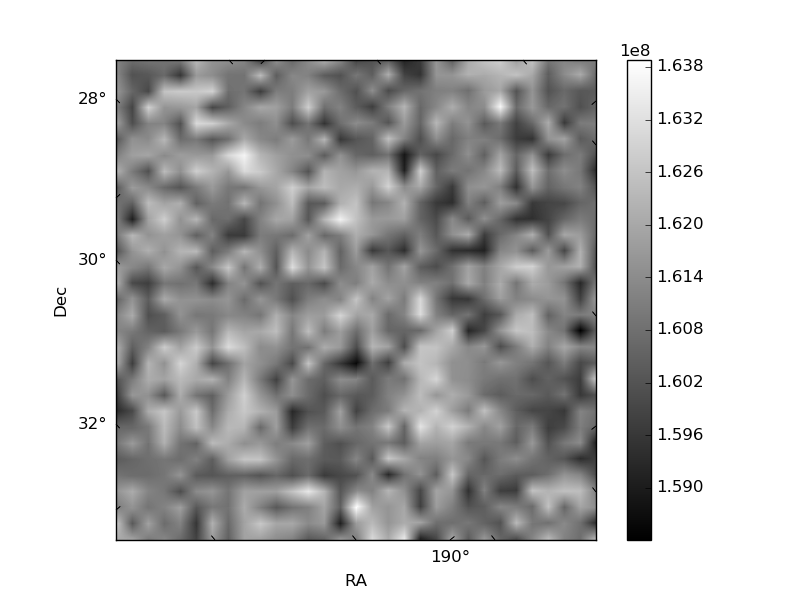
Histogram calculated using DETX and DETY for each event in the final _common_clean file
| Quadrant A | 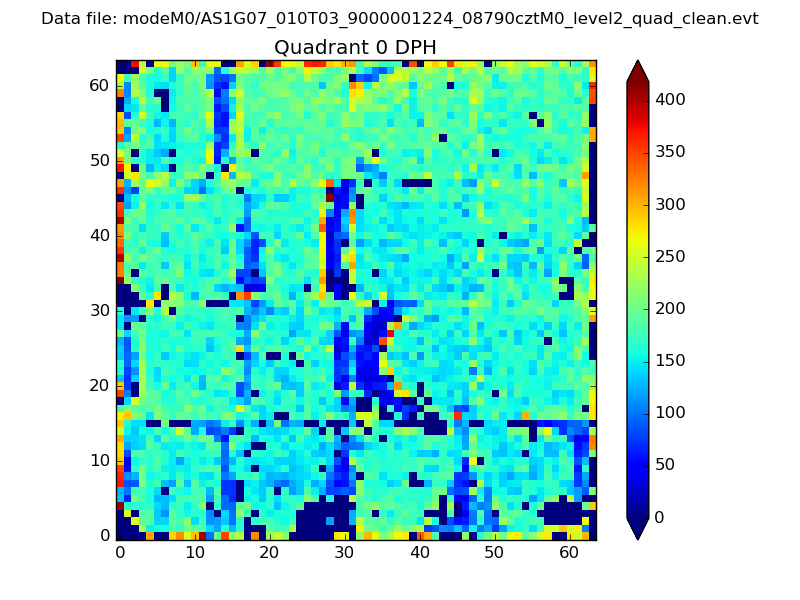 |
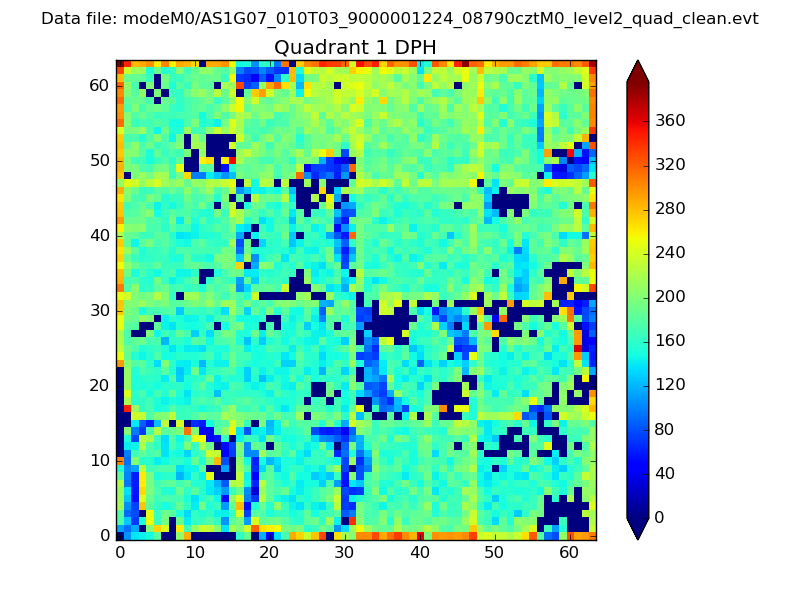 |
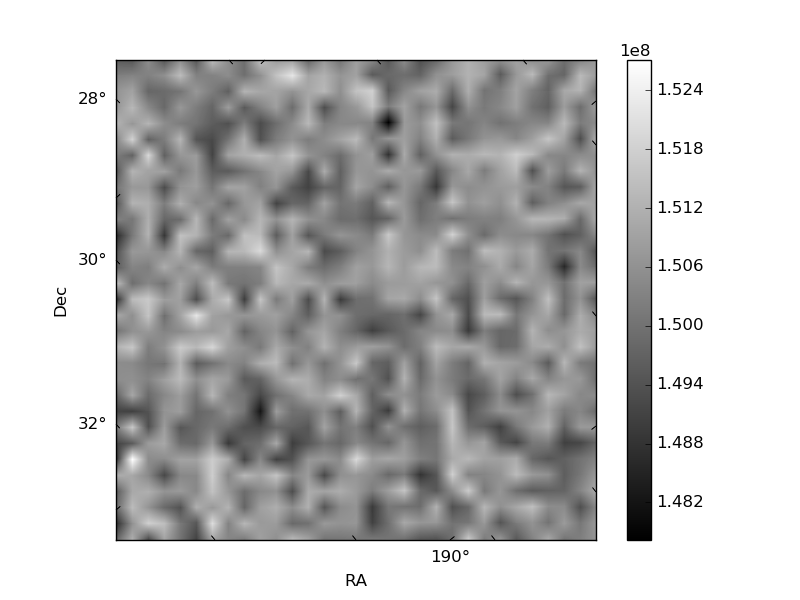
Quadrant B |
|---|---|---|---|
| Quadrant D | 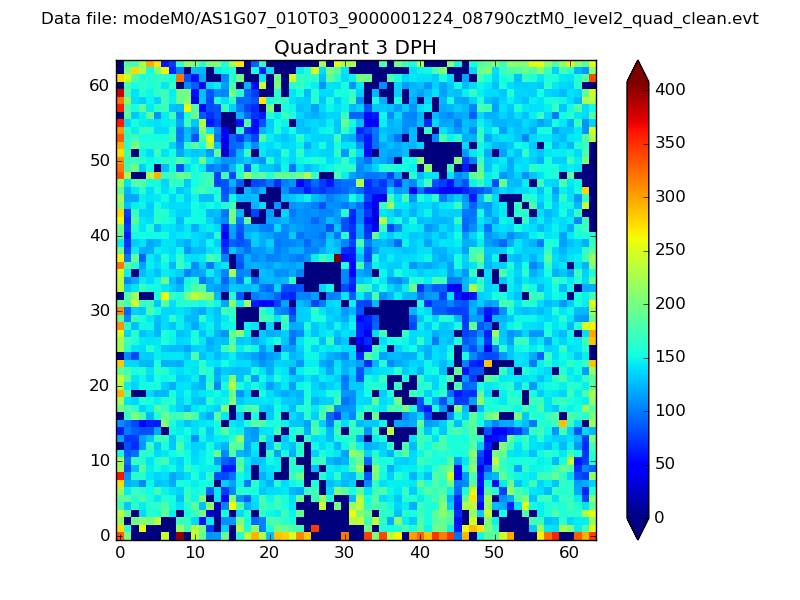 |
 |
Quadrant C |
| Plot type | Count rate plots | Images |
|---|---|---|
| Comparison with Poisson distribution Blue bars denote a histogram of data divided into 1 sec bins. Red curve is a Poisson curve with rate = median count rate of data. |
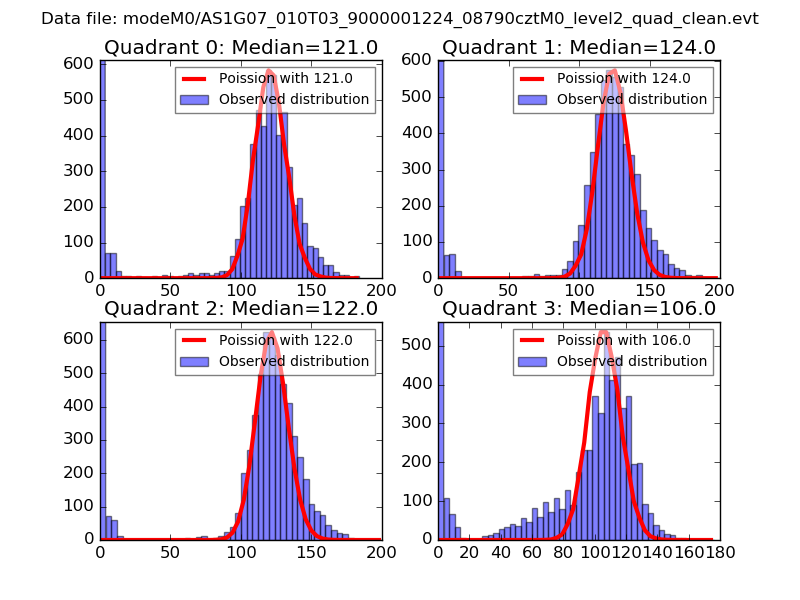 |
 |
| Quadrant-wise count rates Data is divided into 100 sec bins |
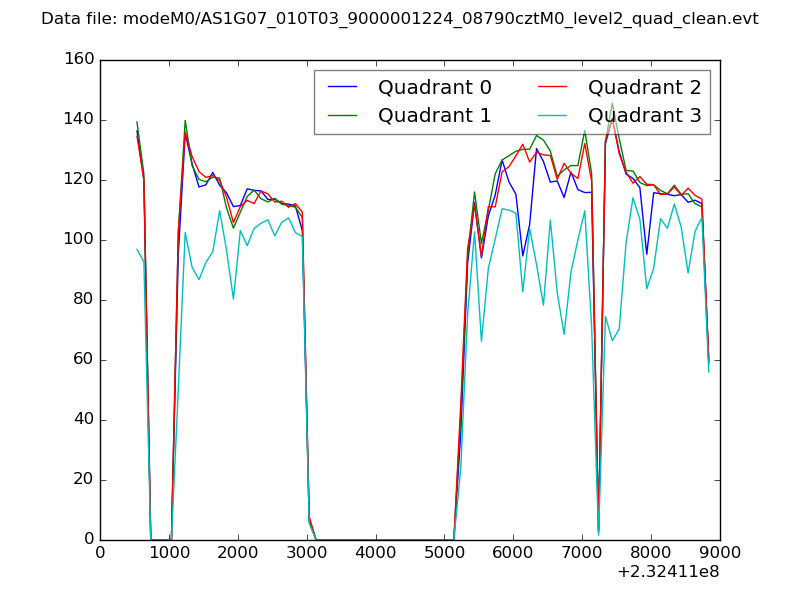 |
|
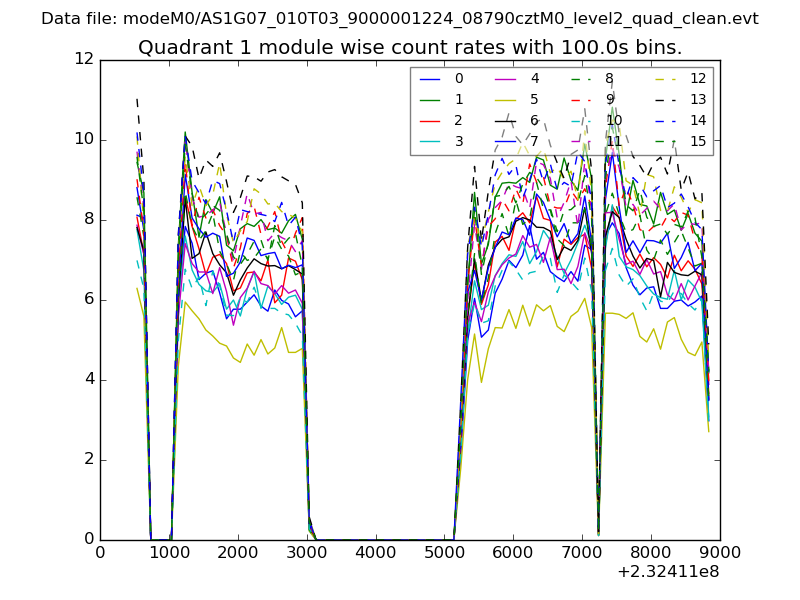
| Module-wise count rates for Quadrant A Data is divided into 100 sec bins |
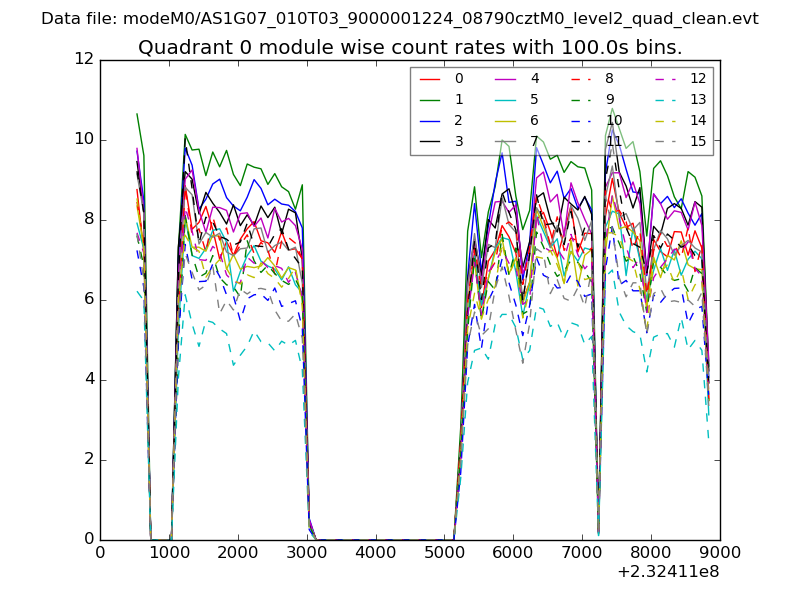 |
 |
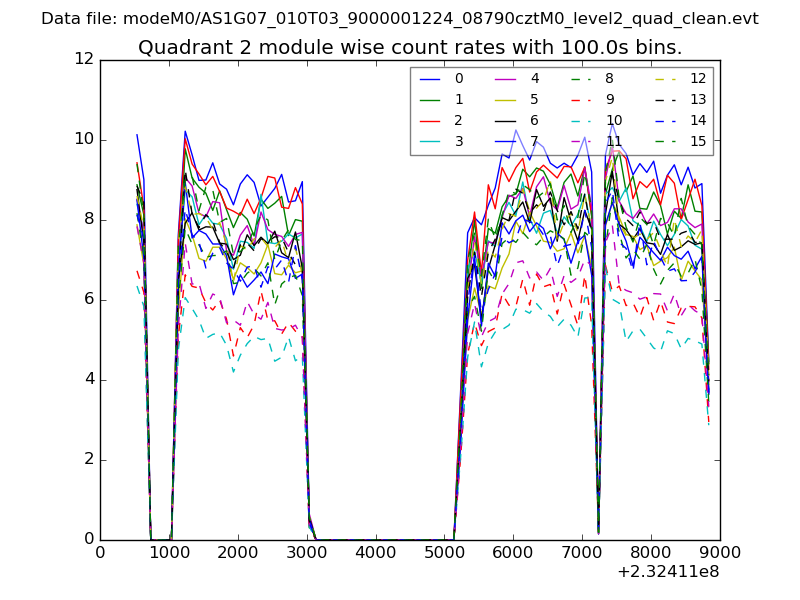
| Module-wise count rates for Quadrant B Data is divided into 100 sec bins |
 |
 |
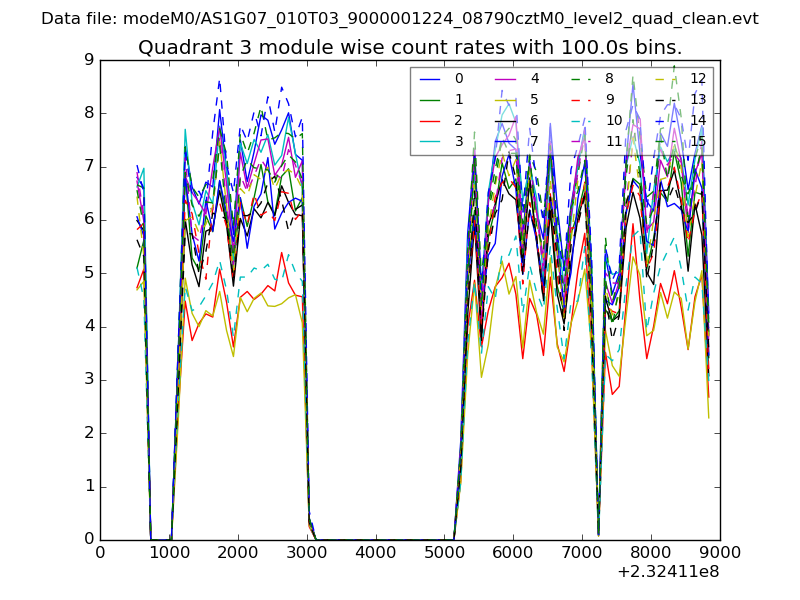
| Module-wise count rates for Quadrant C Data is divided into 100 sec bins |
 |
 |
| Module-wise count rates for Quadrant D Data is divided into 100 sec bins |
 |
 |
| Parameter | Plot |
|---|---|
| CZT HV Monitor | 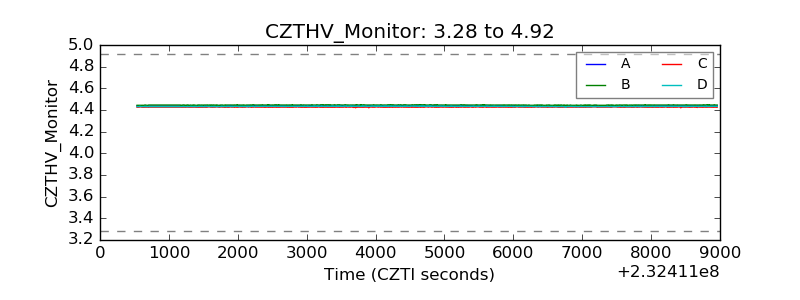 |
| D_VDD | 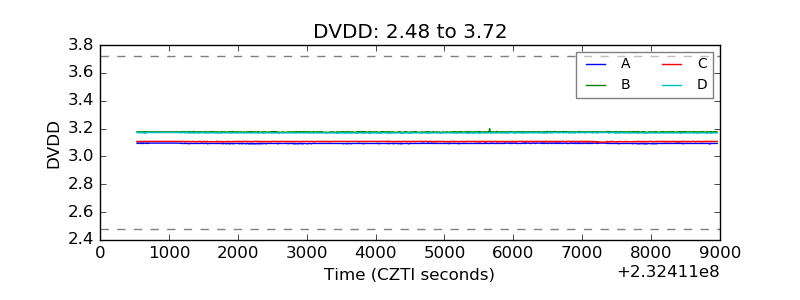 |
| Temperature 1 |  |
| Veto HV Monitor |  |
| Veto LLD | 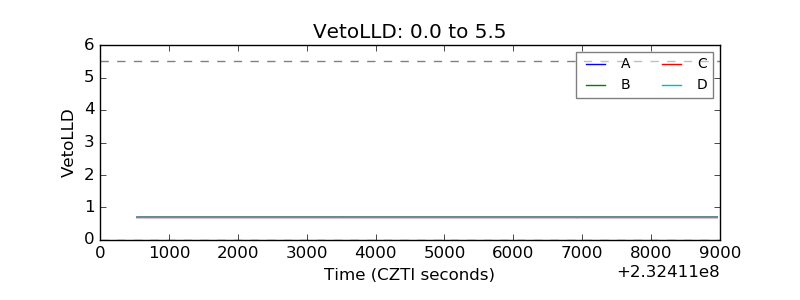 |
| Alpha Counter | 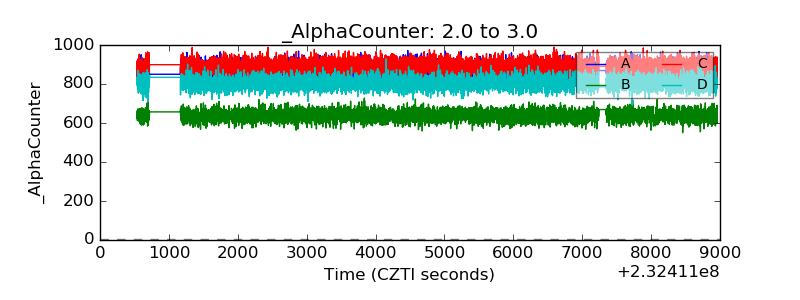 |
| _CPM_Rate | 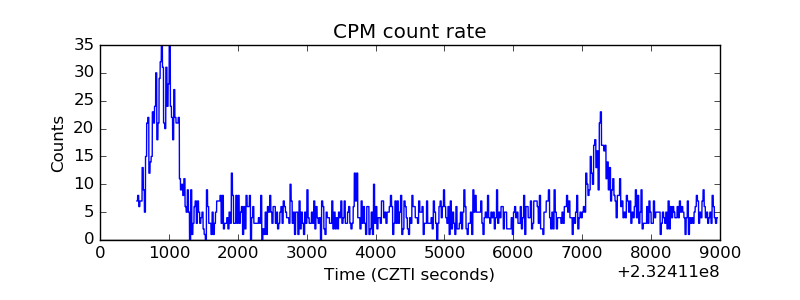 |
| CZT Counter | 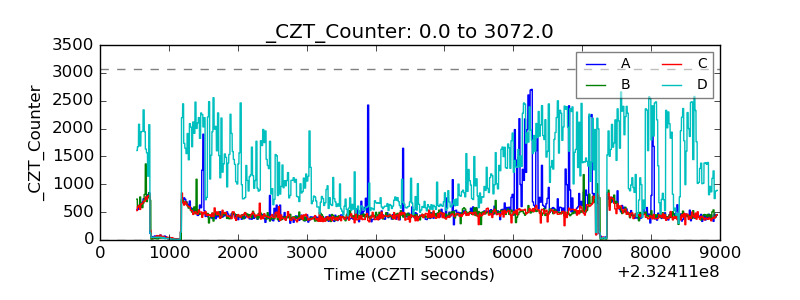 |
| +2.5 Volts monitor |  |
| +5 Volts monitor |  |
| _ROLL_ROT | 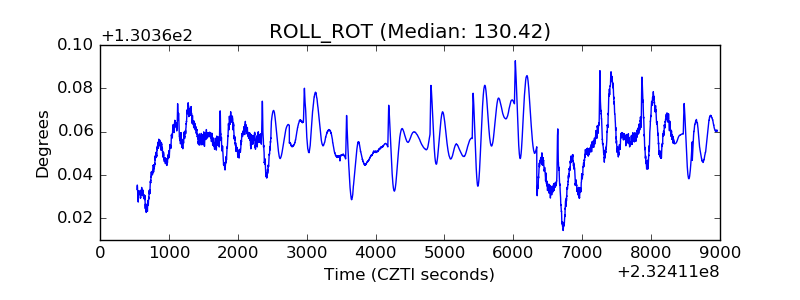 |
| _Roll_DEC | 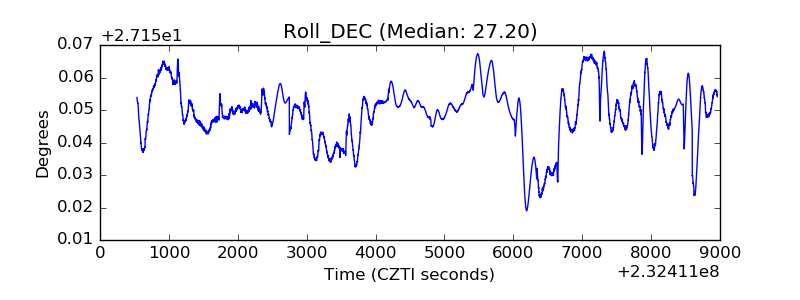 |
| _Roll_RA |  |
| Veto Counter | 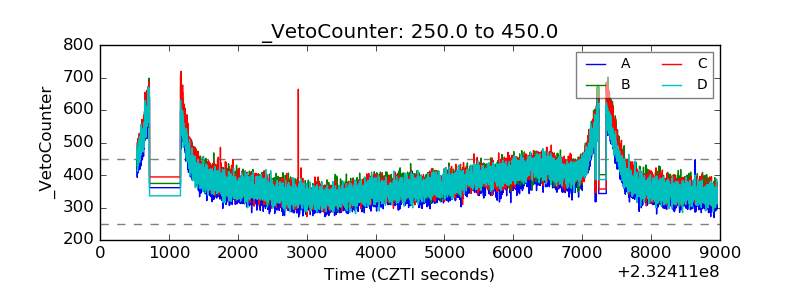 |