| Param | Original file | Final file |
|---|---|---|
| Filename | modeM0/AS1G07_010T03_9000001224_08791cztM0_level2.evt | modeM0/AS1G07_010T03_9000001224_08791cztM0_level2_quad_clean.evt |
| Size (bytes) | 696,807,360 | 95,567,040 |
| Size | 664.5 MB | 91.1 MB |
| Events in quadrant A | 3,759,272 | 616,529 |
| Events in quadrant B | 3,734,749 | 625,857 |
| Events in quadrant C | 3,524,513 | 622,915 |
| Events in quadrant D | 9,563,678 | 492,979 |
| Mode SS | |||
|---|---|---|---|
| Quadrant | BADHDUFLAG | Total packets | Discarded packets |
| A | 0 | 158 | 0 |
| B | 0 | 158 | 0 |
| C | 0 | 158 | 0 |
| D | 0 | 158 | 4 |
| Mode M0 | |||
|---|---|---|---|
| Quadrant | BADHDUFLAG | Total packets | Discarded packets |
| A | 0 | 16396 | 5 |
| B | 0 | 16323 | 4 |
| C | 0 | 15988 | 2 |
| D | 0 | 33911 | 17 |
| Mode M9 | |||
|---|---|---|---|
| Quadrant | BADHDUFLAG | Total packets | Discarded packets |
| A | 0 | 5 | 0 |
| B | 0 | 5 | 0 |
| C | 0 | 5 | 0 |
| D | 0 | 5 | 0 |
| Quadrant | Total seconds | Saturated seconds | Saturation percentage |
|---|---|---|---|
| A | 7698 | 135 | 1.753702% |
| B | 7698 | 155 | 2.013510% |
| C | 7699 | 54 | 0.701390% |
| D | 7697 | 2007 | 26.075094% |
Noise dominated data is calculated using 1-second bins in cleaned event files. If a bin has >2000 counts, and if more than 50% of those come from <1% of pixels, then it is considered to be noise-dominated and hence unusable.
| Quadrant | # 1 sec bins | Bins with >0 counts | Bins with >2000 counts | High rate bins dominated by noise | Noise dominated (total time) | Noise dominated (detector-on time) | Marked lightcurve |
|---|---|---|---|---|---|---|---|
| A | 8109 | 7702 | 19 | 19 | 0.23% | 0.25% | 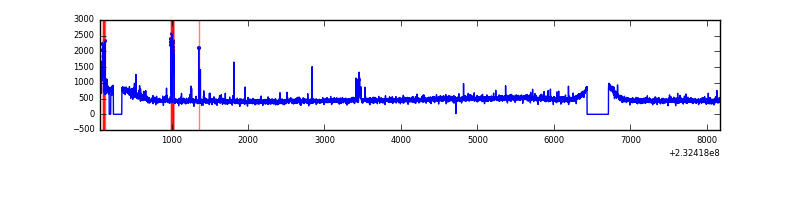 |
| B | 8109 | 7701 | 7 | 7 | 0.09% | 0.09% | 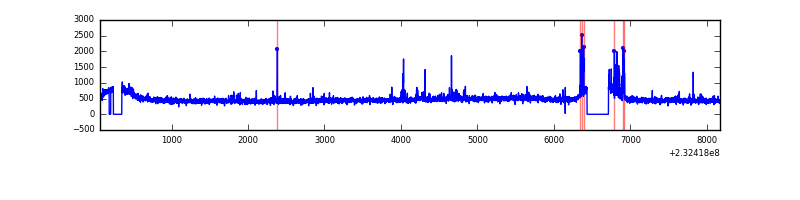 |
| C | 8109 | 7702 | 3 | 3 | 0.04% | 0.04% | 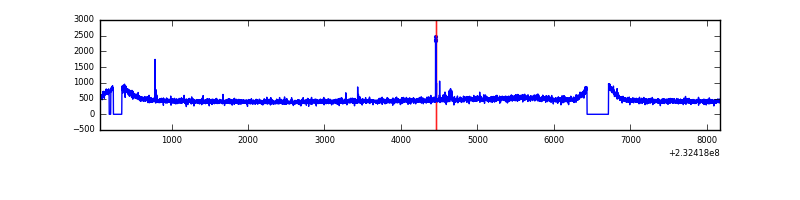 |
| D | 8109 | 7697 | 1629 | 1629 | 20.09% | 21.16% | 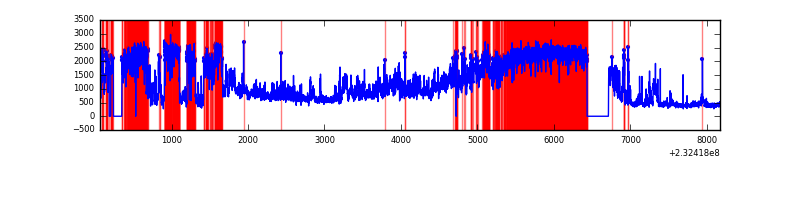 |
Top three noisy pixels from each quadrant. If the there are fewer than three noisy pixels in the level2.evt file, extra rows are filled as -1
| Pixel properties | Quadrant properties | ||||||
|---|---|---|---|---|---|---|---|
| Quadrant | DetID | PixID | Counts | Sigma | Mean | Median | Sigma |
| A | 15 | 223 | 109733 | 589.9 | 907 | 886 | 184.5 |
| A | 8 | 5 | 51675 | 275.25 | 907 | 886 | 184.5 |
| A | 15 | 239 | 35481 | 187.49 | 907 | 886 | 184.5 |
| B | 4 | 173 | 143392 | 808.37 | 916 | 892 | 176.3 |
| B | 4 | 80 | 23608 | 128.86 | 916 | 892 | 176.3 |
| B | 12 | 111 | 20303 | 110.11 | 916 | 892 | 176.3 |
| C | 14 | 234 | 26583 | 122.77 | 894 | 895 | 209.2 |
| C | 14 | 67 | 9566 | 41.44 | 894 | 895 | 209.2 |
| C | 13 | 61 | 6901 | 28.71 | 894 | 895 | 209.2 |
| D | 2 | 16 | 6044697 | 31182.66 | 789 | 766 | 193.8 |
| D | 2 | 152 | 188553 | 968.86 | 789 | 766 | 193.8 |
| D | 2 | 14 | 104739 | 536.43 | 789 | 766 | 193.8 |
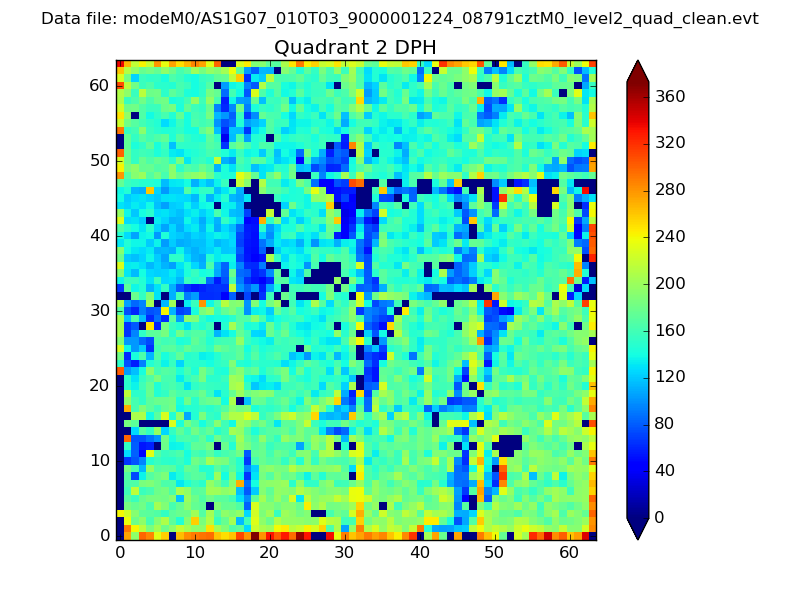
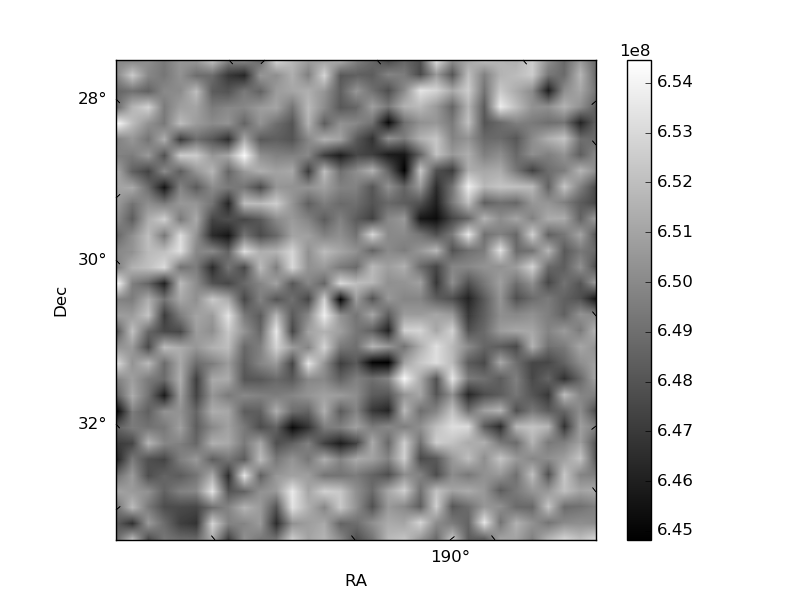
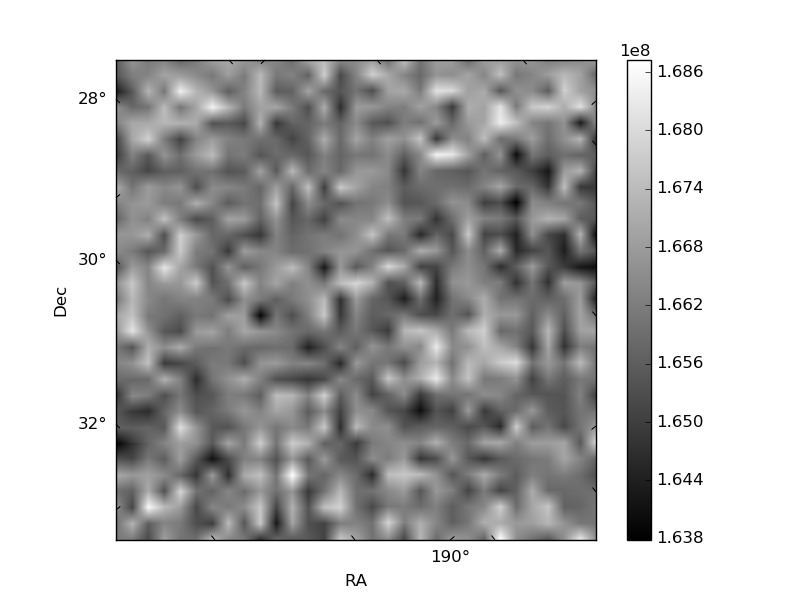
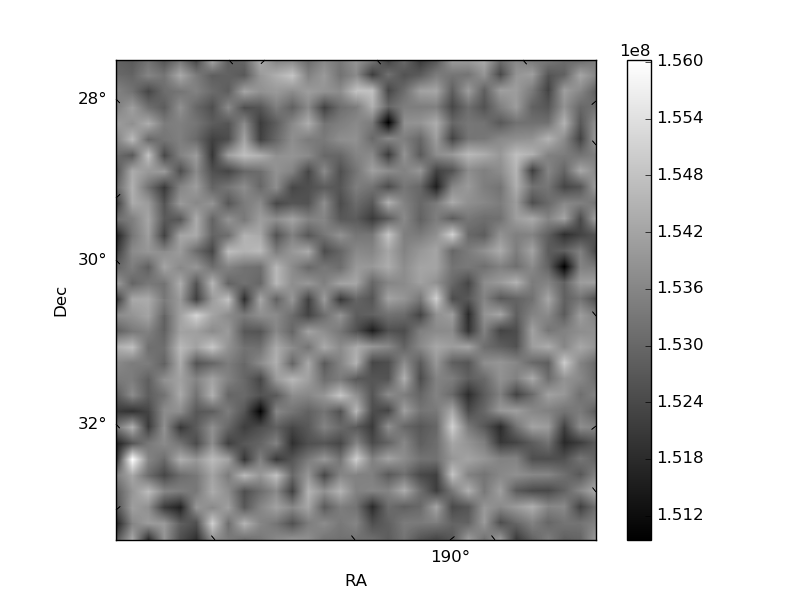
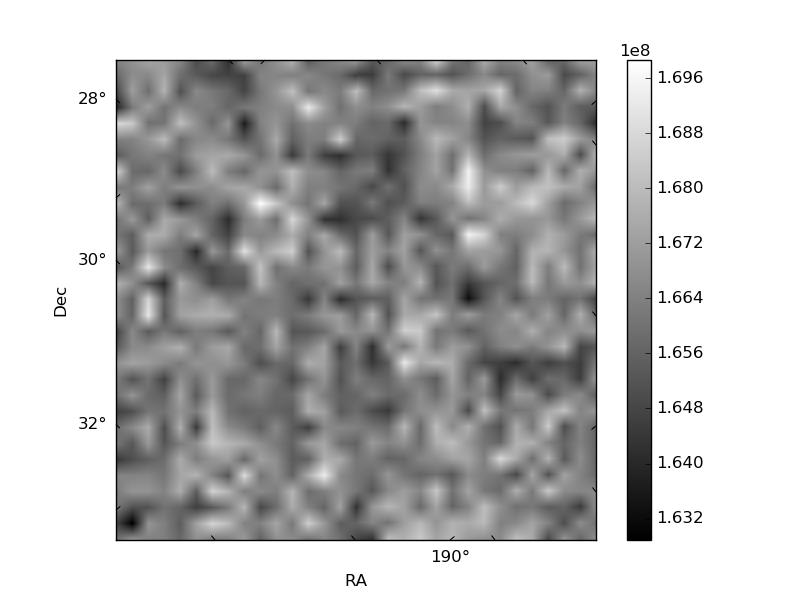
Histogram calculated using DETX and DETY for each event in the final _common_clean file
| Quadrant A | 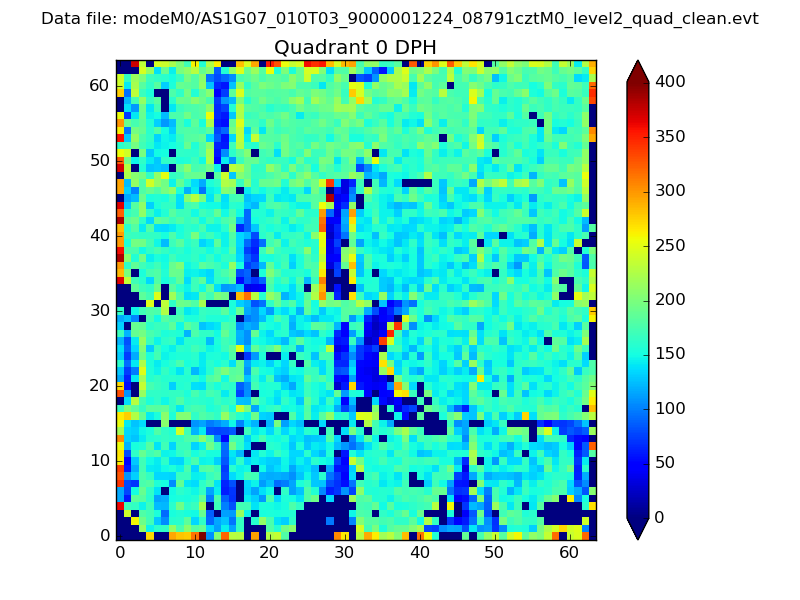 |
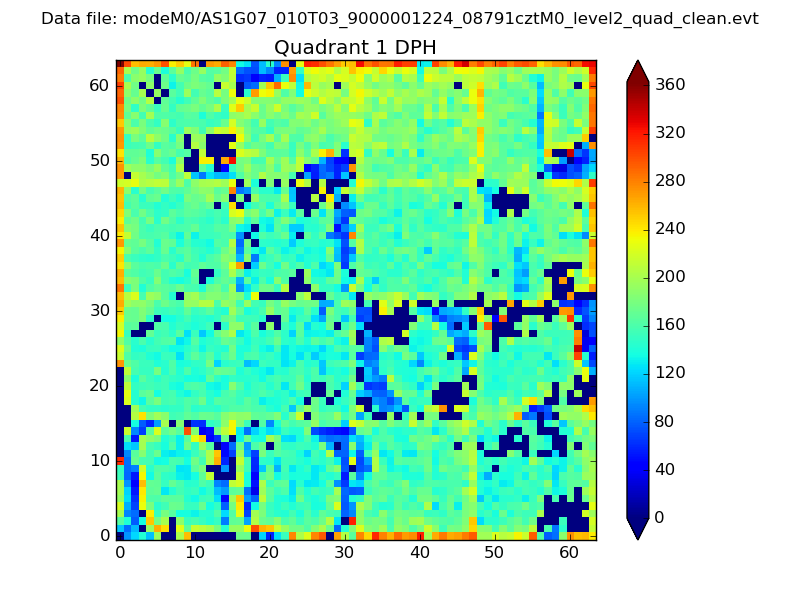 |
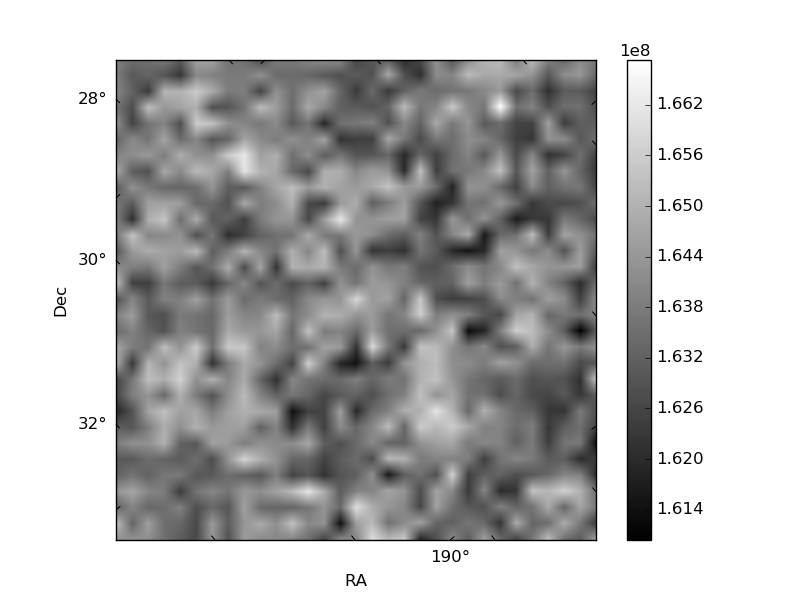
Quadrant B |
|---|---|---|---|
| Quadrant D | 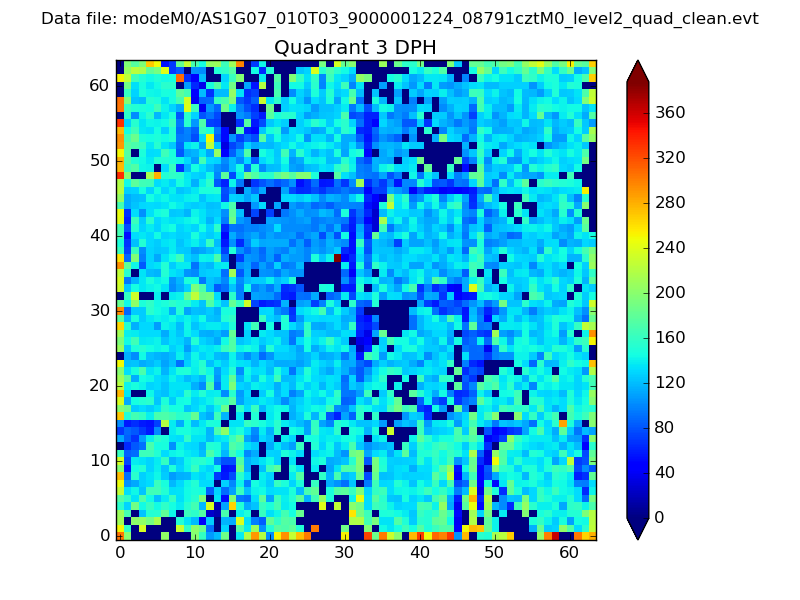 |
 |
Quadrant C |
| Plot type | Count rate plots | Images |
|---|---|---|
| Comparison with Poisson distribution Blue bars denote a histogram of data divided into 1 sec bins. Red curve is a Poisson curve with rate = median count rate of data. |
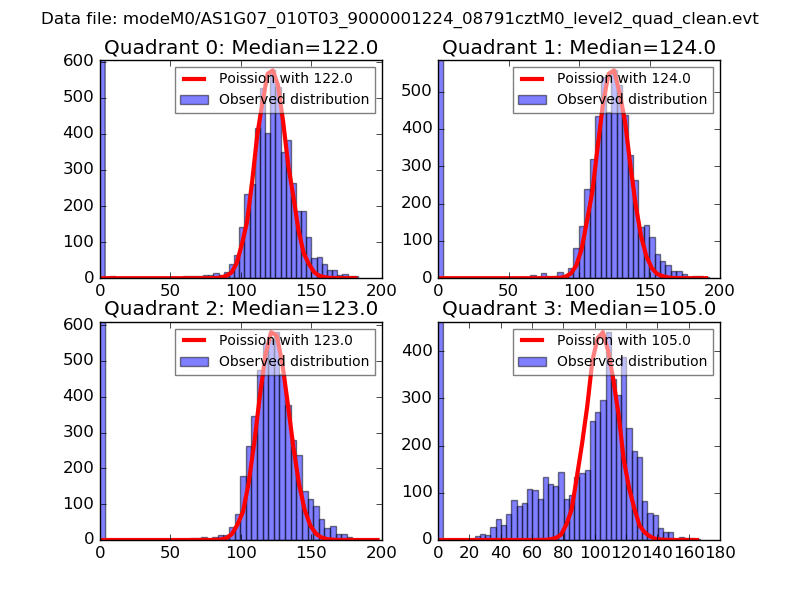 |
 |
| Quadrant-wise count rates Data is divided into 100 sec bins |
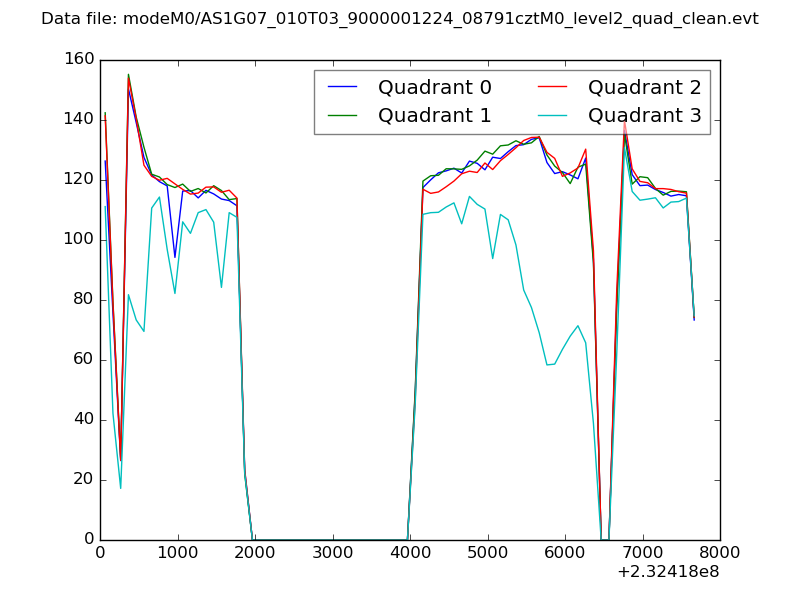 |
|
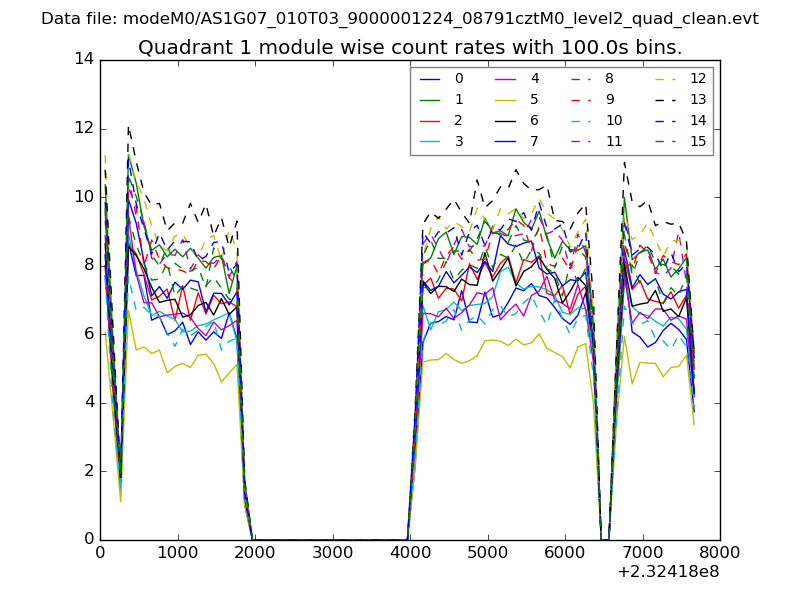
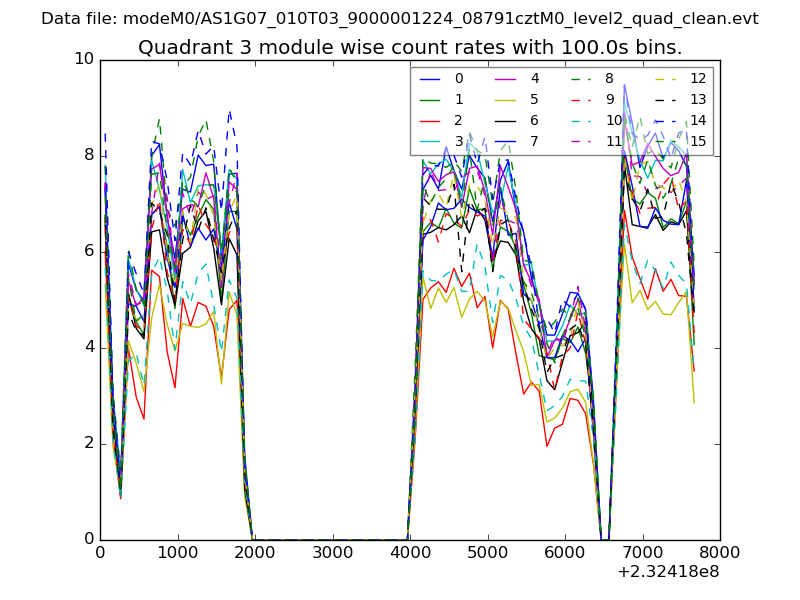
| Module-wise count rates for Quadrant A Data is divided into 100 sec bins |
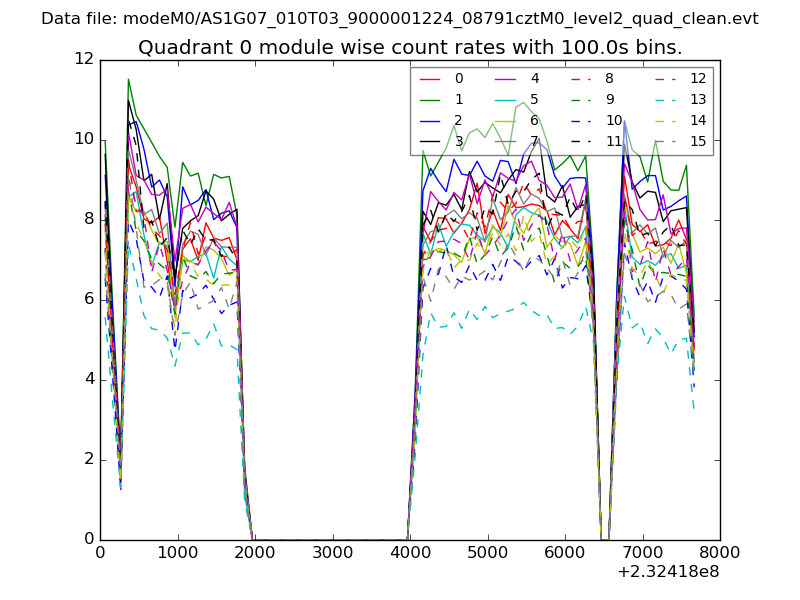 |
 |
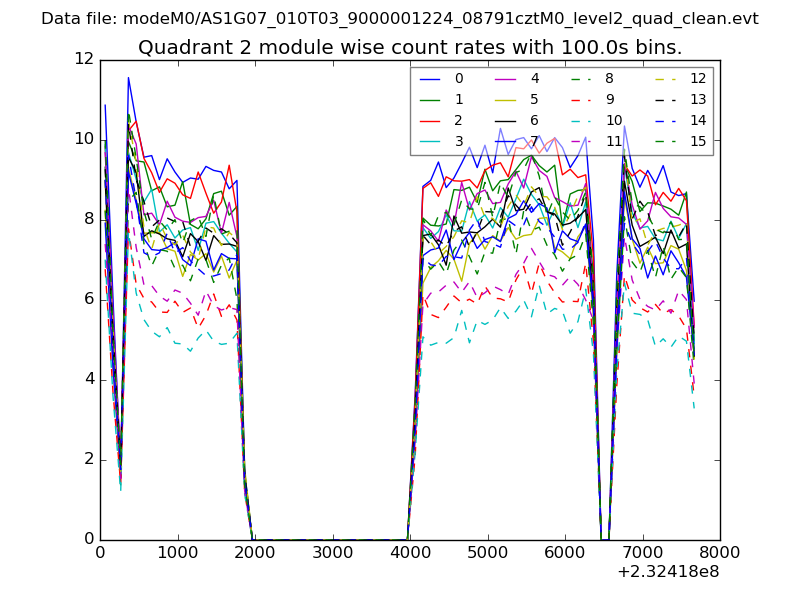
| Module-wise count rates for Quadrant B Data is divided into 100 sec bins |
 |
 |
| Module-wise count rates for Quadrant C Data is divided into 100 sec bins |
 |
 |
| Module-wise count rates for Quadrant D Data is divided into 100 sec bins |
 |
 |
| Parameter | Plot |
|---|---|
| CZT HV Monitor | 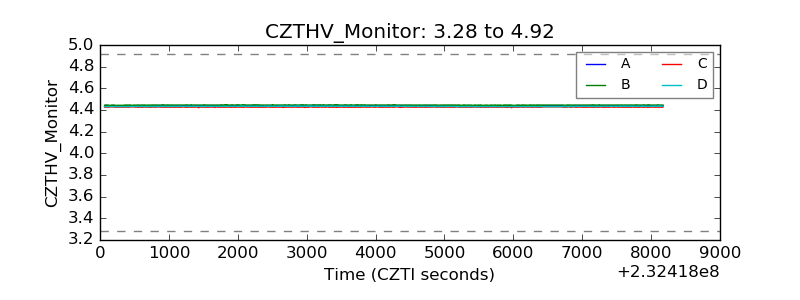 |
| D_VDD | 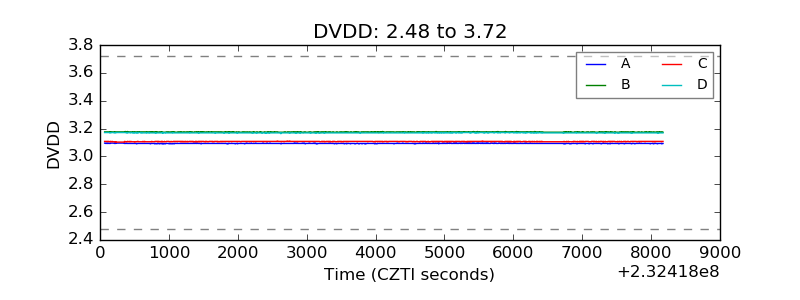 |
| Temperature 1 | 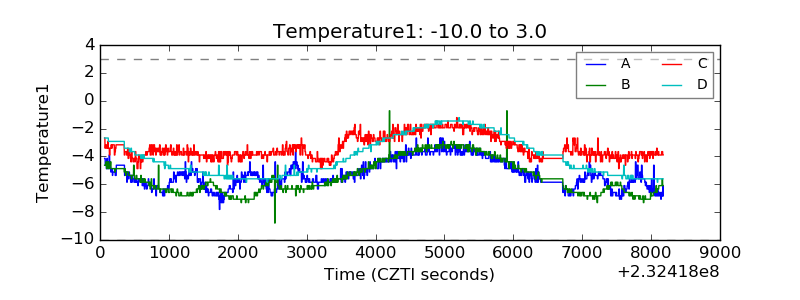 |
| Veto HV Monitor | 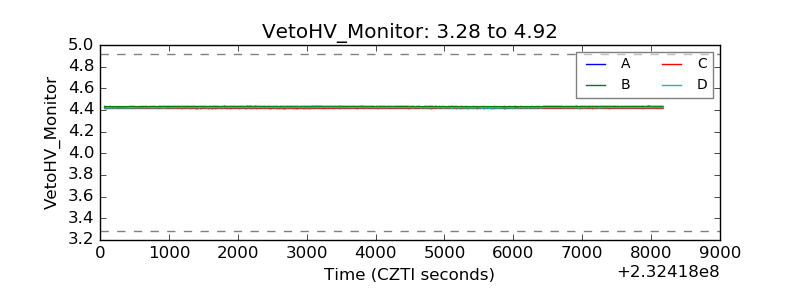 |
| Veto LLD | 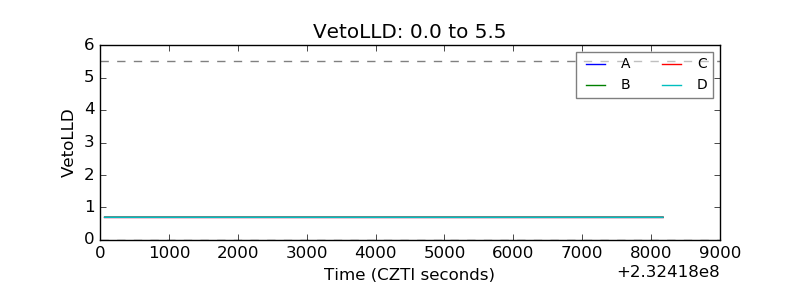 |
| Alpha Counter | 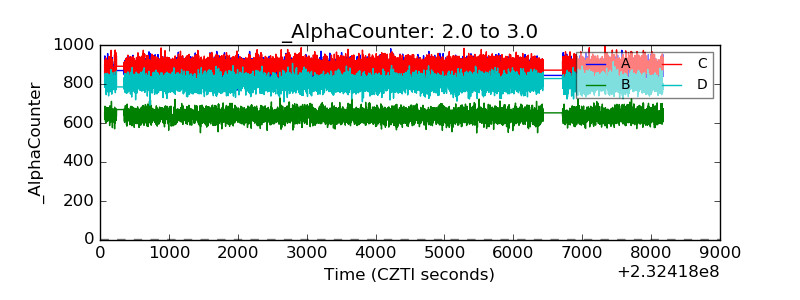 |
| _CPM_Rate | 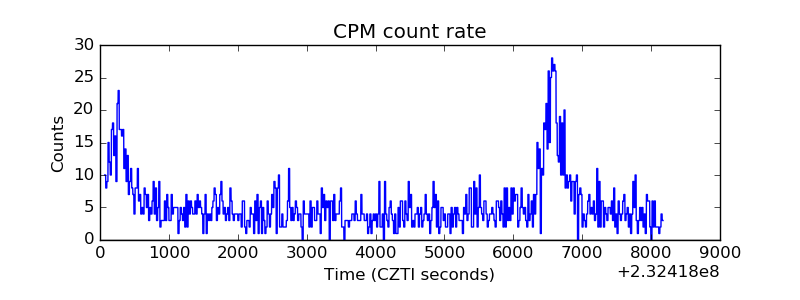 |
| CZT Counter | 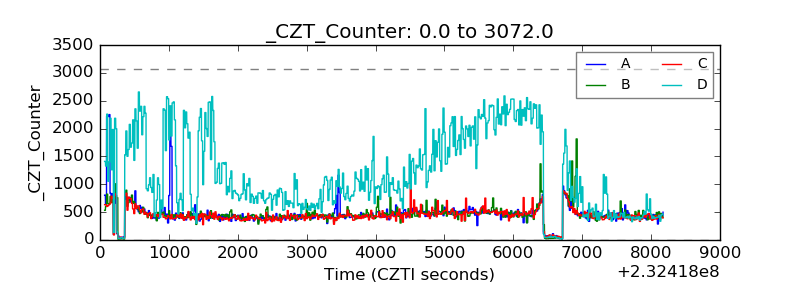 |
| +2.5 Volts monitor | 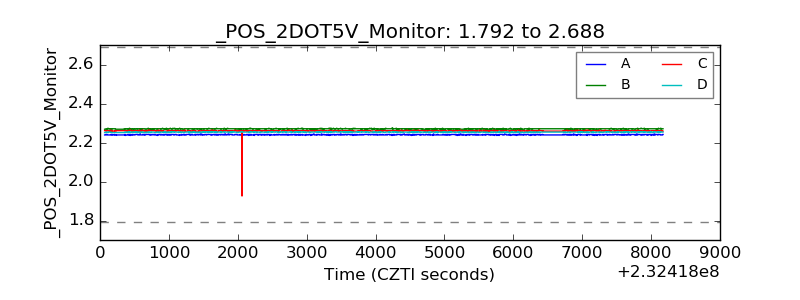 |
| +5 Volts monitor |  |
| _ROLL_ROT | 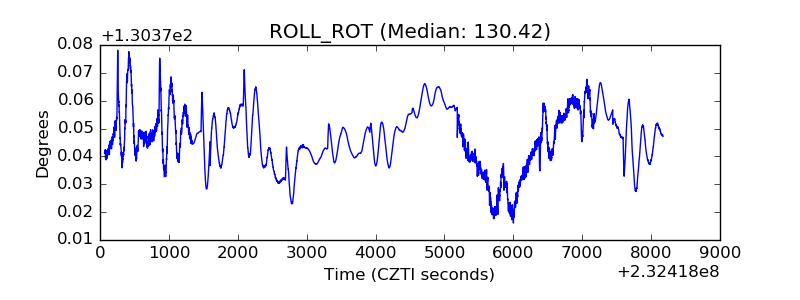 |
| _Roll_DEC | 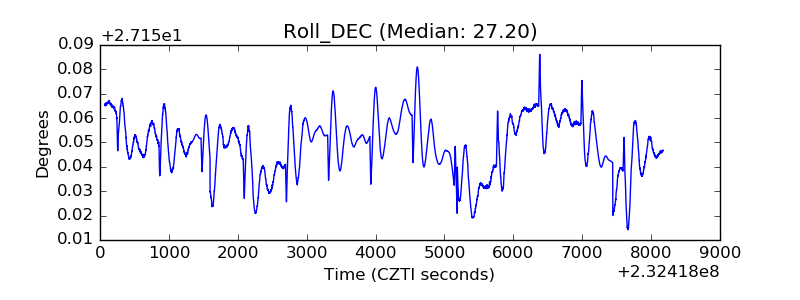 |
| _Roll_RA | 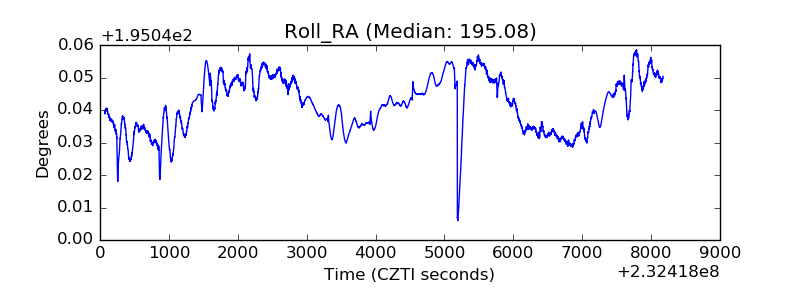 |
| Veto Counter | 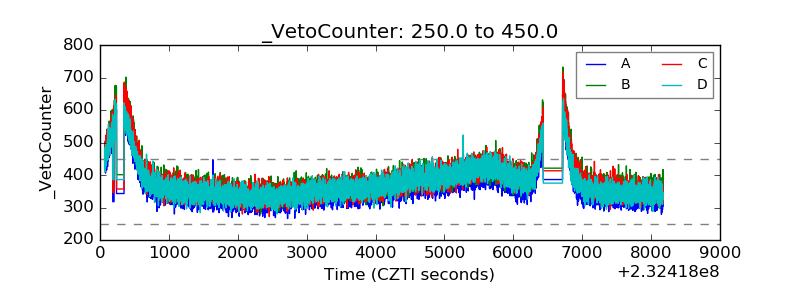 |