| Param | Original file | Final file |
|---|---|---|
| Filename | modeM0/AS1G07_010T03_9000001224_08793cztM0_level2.evt | modeM0/AS1G07_010T03_9000001224_08793cztM0_level2_quad_clean.evt |
| Size (bytes) | 271,788,480 | 38,557,440 |
| Size | 259.2 MB | 36.8 MB |
| Events in quadrant A | 2,000,027 | 222,460 |
| Events in quadrant B | 1,962,836 | 225,529 |
| Events in quadrant C | 1,771,609 | 224,941 |
| Events in quadrant D | 2,219,385 | 208,030 |
| Mode SS | |||
|---|---|---|---|
| Quadrant | BADHDUFLAG | Total packets | Discarded packets |
| A | 0 | 84 | 0 |
| B | 0 | 84 | 2 |
| C | 0 | 84 | 0 |
| D | 0 | 84 | 4 |
| Mode M0 | |||
|---|---|---|---|
| Quadrant | BADHDUFLAG | Total packets | Discarded packets |
| A | 0 | 8963 | 176 |
| B | 0 | 8789 | 132 |
| C | 0 | 8475 | 150 |
| D | 0 | 9734 | 173 |
| Mode M9 | |||
|---|---|---|---|
| Quadrant | BADHDUFLAG | Total packets | Discarded packets |
| A | 0 | 3 | 0 |
| B | 0 | 3 | 0 |
| C | 0 | 3 | 0 |
| D | 0 | 3 | 0 |
| Quadrant | Total seconds | Saturated seconds | Saturation percentage |
|---|---|---|---|
| A | 4044 | 41 | 1.013848% |
| B | 4065 | 79 | 1.943419% |
| C | 4056 | 21 | 0.517751% |
| D | 4064 | 143 | 3.518701% |
Noise dominated data is calculated using 1-second bins in cleaned event files. If a bin has >2000 counts, and if more than 50% of those come from <1% of pixels, then it is considered to be noise-dominated and hence unusable.
| Quadrant | # 1 sec bins | Bins with >0 counts | Bins with >2000 counts | High rate bins dominated by noise | Noise dominated (total time) | Noise dominated (detector-on time) | Marked lightcurve |
|---|---|---|---|---|---|---|---|
| A | 4410 | 4121 | 6 | 6 | 0.14% | 0.15% | 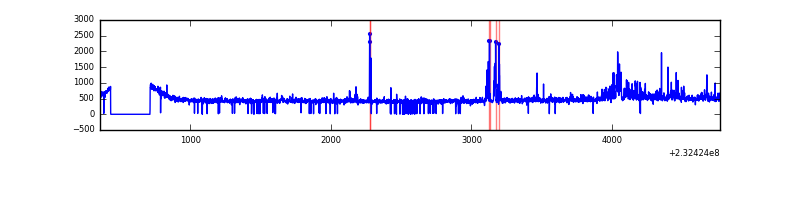 |
| B | 4410 | 4127 | 5 | 5 | 0.11% | 0.12% | 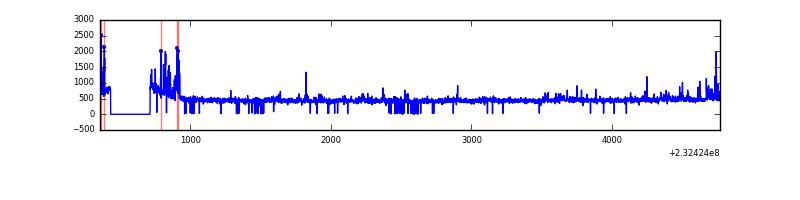 |
| C | 4410 | 4128 | 0 | 0 | 0.00% | 0.00% | 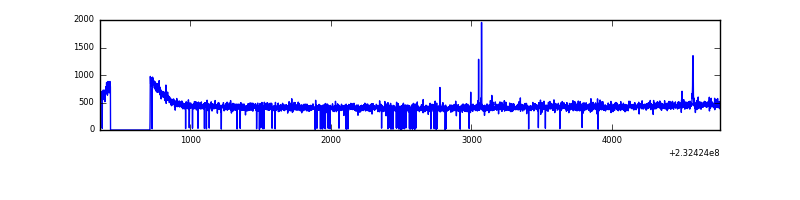 |
| D | 4410 | 4121 | 66 | 66 | 1.50% | 1.60% | 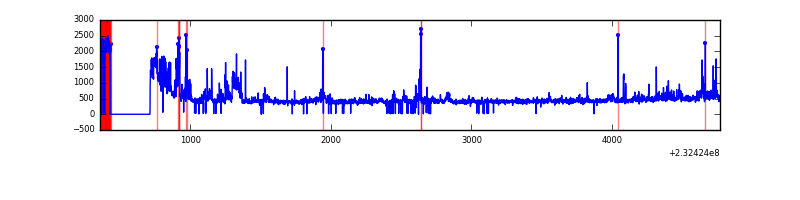 |
Top three noisy pixels from each quadrant. If the there are fewer than three noisy pixels in the level2.evt file, extra rows are filled as -1
| Pixel properties | Quadrant properties | ||||||
|---|---|---|---|---|---|---|---|
| Quadrant | DetID | PixID | Counts | Sigma | Mean | Median | Sigma |
| A | 13 | 251 | 174309 | 1808.2 | 461 | 450 | 96.2 |
| A | 8 | 5 | 28562 | 292.38 | 461 | 450 | 96.2 |
| A | 15 | 223 | 7367 | 71.94 | 461 | 450 | 96.2 |
| B | 4 | 173 | 118317 | 1269.94 | 467 | 454 | 92.8 |
| B | 4 | 80 | 24821 | 262.55 | 467 | 454 | 92.8 |
| B | 12 | 111 | 10642 | 109.77 | 467 | 454 | 92.8 |
| C | 14 | 234 | 10968 | 98.79 | 451 | 451 | 106.5 |
| C | 13 | 61 | 3394 | 27.64 | 451 | 451 | 106.5 |
| C | 9 | 68 | 1233 | 7.35 | 451 | 451 | 106.5 |
| D | 2 | 16 | 362568 | 3233.89 | 436 | 425 | 112.0 |
| D | 2 | 152 | 103035 | 916.29 | 436 | 425 | 112.0 |
| D | 2 | 14 | 52259 | 462.87 | 436 | 425 | 112.0 |
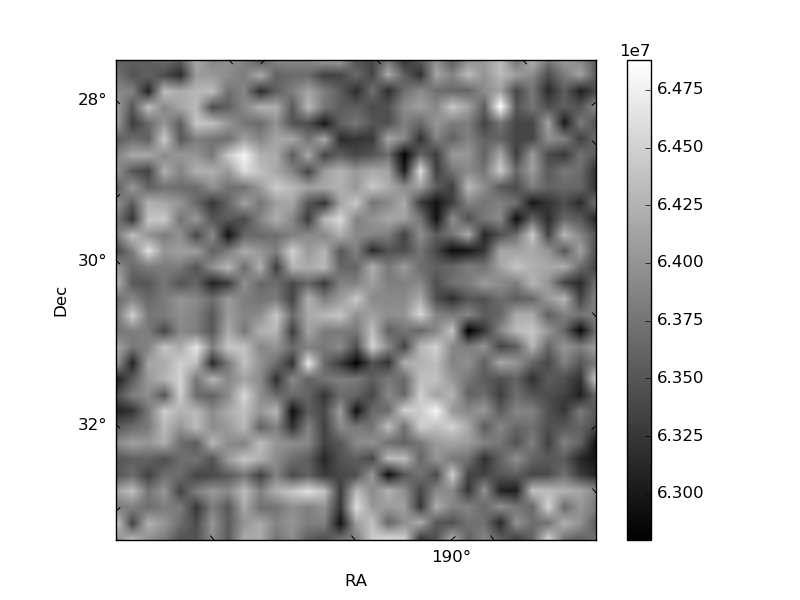
Histogram calculated using DETX and DETY for each event in the final _common_clean file
| Quadrant A | 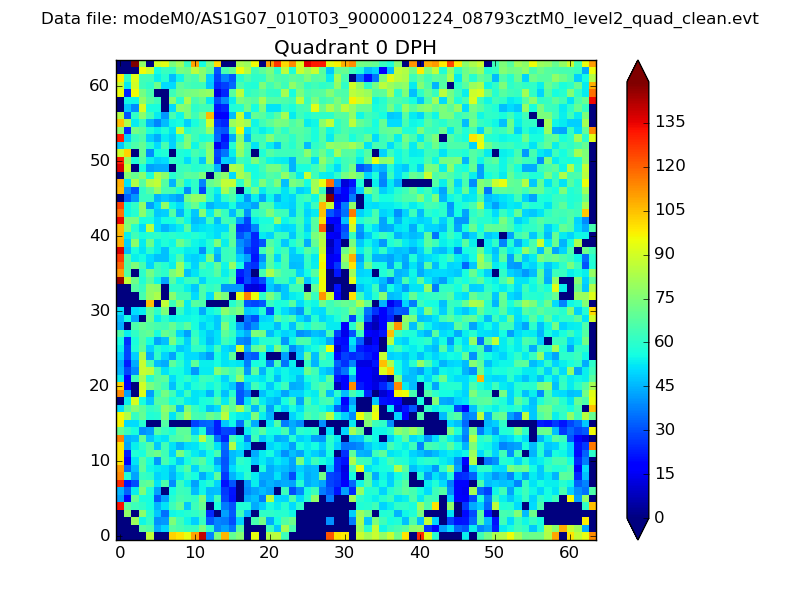 |
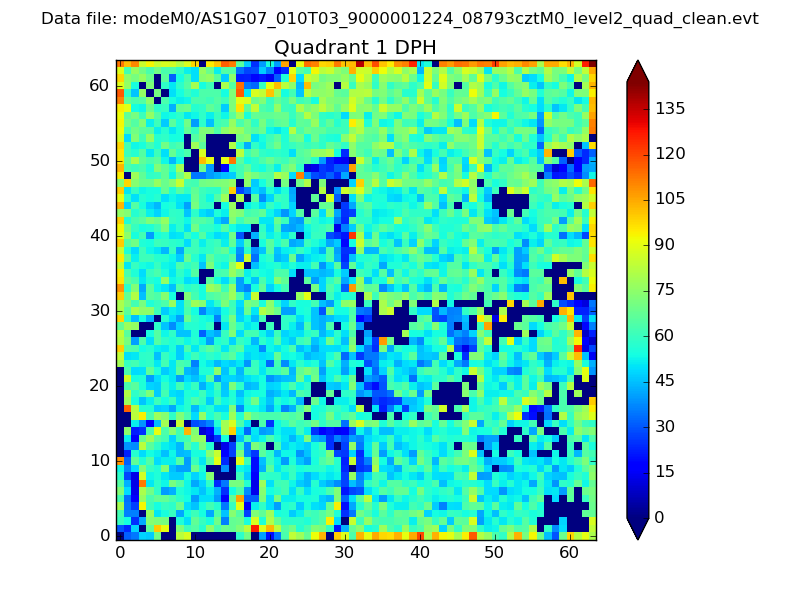 |
Quadrant B |
|---|---|---|---|
| Quadrant D |  |
 |
Quadrant C |
| Plot type | Count rate plots | Images |
|---|---|---|
| Comparison with Poisson distribution Blue bars denote a histogram of data divided into 1 sec bins. Red curve is a Poisson curve with rate = median count rate of data. |
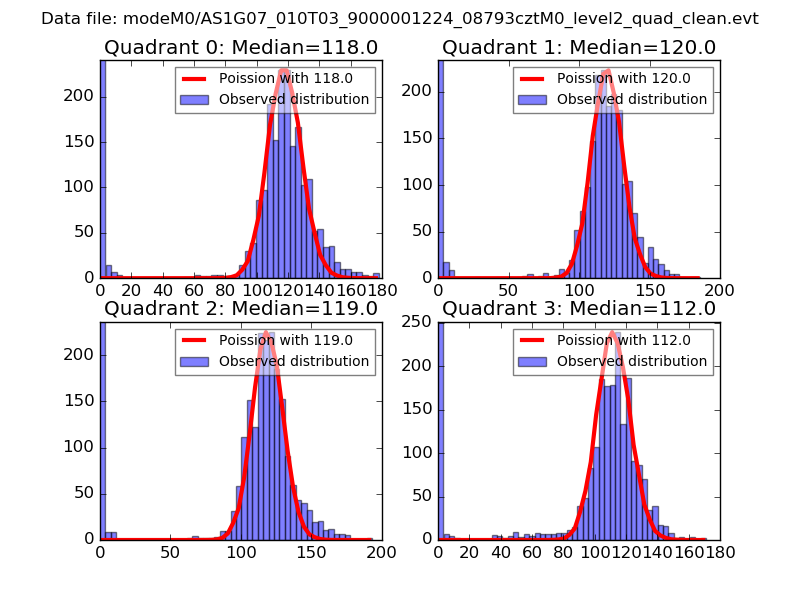 |
 |
| Quadrant-wise count rates Data is divided into 100 sec bins |
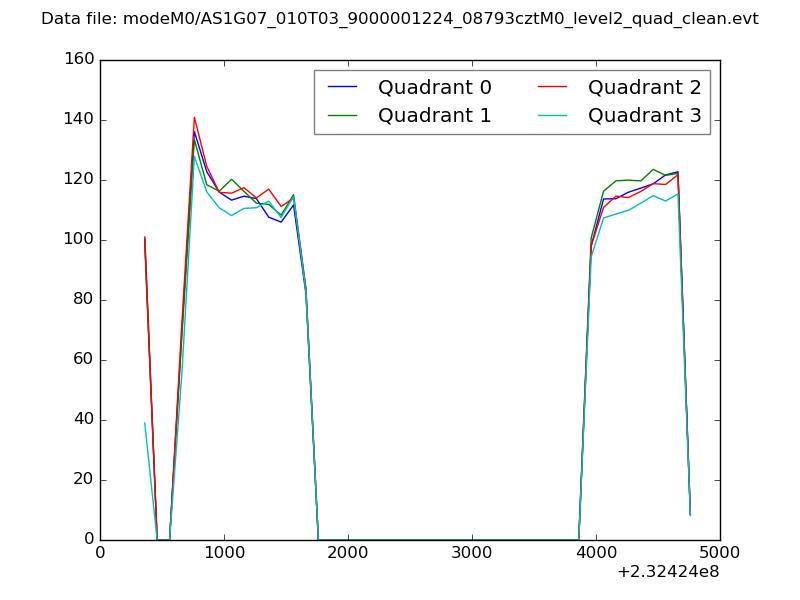 |
|
| Module-wise count rates for Quadrant A Data is divided into 100 sec bins |
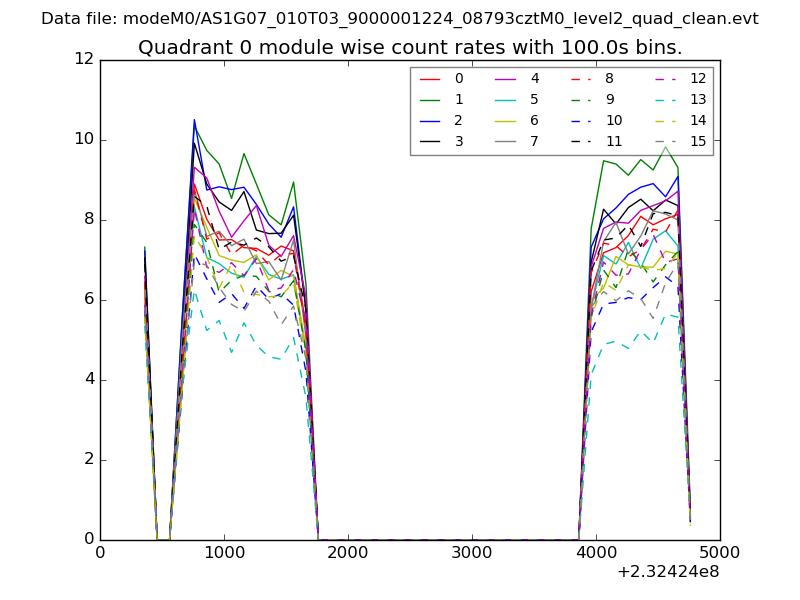 |
 |
| Module-wise count rates for Quadrant B Data is divided into 100 sec bins |
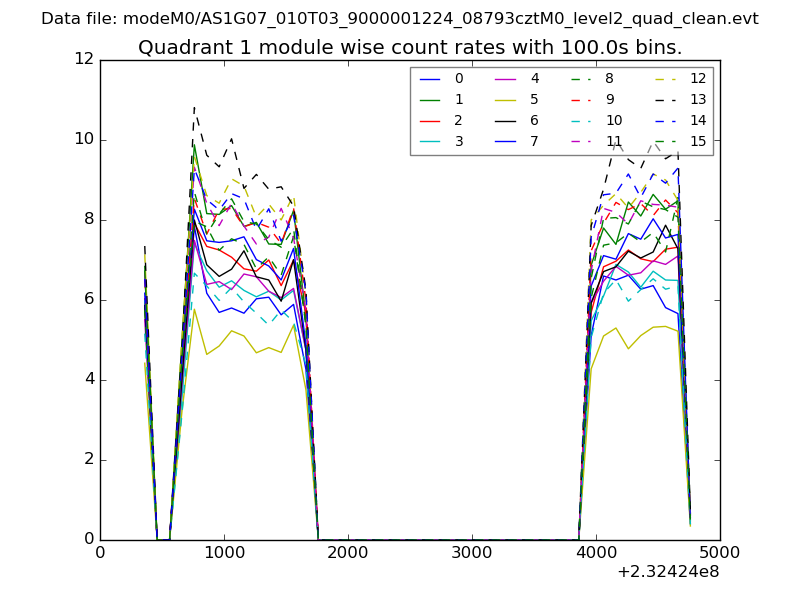 |
 |
| Module-wise count rates for Quadrant C Data is divided into 100 sec bins |
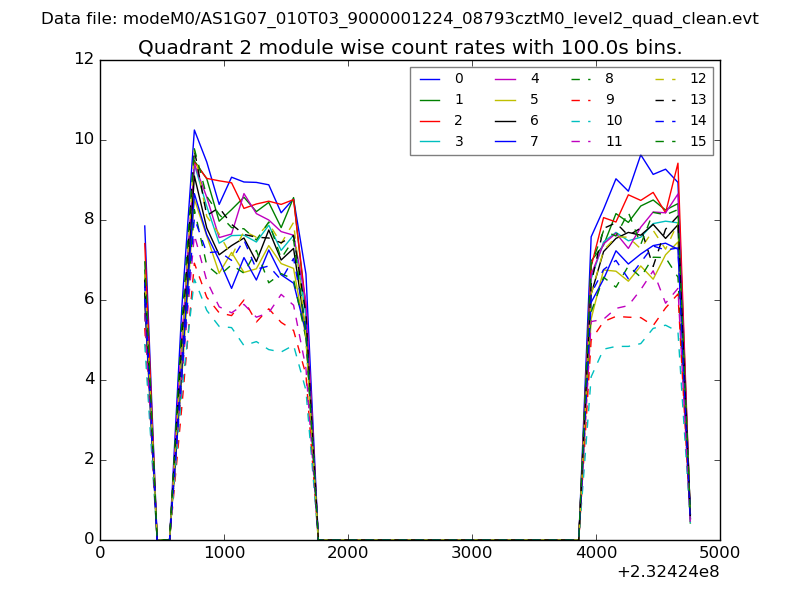 |
 |
| Module-wise count rates for Quadrant D Data is divided into 100 sec bins |
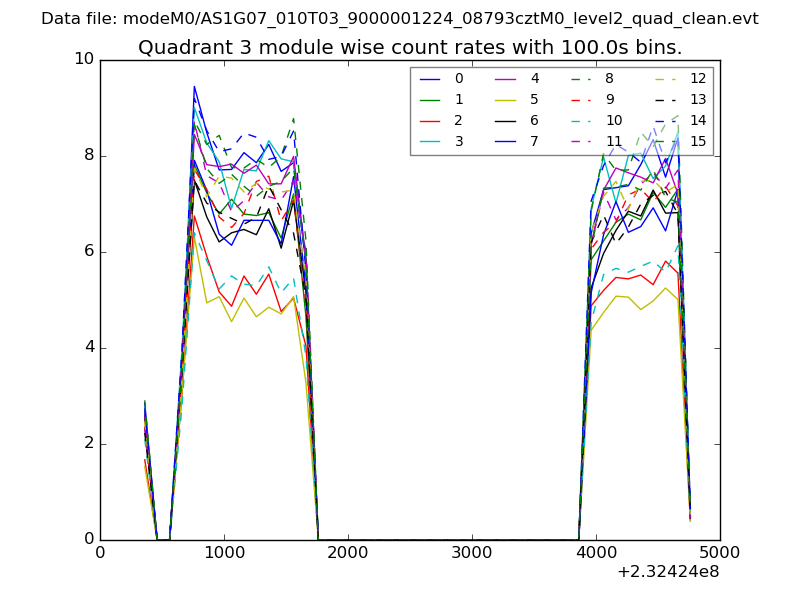 |
 |
| Parameter | Plot |
|---|---|
| CZT HV Monitor | 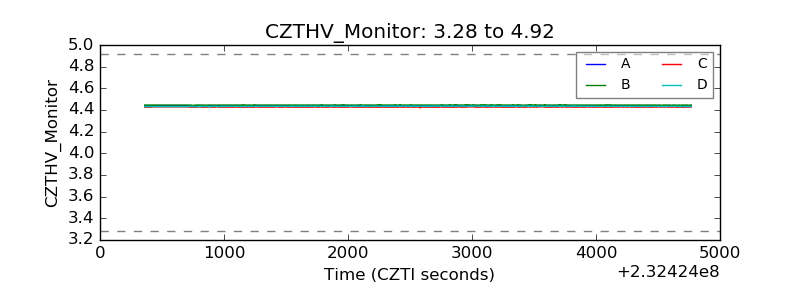 |
| D_VDD | 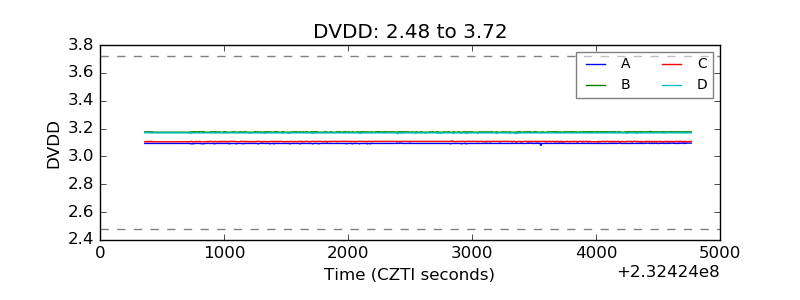 |
| Temperature 1 | 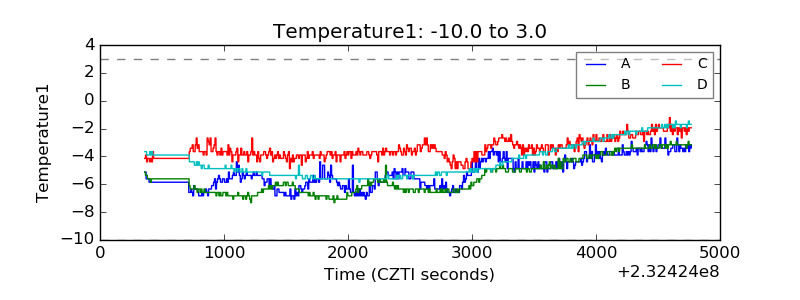 |
| Veto HV Monitor | 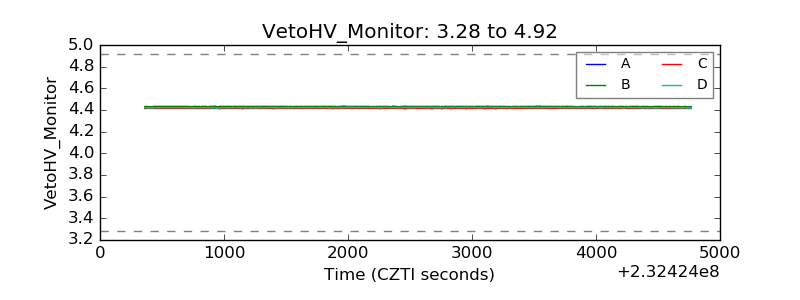 |
| Veto LLD | 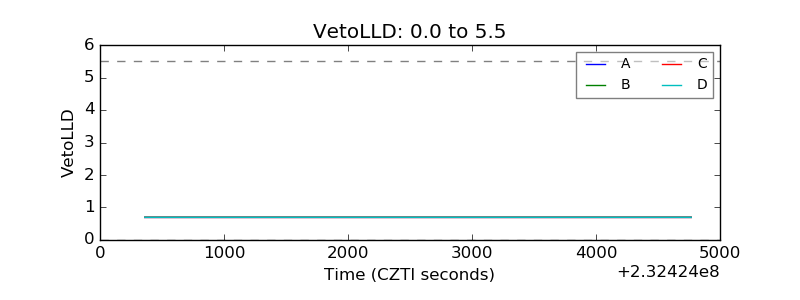 |
| Alpha Counter | 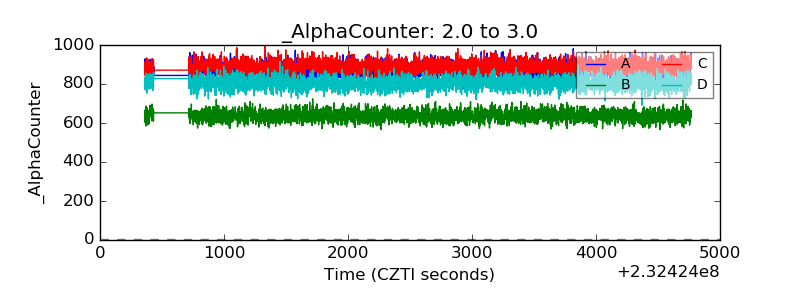 |
| _CPM_Rate | 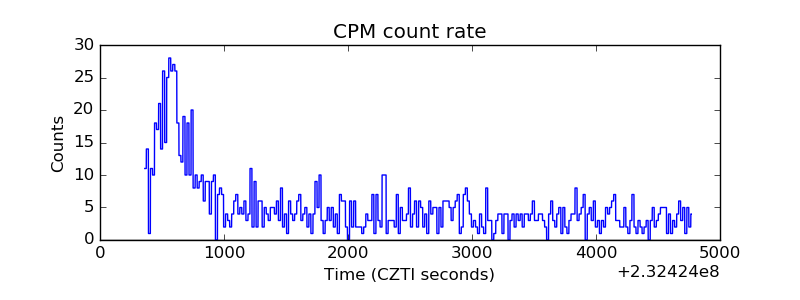 |
| CZT Counter | 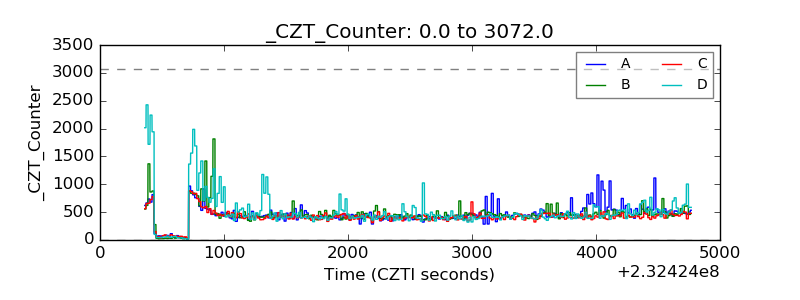 |
| +2.5 Volts monitor |  |
| +5 Volts monitor |  |
| _ROLL_ROT | 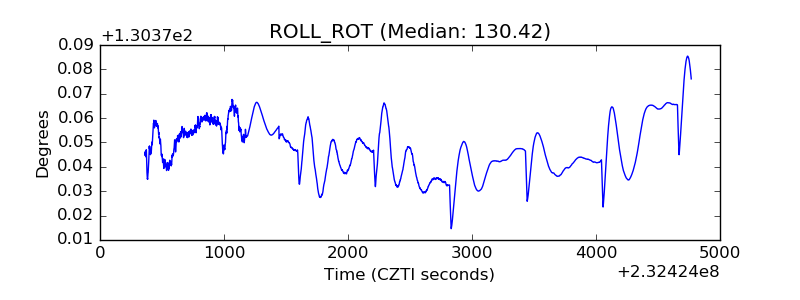 |
| _Roll_DEC | 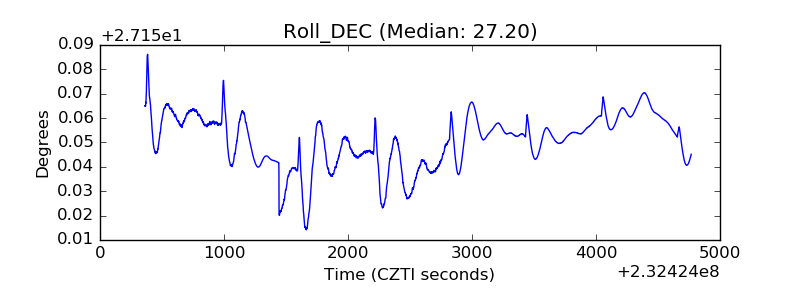 |
| _Roll_RA | 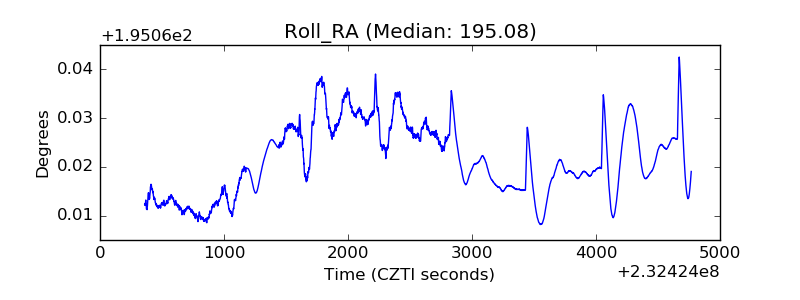 |
| Veto Counter | 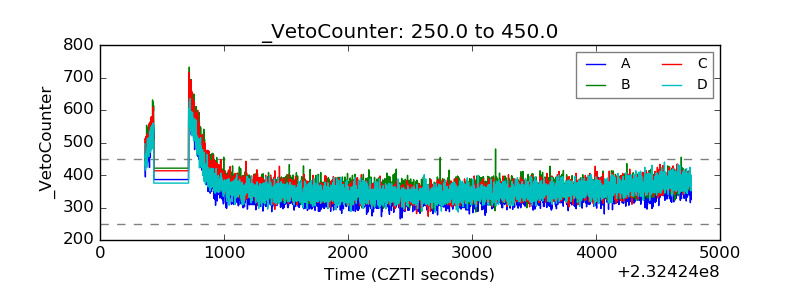 |