| Param | Original file | Final file |
|---|---|---|
| Filename | modeM0/AS1G07_010T03_9000001224_08794cztM0_level2.evt | modeM0/AS1G07_010T03_9000001224_08794cztM0_level2_quad_clean.evt |
| Size (bytes) | 1,121,760,000 | 172,463,040 |
| Size | 1.0 GB | 164.5 MB |
| Events in quadrant A | 7,416,681 | 1,066,327 |
| Events in quadrant B | 7,022,574 | 1,076,848 |
| Events in quadrant C | 6,711,318 | 1,064,211 |
| Events in quadrant D | 11,829,638 | 1,001,809 |
| Mode SS | |||
|---|---|---|---|
| Quadrant | BADHDUFLAG | Total packets | Discarded packets |
| A | 0 | 302 | 0 |
| B | 0 | 302 | 0 |
| C | 0 | 302 | 2 |
| D | 0 | 302 | 0 |
| Mode M0 | |||
|---|---|---|---|
| Quadrant | BADHDUFLAG | Total packets | Discarded packets |
| A | 0 | 31280 | 106 |
| B | 0 | 30549 | 114 |
| C | 0 | 30042 | 125 |
| D | 0 | 45382 | 294 |
| Mode M9 | |||
|---|---|---|---|
| Quadrant | BADHDUFLAG | Total packets | Discarded packets |
| A | 0 | 18 | 0 |
| B | 0 | 18 | 0 |
| C | 0 | 18 | 0 |
| D | 0 | 18 | 0 |
| Quadrant | Total seconds | Saturated seconds | Saturation percentage |
|---|---|---|---|
| A | 14692 | 182 | 1.238769% |
| B | 14687 | 203 | 1.382175% |
| C | 14680 | 105 | 0.715259% |
| D | 14649 | 1145 | 7.816233% |
Noise dominated data is calculated using 1-second bins in cleaned event files. If a bin has >2000 counts, and if more than 50% of those come from <1% of pixels, then it is considered to be noise-dominated and hence unusable.
| Quadrant | # 1 sec bins | Bins with >0 counts | Bins with >2000 counts | High rate bins dominated by noise | Noise dominated (total time) | Noise dominated (detector-on time) | Marked lightcurve |
|---|---|---|---|---|---|---|---|
| A | 16642 | 14733 | 9 | 9 | 0.05% | 0.06% | 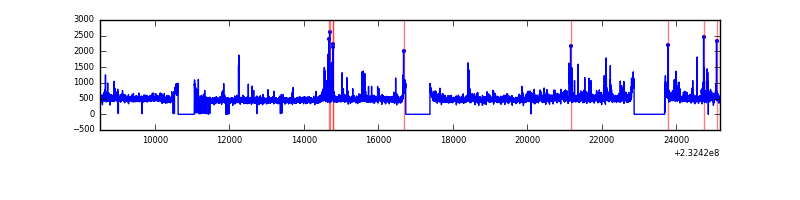 |
| B | 16642 | 14734 | 10 | 10 | 0.06% | 0.07% | 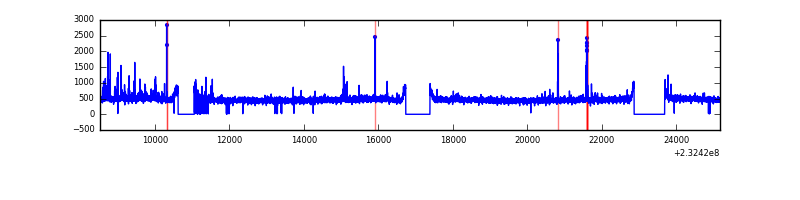 |
| C | 16642 | 14732 | 1 | 1 | 0.01% | 0.01% | 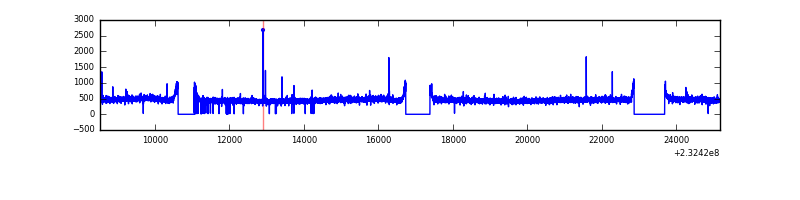 |
| D | 16642 | 14727 | 867 | 867 | 5.21% | 5.89% | 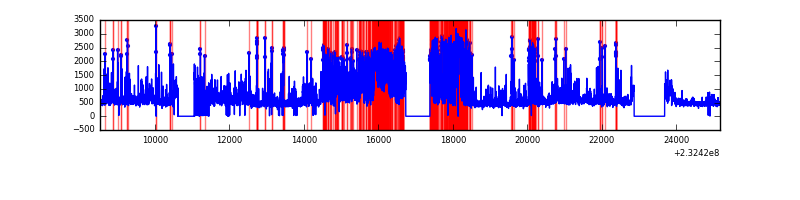 |
Top three noisy pixels from each quadrant. If the there are fewer than three noisy pixels in the level2.evt file, extra rows are filled as -1
| Pixel properties | Quadrant properties | ||||||
|---|---|---|---|---|---|---|---|
| Quadrant | DetID | PixID | Counts | Sigma | Mean | Median | Sigma |
| A | 8 | 5 | 439773 | 1241.13 | 1750 | 1709 | 353.0 |
| A | 13 | 251 | 150995 | 422.96 | 1750 | 1709 | 353.0 |
| A | 15 | 223 | 36543 | 98.69 | 1750 | 1709 | 353.0 |
| B | 4 | 173 | 123566 | 360.36 | 1753 | 1708 | 338.2 |
| B | 4 | 80 | 74972 | 216.66 | 1753 | 1708 | 338.2 |
| B | 12 | 111 | 38975 | 110.21 | 1753 | 1708 | 338.2 |
| C | 14 | 234 | 15931 | 35.8 | 1707 | 1716 | 397.1 |
| C | 9 | 54 | 14382 | 31.89 | 1707 | 1716 | 397.1 |
| C | 13 | 61 | 12838 | 28.01 | 1707 | 1716 | 397.1 |
| D | 2 | 16 | 4639604 | 11287.9 | 1646 | 1607 | 410.9 |
| D | 2 | 152 | 339280 | 821.82 | 1646 | 1607 | 410.9 |
| D | 1 | 52 | 288422 | 698.05 | 1646 | 1607 | 410.9 |
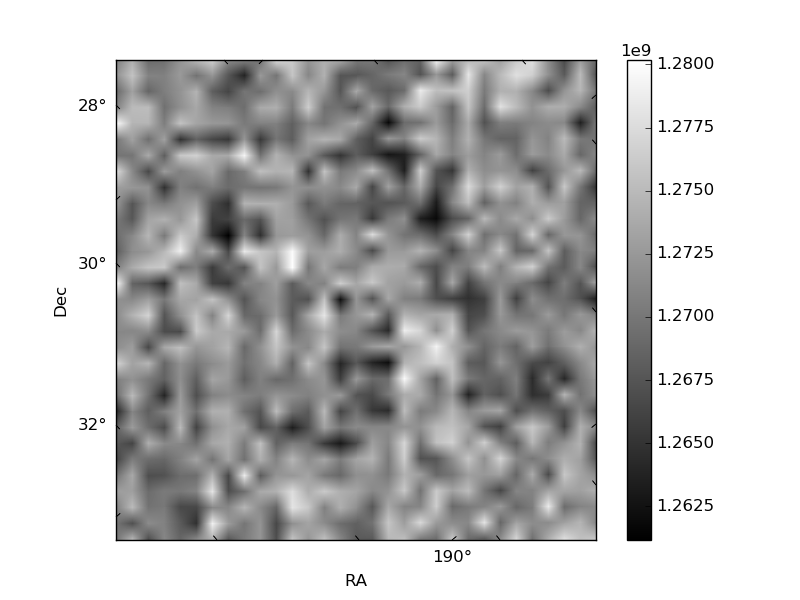
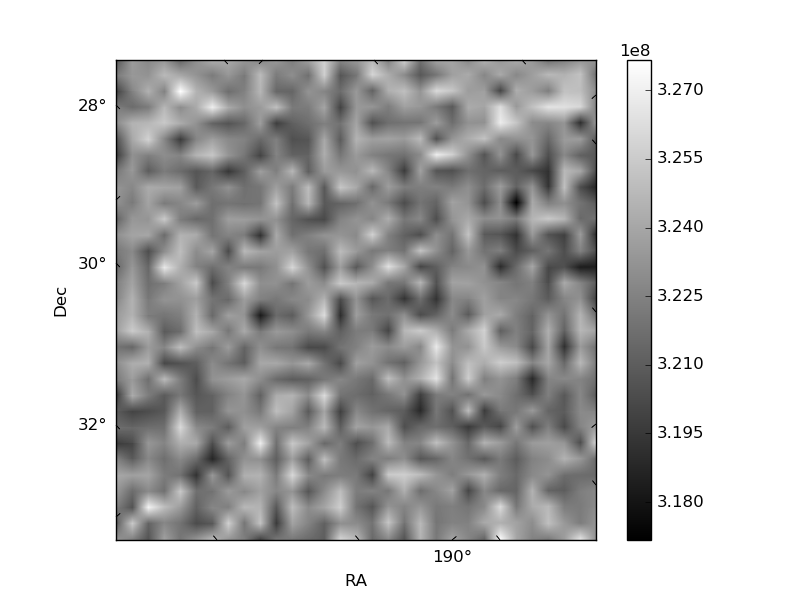
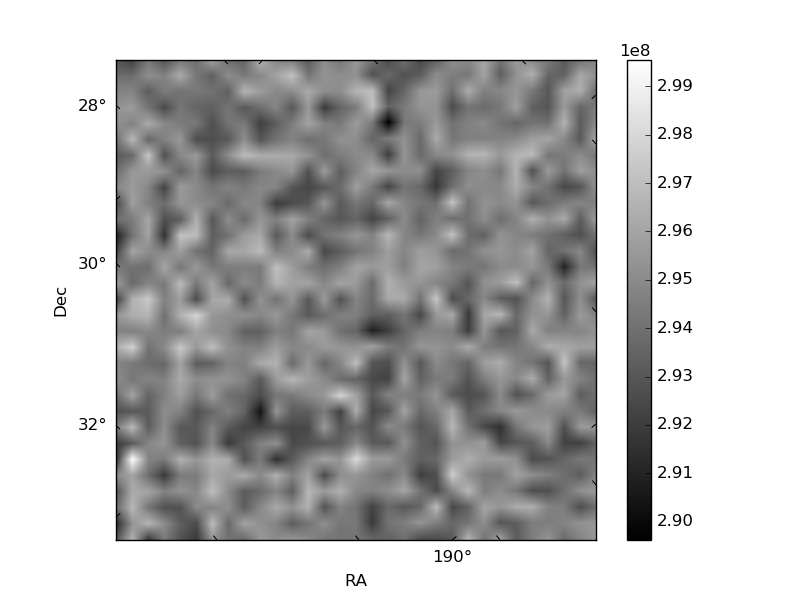
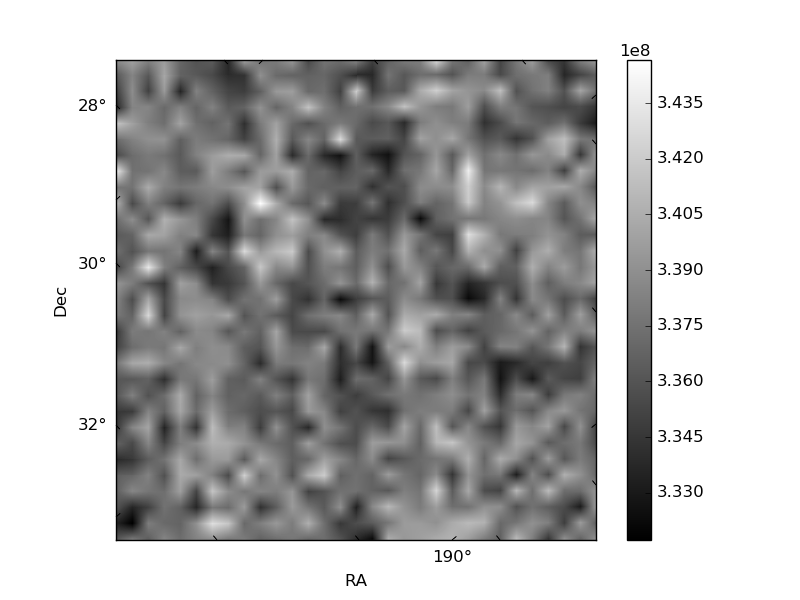
Histogram calculated using DETX and DETY for each event in the final _common_clean file
| Quadrant A | 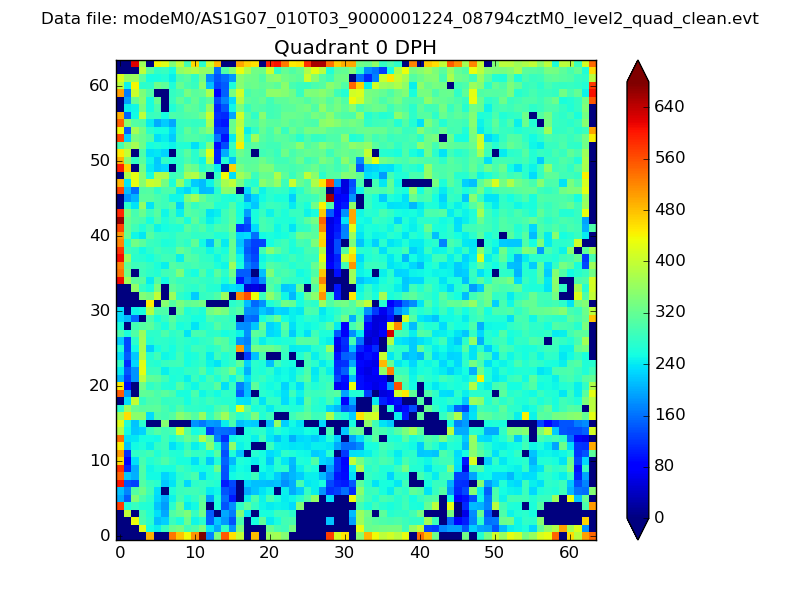 |
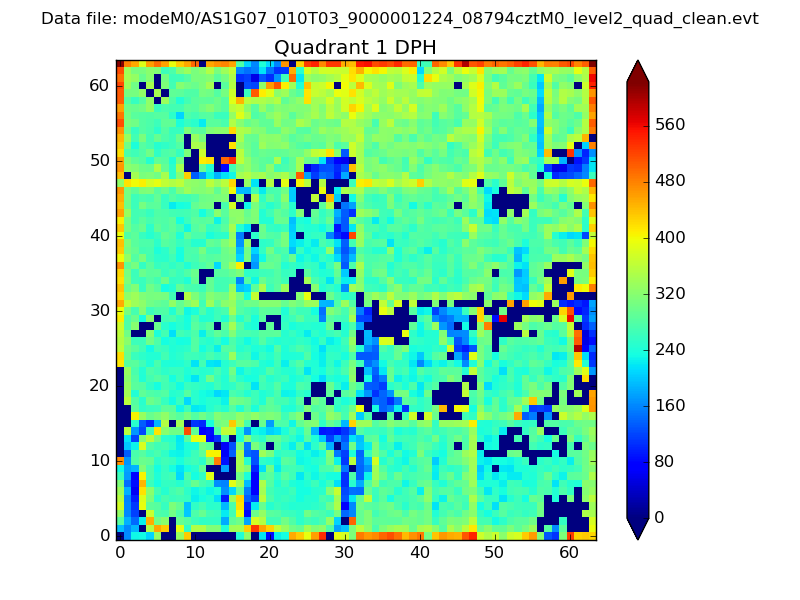 |
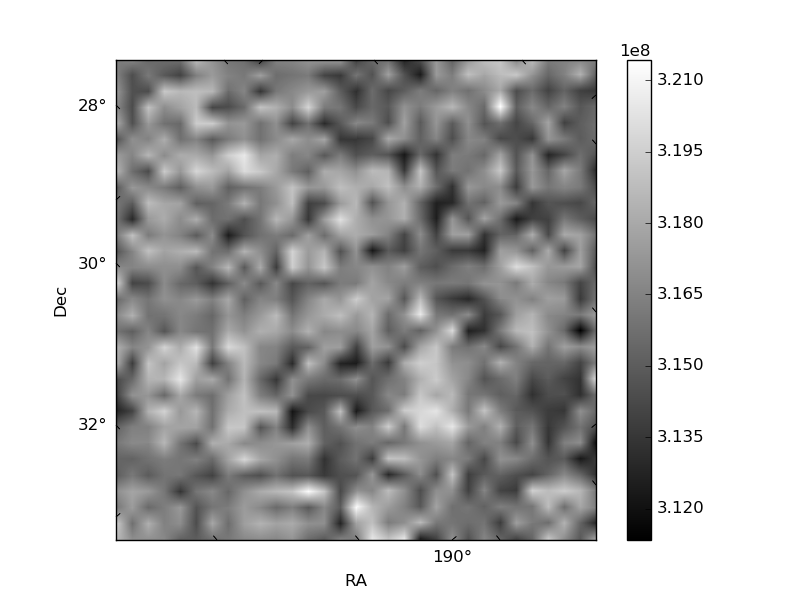
Quadrant B |
|---|---|---|---|
| Quadrant D | 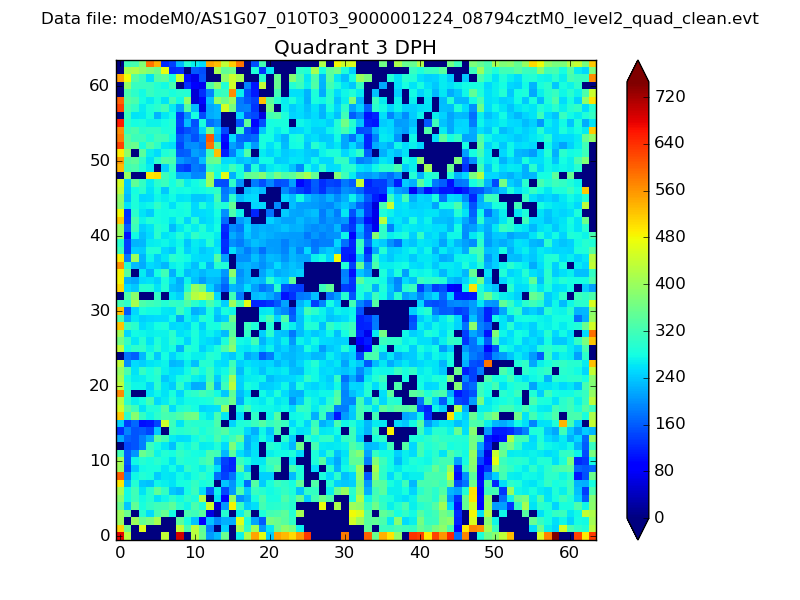 |
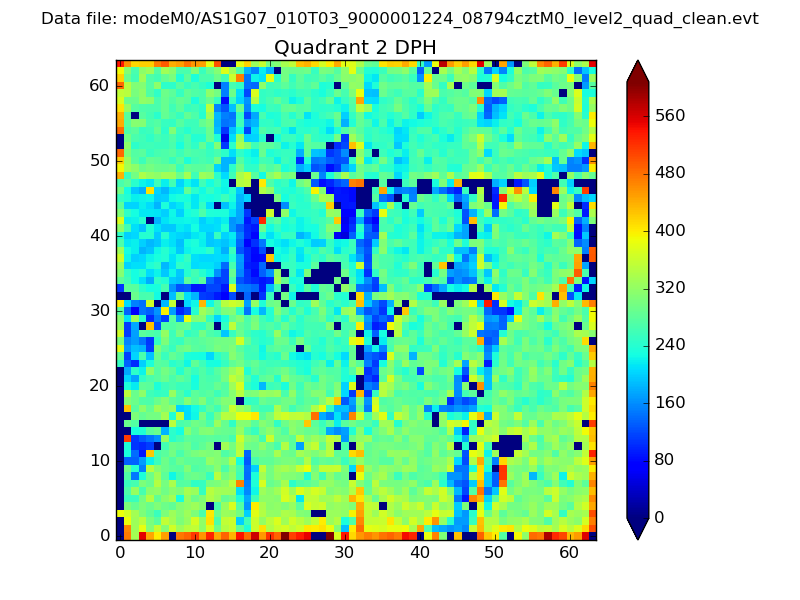 |
Quadrant C |
| Plot type | Count rate plots | Images |
|---|---|---|
| Comparison with Poisson distribution Blue bars denote a histogram of data divided into 1 sec bins. Red curve is a Poisson curve with rate = median count rate of data. |
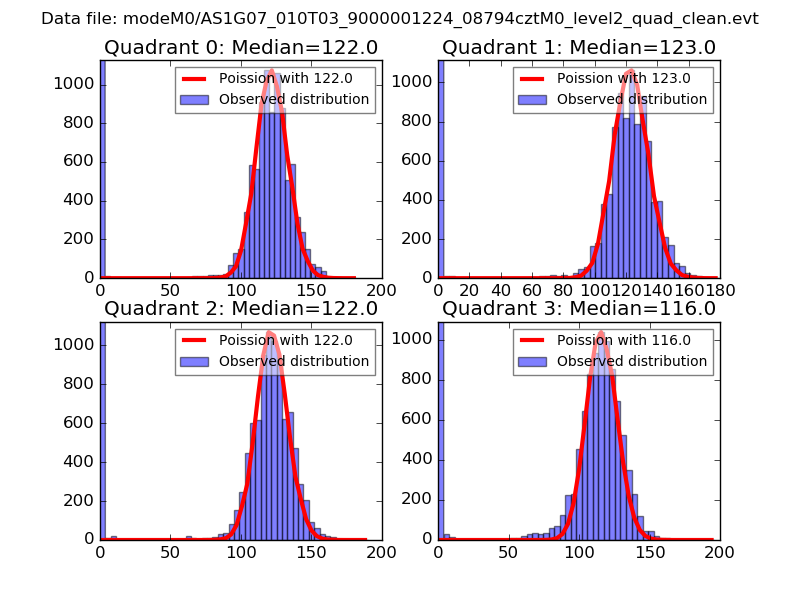 |
 |
| Quadrant-wise count rates Data is divided into 100 sec bins |
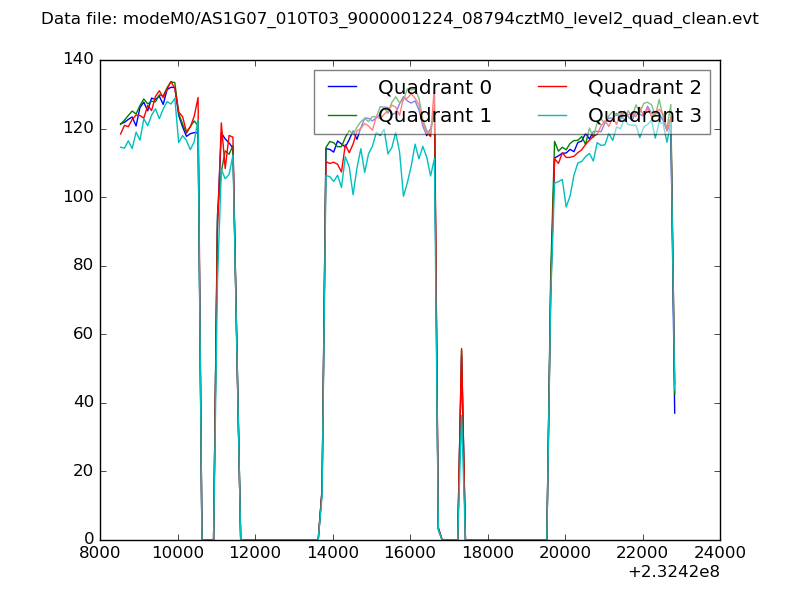 |
|
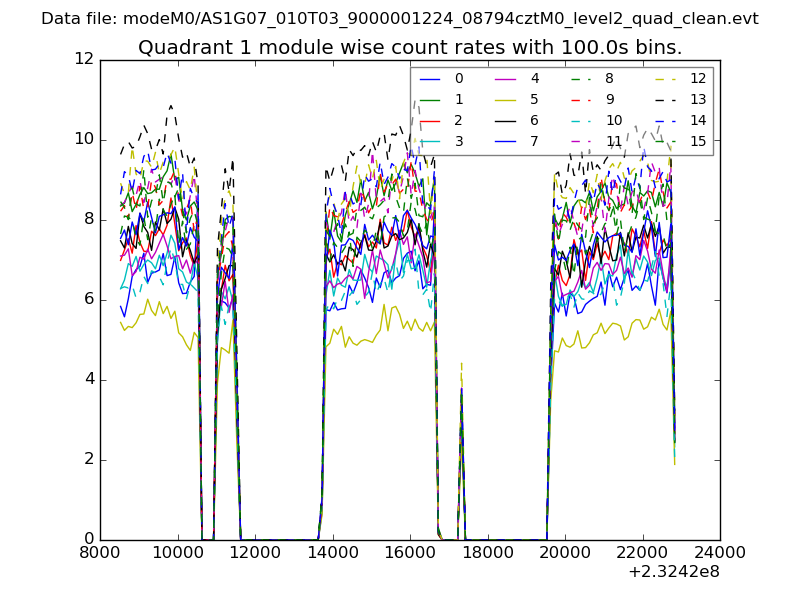
| Module-wise count rates for Quadrant A Data is divided into 100 sec bins |
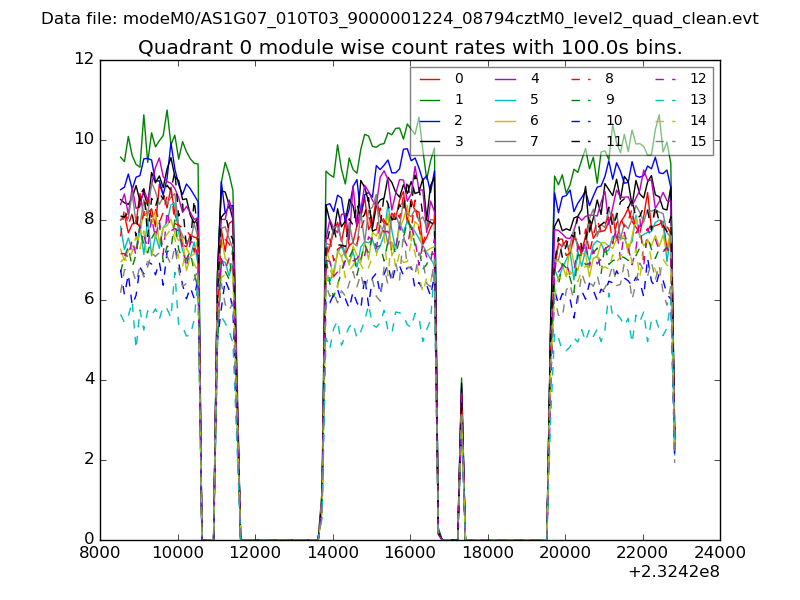 |
 |
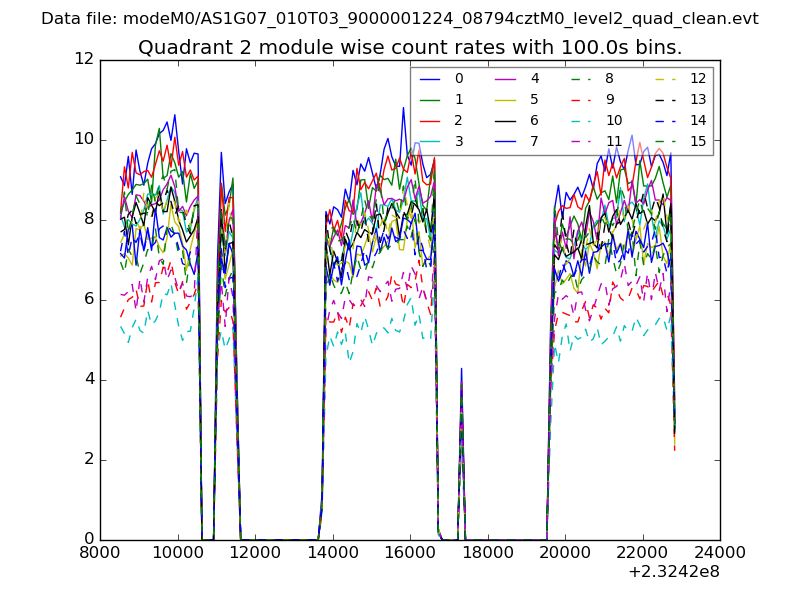
| Module-wise count rates for Quadrant B Data is divided into 100 sec bins |
 |
 |
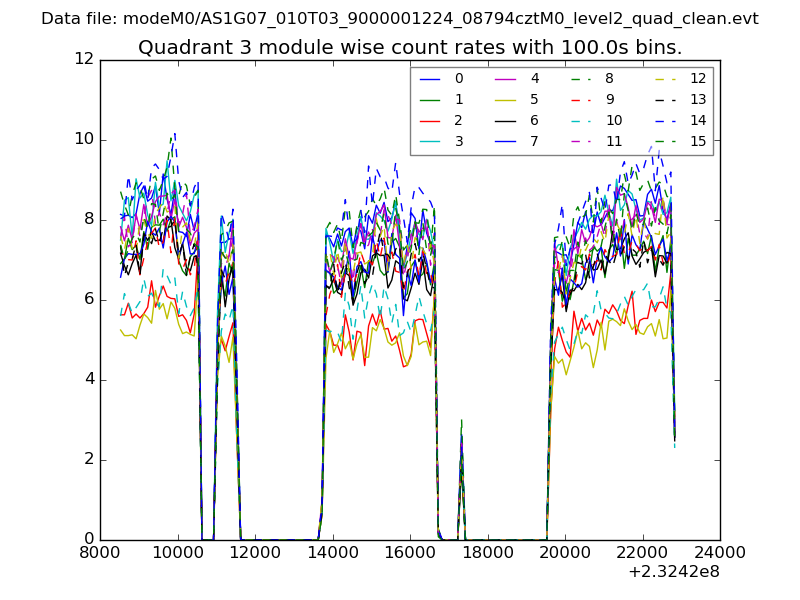
| Module-wise count rates for Quadrant C Data is divided into 100 sec bins |
 |
 |
| Module-wise count rates for Quadrant D Data is divided into 100 sec bins |
 |
 |
| Parameter | Plot |
|---|---|
| CZT HV Monitor |  |
| D_VDD | 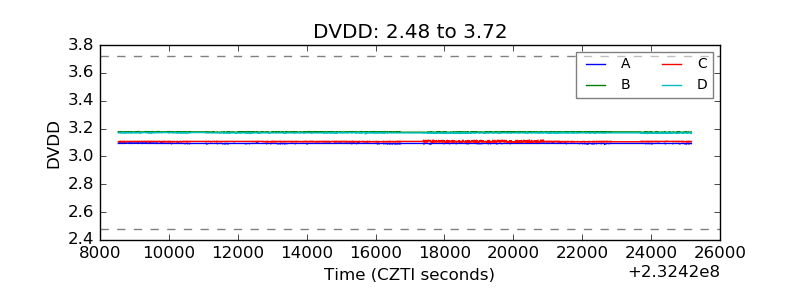 |
| Temperature 1 | 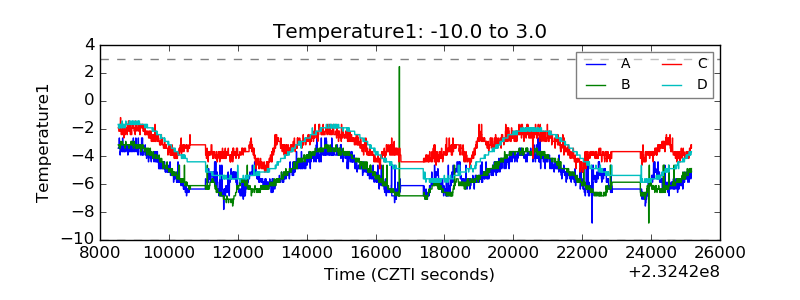 |
| Veto HV Monitor | 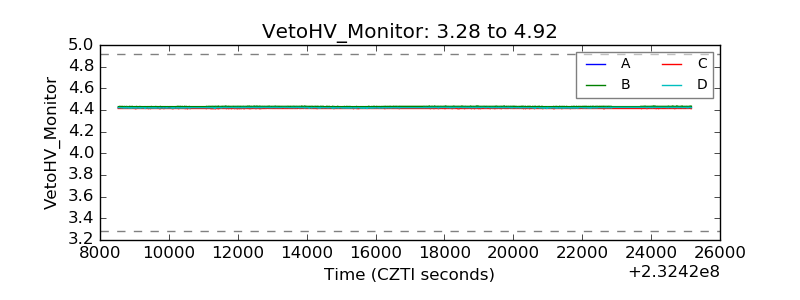 |
| Veto LLD | 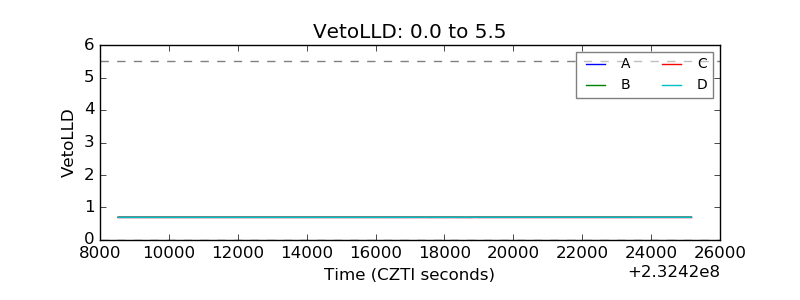 |
| Alpha Counter | 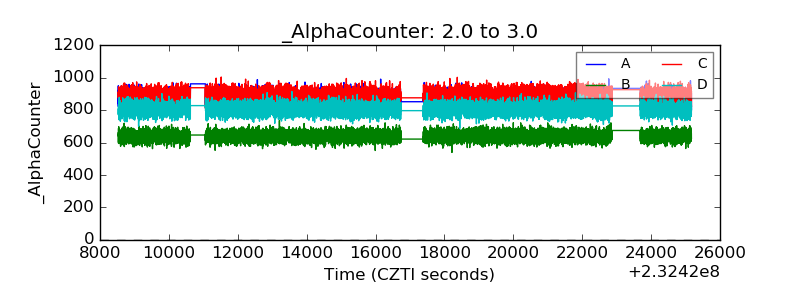 |
| _CPM_Rate | 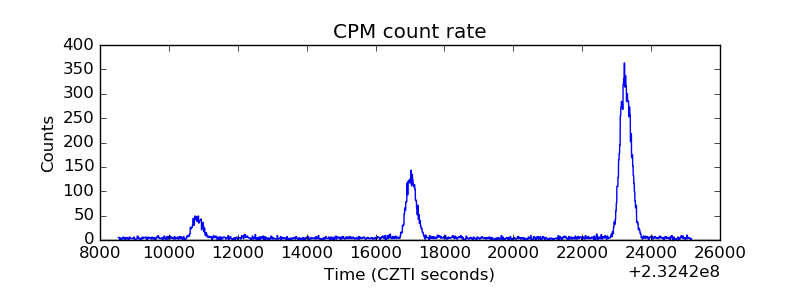 |
| CZT Counter | 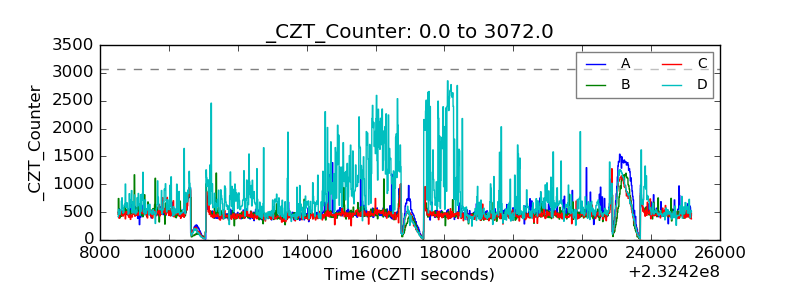 |
| +2.5 Volts monitor |  |
| +5 Volts monitor |  |
| _ROLL_ROT | 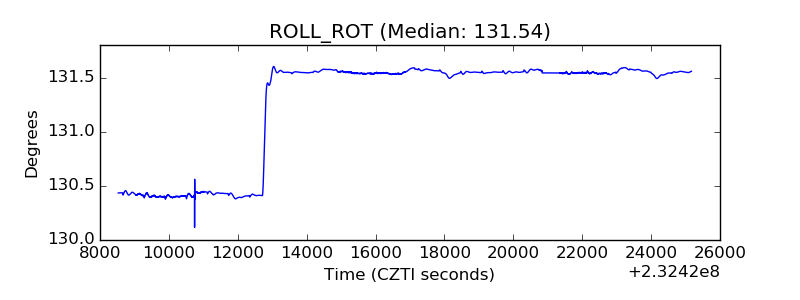 |
| _Roll_DEC | 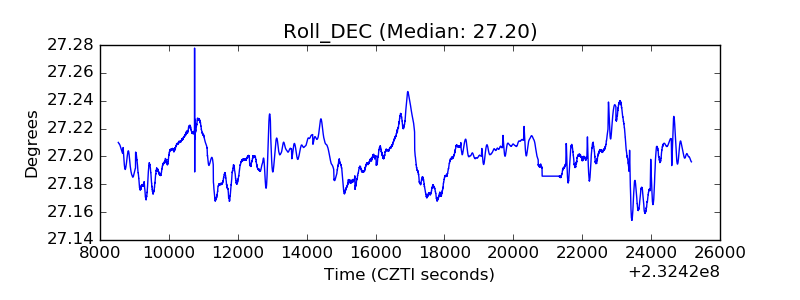 |
| _Roll_RA | 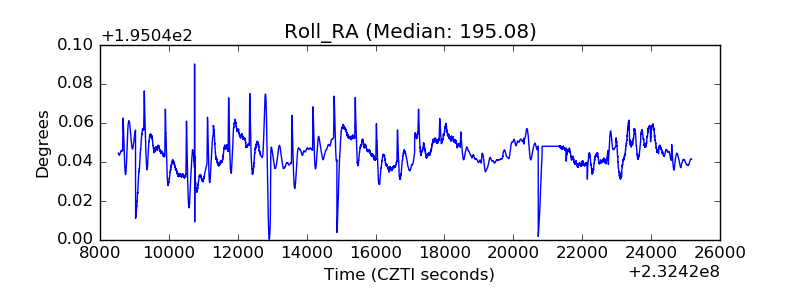 |
| Veto Counter |  |