| Param | Original file | Final file |
|---|---|---|
| Filename | modeM0/AS1G07_010T03_9000001224_08795cztM0_level2.evt | modeM0/AS1G07_010T03_9000001224_08795cztM0_level2_quad_clean.evt |
| Size (bytes) | 636,096,960 | 84,882,240 |
| Size | 606.6 MB | 81.0 MB |
| Events in quadrant A | 4,020,167 | 528,466 |
| Events in quadrant B | 3,624,855 | 537,905 |
| Events in quadrant C | 3,499,021 | 528,383 |
| Events in quadrant D | 7,607,124 | 448,313 |
| Mode SS | |||
|---|---|---|---|
| Quadrant | BADHDUFLAG | Total packets | Discarded packets |
| A | 0 | 156 | 0 |
| B | 0 | 156 | 0 |
| C | 0 | 156 | 0 |
| D | 0 | 156 | 0 |
| Mode M0 | |||
|---|---|---|---|
| Quadrant | BADHDUFLAG | Total packets | Discarded packets |
| A | 0 | 16671 | 9 |
| B | 0 | 15567 | 9 |
| C | 0 | 15441 | 6 |
| D | 0 | 27671 | 16 |
| Mode M9 | |||
|---|---|---|---|
| Quadrant | BADHDUFLAG | Total packets | Discarded packets |
| A | 0 | 17 | 0 |
| B | 0 | 17 | 0 |
| C | 0 | 17 | 0 |
| D | 0 | 17 | 0 |
| Quadrant | Total seconds | Saturated seconds | Saturation percentage |
|---|---|---|---|
| A | 7561 | 107 | 1.415157% |
| B | 7559 | 93 | 1.230321% |
| C | 7561 | 49 | 0.648062% |
| D | 7561 | 1505 | 19.904775% |
Noise dominated data is calculated using 1-second bins in cleaned event files. If a bin has >2000 counts, and if more than 50% of those come from <1% of pixels, then it is considered to be noise-dominated and hence unusable.
| Quadrant | # 1 sec bins | Bins with >0 counts | Bins with >2000 counts | High rate bins dominated by noise | Noise dominated (total time) | Noise dominated (detector-on time) | Marked lightcurve |
|---|---|---|---|---|---|---|---|
| A | 9378 | 7563 | 3 | 3 | 0.03% | 0.04% |  |
| B | 9378 | 7563 | 0 | 0 | 0.00% | 0.00% | 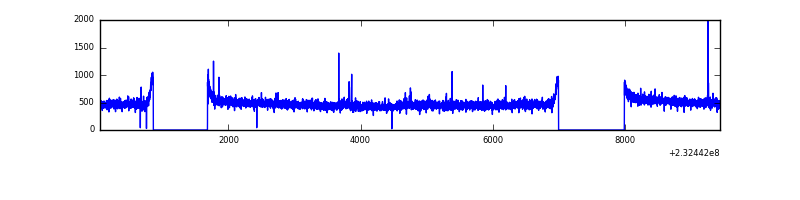 |
| C | 9378 | 7563 | 0 | 0 | 0.00% | 0.00% | 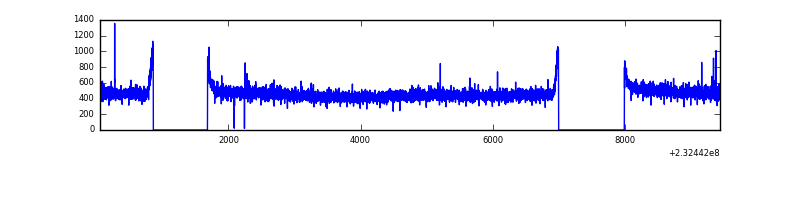 |
| D | 9378 | 7563 | 1241 | 1241 | 13.23% | 16.41% |  |
Top three noisy pixels from each quadrant. If the there are fewer than three noisy pixels in the level2.evt file, extra rows are filled as -1
| Pixel properties | Quadrant properties | ||||||
|---|---|---|---|---|---|---|---|
| Quadrant | DetID | PixID | Counts | Sigma | Mean | Median | Sigma |
| A | 8 | 5 | 385647 | 2058.01 | 921 | 901 | 187.0 |
| A | 13 | 248 | 47590 | 249.74 | 921 | 901 | 187.0 |
| A | 15 | 223 | 21761 | 111.58 | 921 | 901 | 187.0 |
| B | 4 | 173 | 22750 | 123.28 | 923 | 900 | 177.2 |
| B | 12 | 111 | 20919 | 112.95 | 923 | 900 | 177.2 |
| B | 11 | 111 | 17034 | 91.03 | 923 | 900 | 177.2 |
| C | 13 | 61 | 6766 | 28.09 | 894 | 900 | 208.8 |
| C | 12 | 4 | 6402 | 26.35 | 894 | 900 | 208.8 |
| C | 8 | 222 | 5024 | 19.75 | 894 | 900 | 208.8 |
| D | 2 | 16 | 4057785 | 18758.25 | 839 | 819 | 216.3 |
| D | 2 | 152 | 187254 | 862.02 | 839 | 819 | 216.3 |
| D | 1 | 52 | 60985 | 278.19 | 839 | 819 | 216.3 |
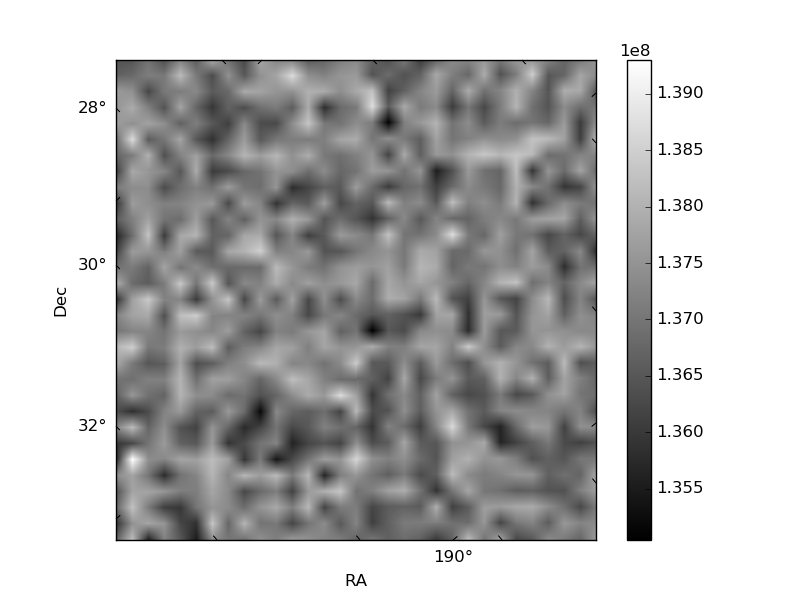
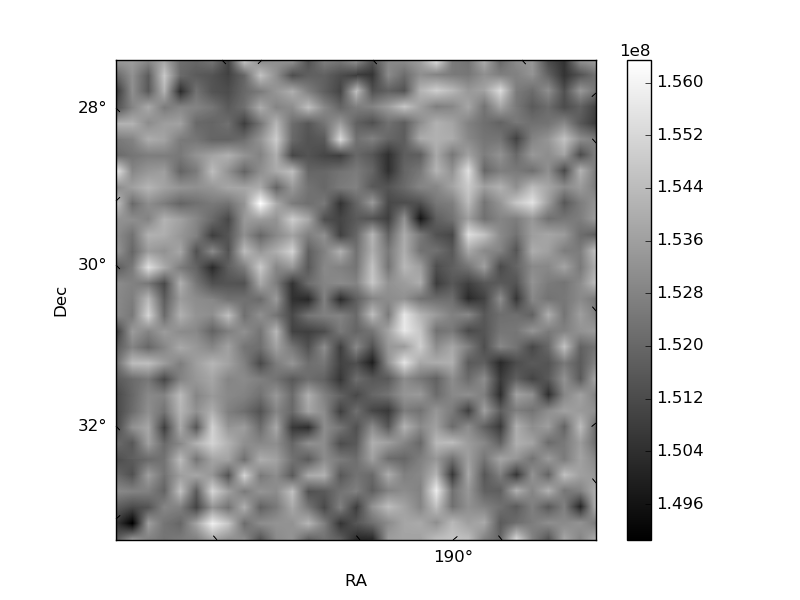
Histogram calculated using DETX and DETY for each event in the final _common_clean file
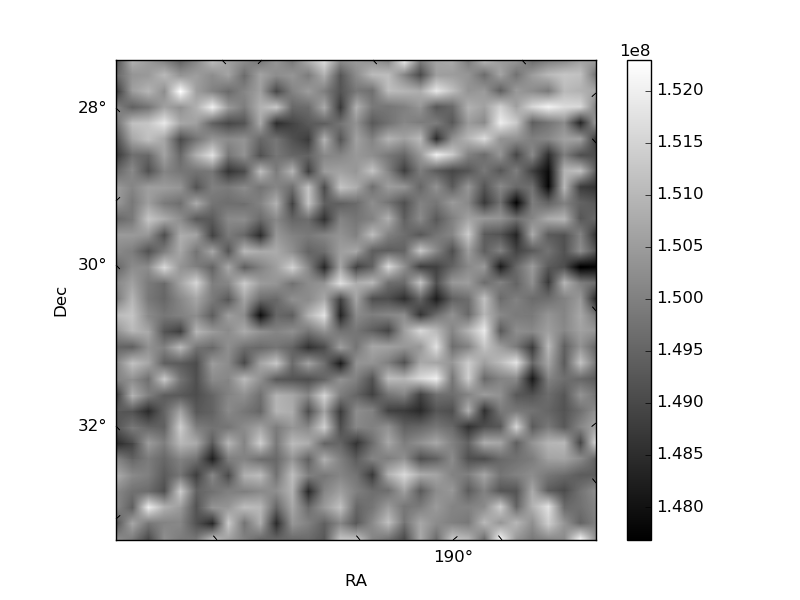
| Quadrant A | 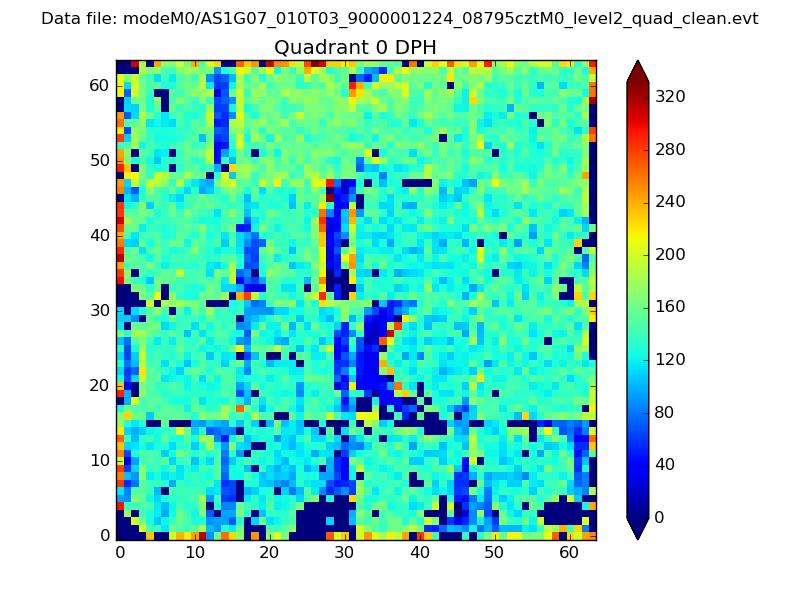 |
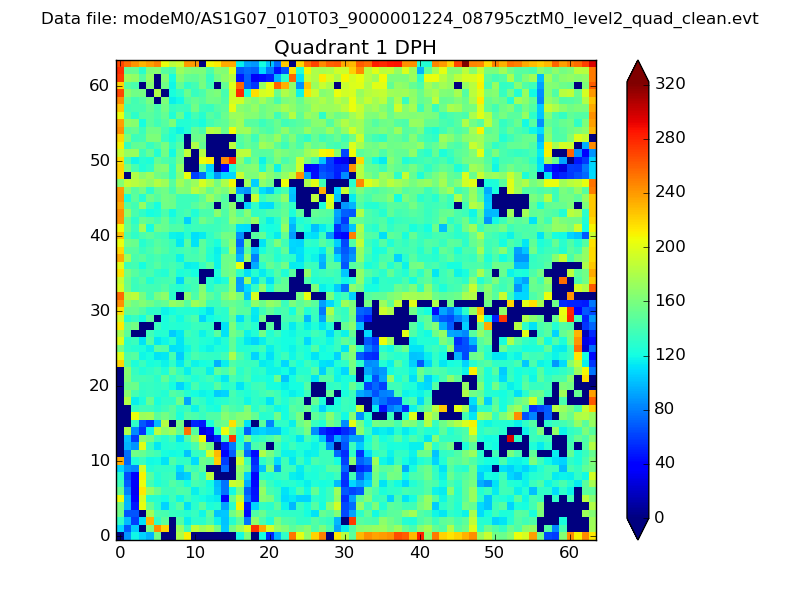 |
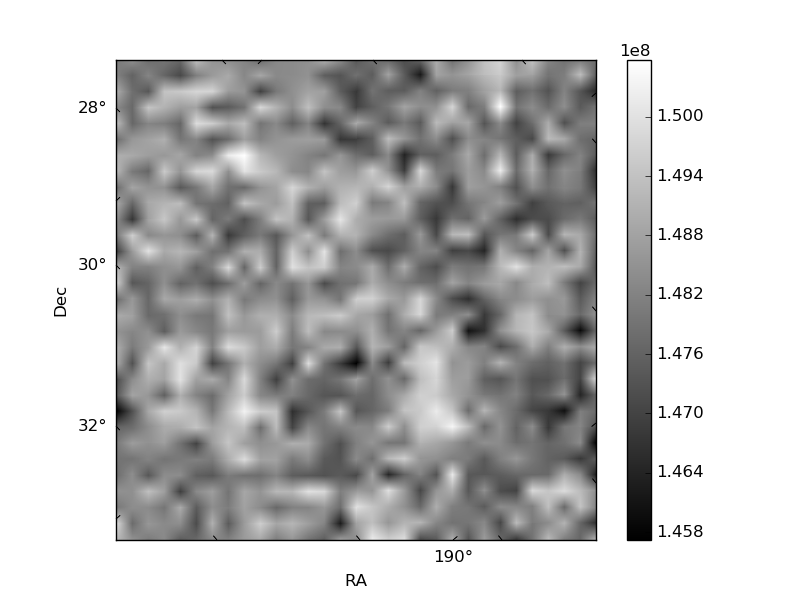
Quadrant B |
|---|---|---|---|
| Quadrant D | 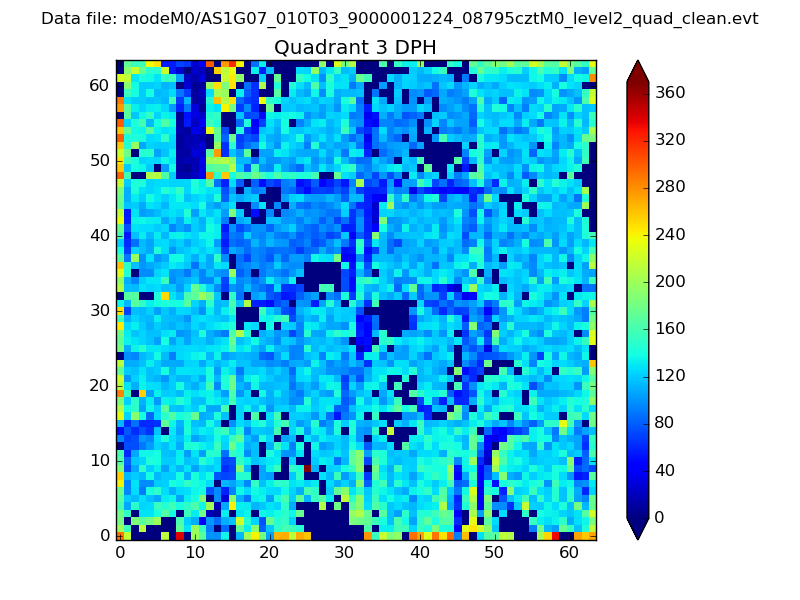 |
 |
Quadrant C |
| Plot type | Count rate plots | Images |
|---|---|---|
| Comparison with Poisson distribution Blue bars denote a histogram of data divided into 1 sec bins. Red curve is a Poisson curve with rate = median count rate of data. |
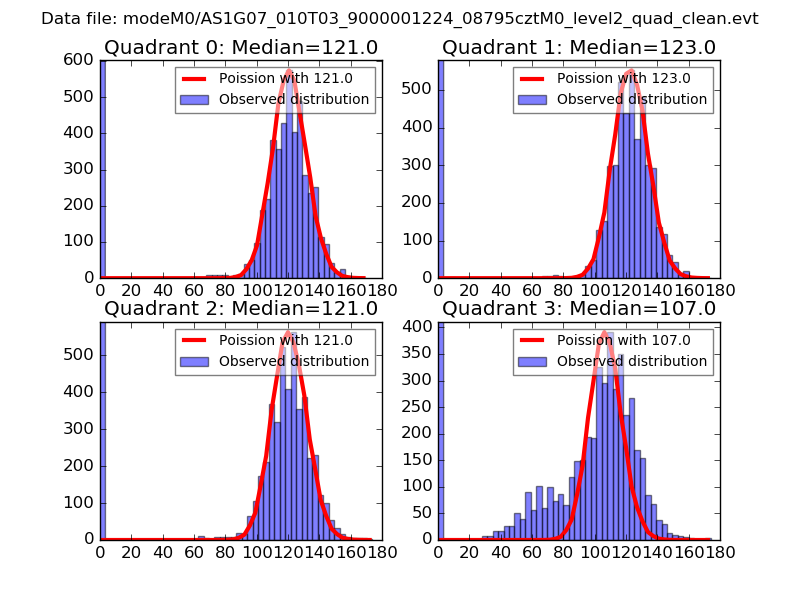 |
 |
| Quadrant-wise count rates Data is divided into 100 sec bins |
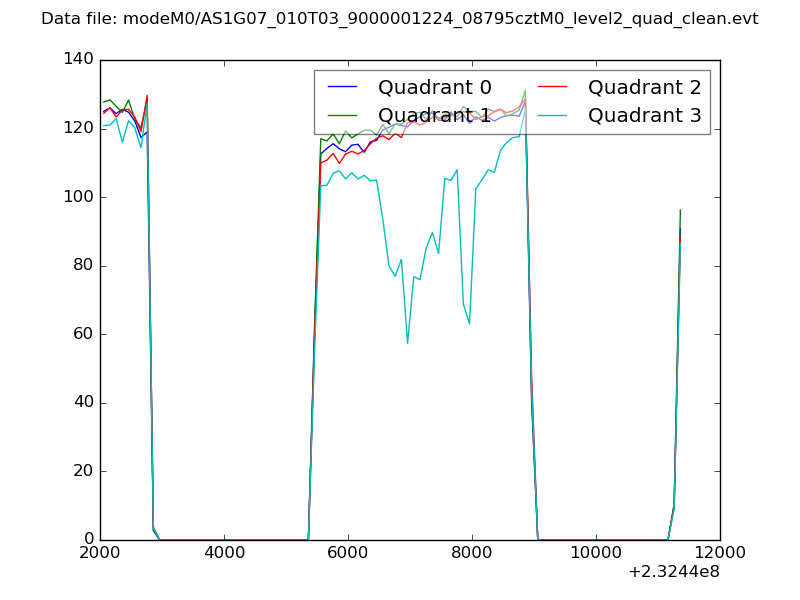 |
|
| Module-wise count rates for Quadrant A Data is divided into 100 sec bins |
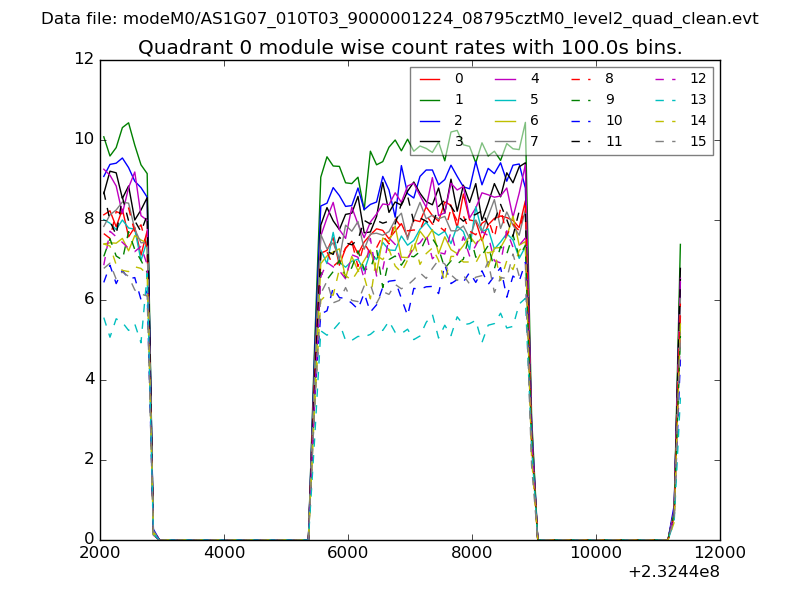 |
 |
| Module-wise count rates for Quadrant B Data is divided into 100 sec bins |
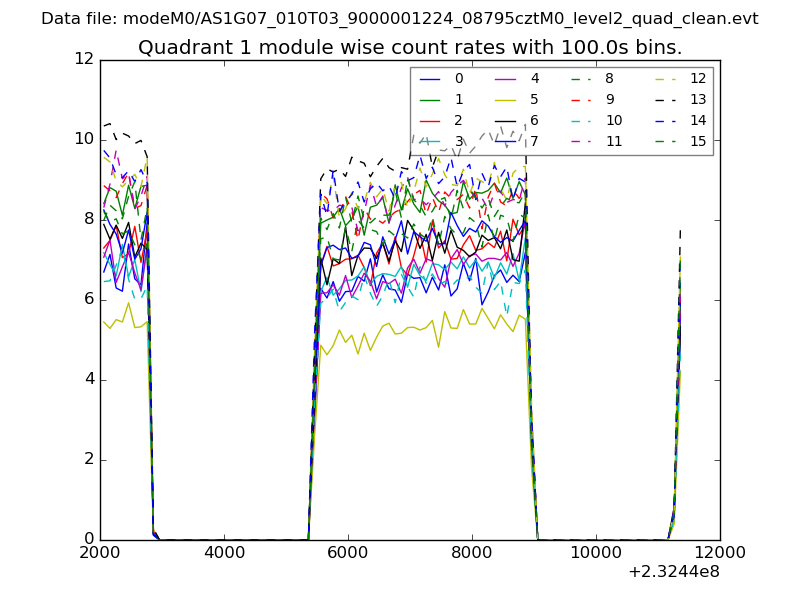 |
 |
| Module-wise count rates for Quadrant C Data is divided into 100 sec bins |
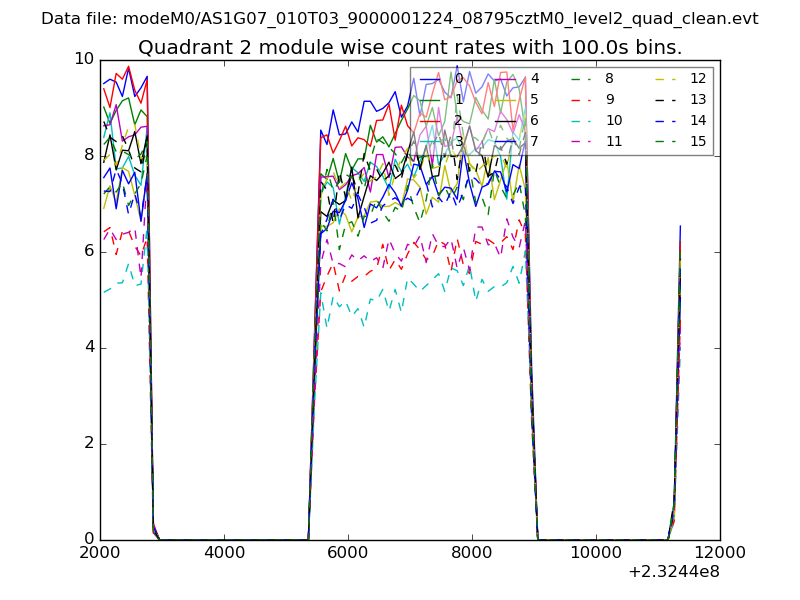 |
 |
| Module-wise count rates for Quadrant D Data is divided into 100 sec bins |
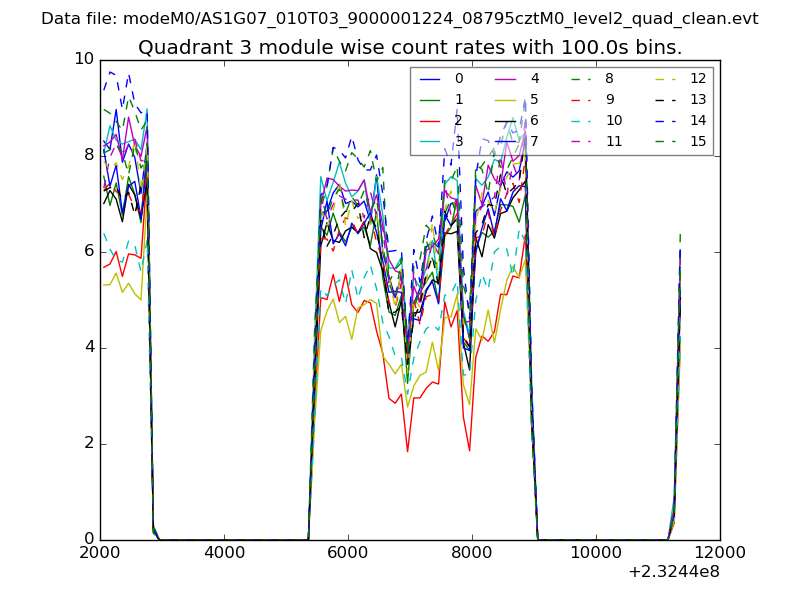 |
 |
| Parameter | Plot |
|---|---|
| CZT HV Monitor | 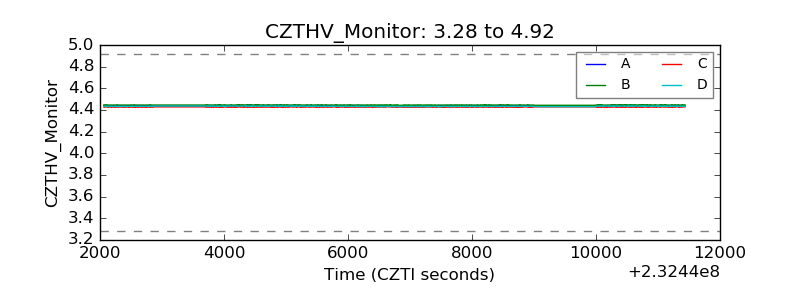 |
| D_VDD | 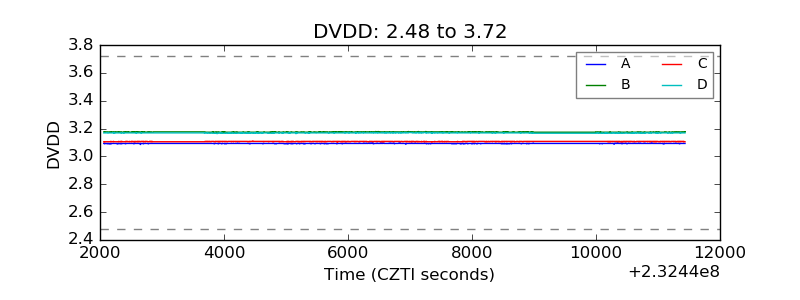 |
| Temperature 1 | 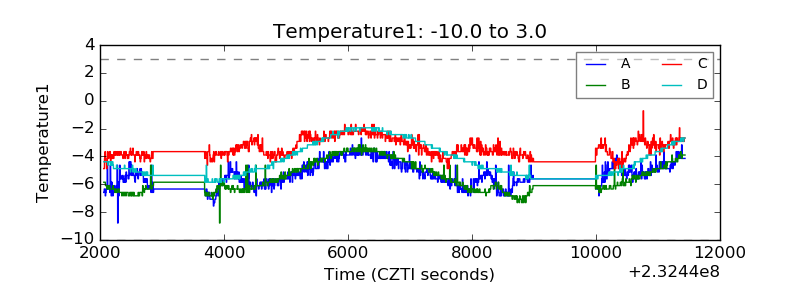 |
| Veto HV Monitor | 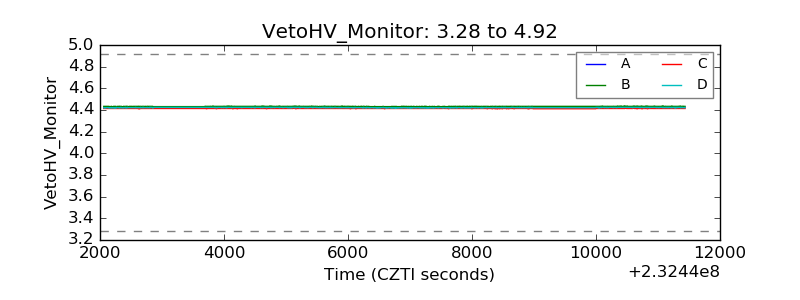 |
| Veto LLD | 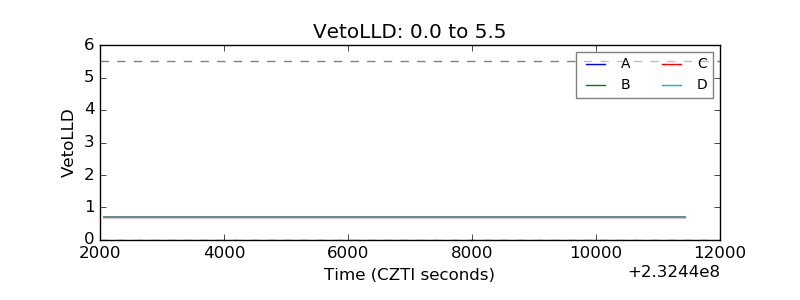 |
| Alpha Counter | 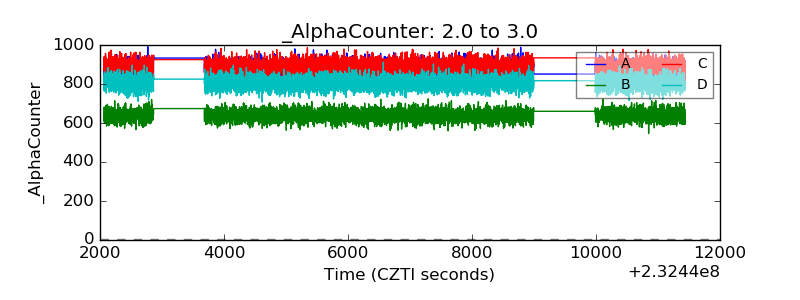 |
| _CPM_Rate | 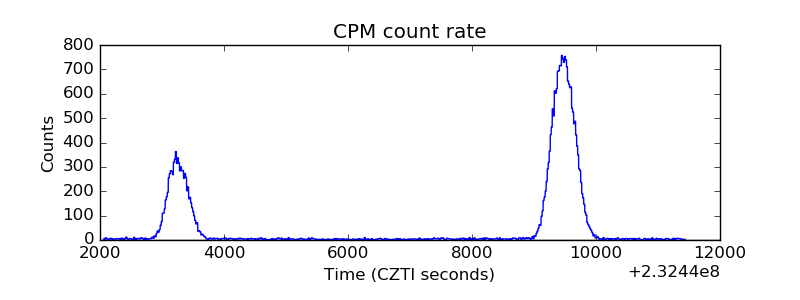 |
| CZT Counter |  |
| +2.5 Volts monitor |  |
| +5 Volts monitor |  |
| _ROLL_ROT | 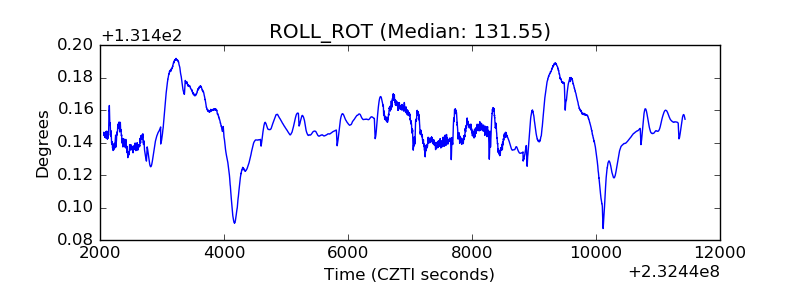 |
| _Roll_DEC | 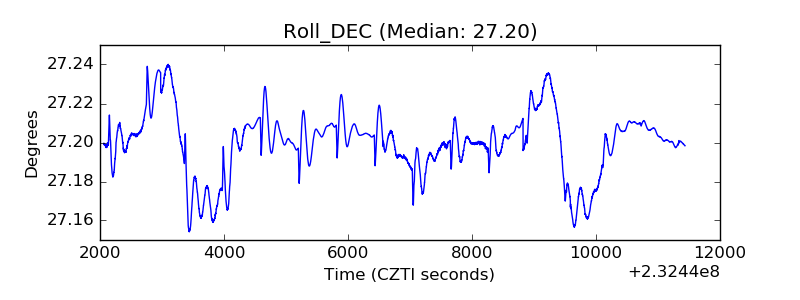 |
| _Roll_RA | 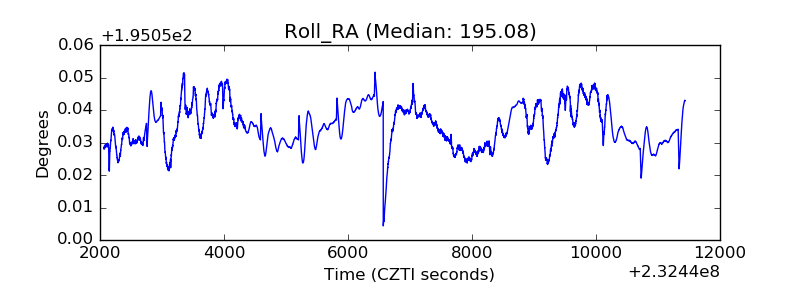 |
| Veto Counter | 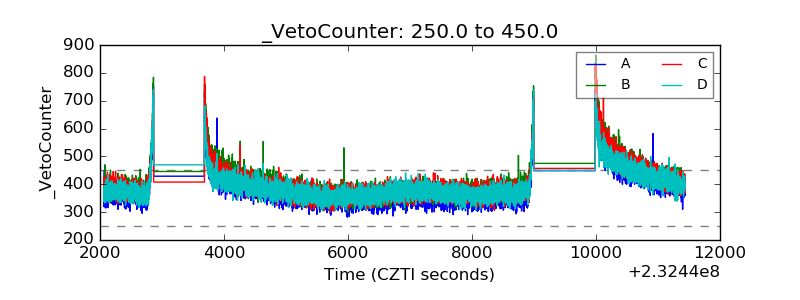 |