| Param | Original file | Final file |
|---|---|---|
| Filename | modeM0/AS1G07_010T03_9000001224_08797cztM0_level2.evt | modeM0/AS1G07_010T03_9000001224_08797cztM0_level2_quad_clean.evt |
| Size (bytes) | 571,518,720 | 82,002,240 |
| Size | 545.0 MB | 78.2 MB |
| Events in quadrant A | 3,815,202 | 520,016 |
| Events in quadrant B | 3,280,587 | 530,326 |
| Events in quadrant C | 3,221,529 | 515,301 |
| Events in quadrant D | 6,541,120 | 454,619 |
| Mode SS | |||
|---|---|---|---|
| Quadrant | BADHDUFLAG | Total packets | Discarded packets |
| A | 0 | 138 | 4 |
| B | 0 | 138 | 0 |
| C | 0 | 138 | 2 |
| D | 0 | 138 | 4 |
| Mode M0 | |||
|---|---|---|---|
| Quadrant | BADHDUFLAG | Total packets | Discarded packets |
| A | 0 | 15847 | 235 |
| B | 0 | 14168 | 244 |
| C | 0 | 14079 | 192 |
| D | 0 | 24443 | 513 |
| Mode M9 | |||
|---|---|---|---|
| Quadrant | BADHDUFLAG | Total packets | Discarded packets |
| A | 0 | 20 | 0 |
| B | 0 | 20 | 0 |
| C | 0 | 20 | 0 |
| D | 0 | 20 | 0 |
| Quadrant | Total seconds | Saturated seconds | Saturation percentage |
|---|---|---|---|
| A | 6642 | 157 | 2.363746% |
| B | 6631 | 112 | 1.689036% |
| C | 6652 | 93 | 1.398076% |
| D | 6602 | 1079 | 16.343532% |
Noise dominated data is calculated using 1-second bins in cleaned event files. If a bin has >2000 counts, and if more than 50% of those come from <1% of pixels, then it is considered to be noise-dominated and hence unusable.
| Quadrant | # 1 sec bins | Bins with >0 counts | Bins with >2000 counts | High rate bins dominated by noise | Noise dominated (total time) | Noise dominated (detector-on time) | Marked lightcurve |
|---|---|---|---|---|---|---|---|
| A | 8849 | 6731 | 27 | 27 | 0.31% | 0.40% | 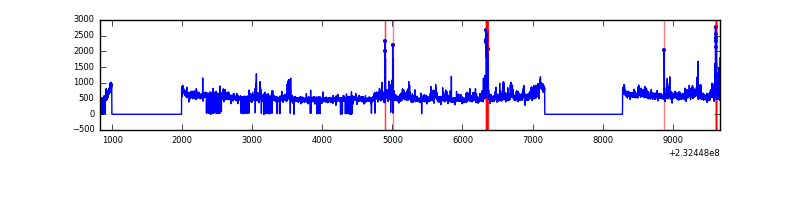 |
| B | 8851 | 6729 | 1 | 1 | 0.01% | 0.01% | 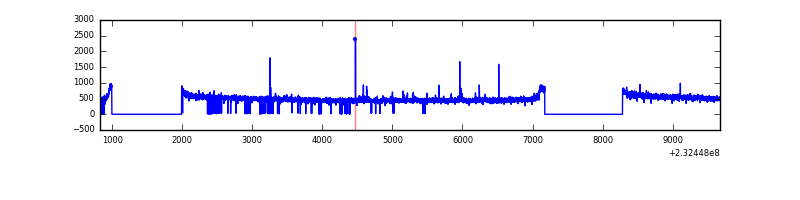 |
| C | 8851 | 6735 | 10 | 10 | 0.11% | 0.15% |  |
| D | 8850 | 6711 | 897 | 897 | 10.14% | 13.37% |  |
Top three noisy pixels from each quadrant. If the there are fewer than three noisy pixels in the level2.evt file, extra rows are filled as -1
| Pixel properties | Quadrant properties | ||||||
|---|---|---|---|---|---|---|---|
| Quadrant | DetID | PixID | Counts | Sigma | Mean | Median | Sigma |
| A | 8 | 5 | 429933 | 2499.57 | 841 | 824 | 171.7 |
| A | 15 | 223 | 62568 | 359.66 | 841 | 824 | 171.7 |
| A | 13 | 248 | 58715 | 337.22 | 841 | 824 | 171.7 |
| B | 4 | 173 | 19817 | 119.02 | 835 | 815 | 159.7 |
| B | 12 | 111 | 18239 | 109.14 | 835 | 815 | 159.7 |
| B | 11 | 111 | 14817 | 87.7 | 835 | 815 | 159.7 |
| C | 14 | 234 | 44930 | 232.55 | 812 | 816 | 189.7 |
| C | 13 | 61 | 6273 | 28.77 | 812 | 816 | 189.7 |
| C | 12 | 4 | 5689 | 25.69 | 812 | 816 | 189.7 |
| D | 2 | 16 | 3212022 | 16804.58 | 758 | 739 | 191.1 |
| D | 2 | 152 | 249017 | 1299.23 | 758 | 739 | 191.1 |
| D | 1 | 52 | 100080 | 519.85 | 758 | 739 | 191.1 |
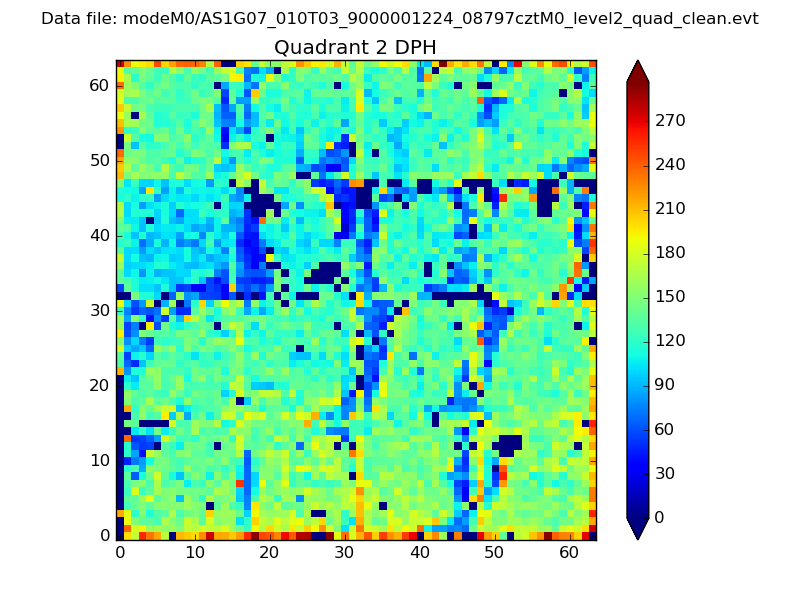
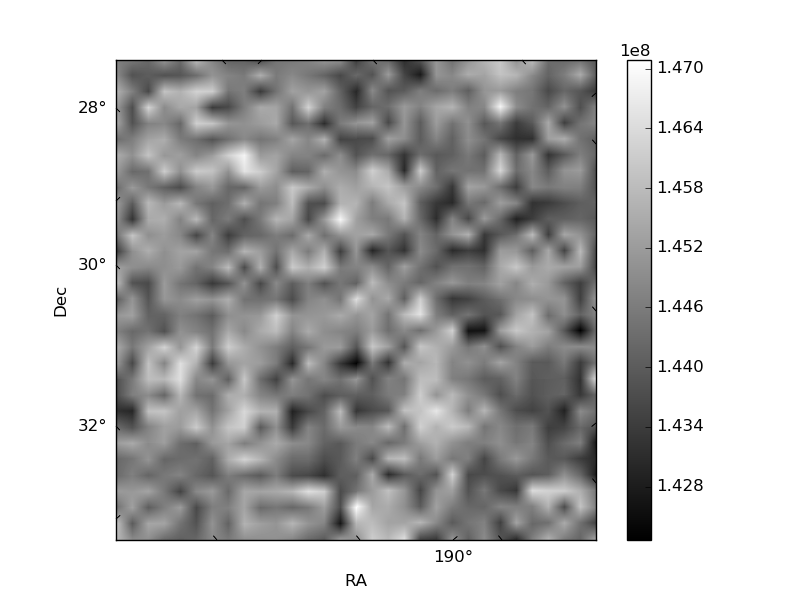
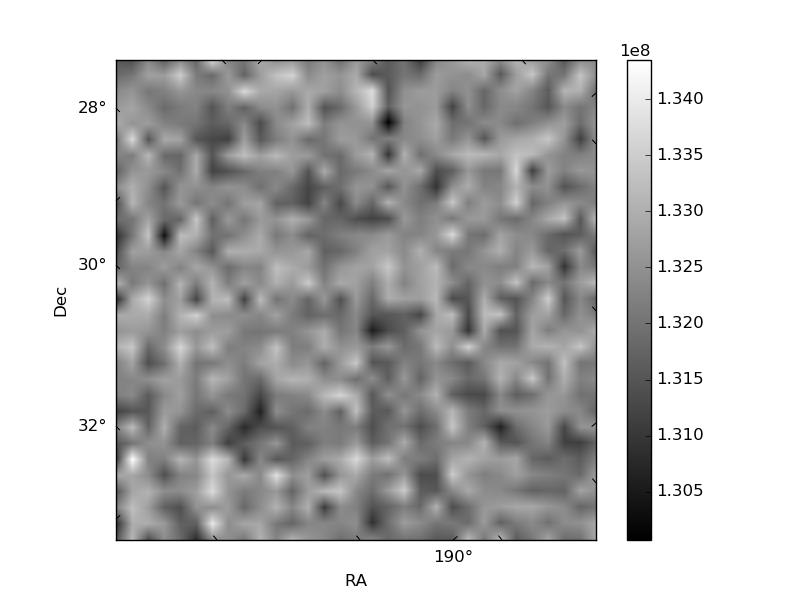
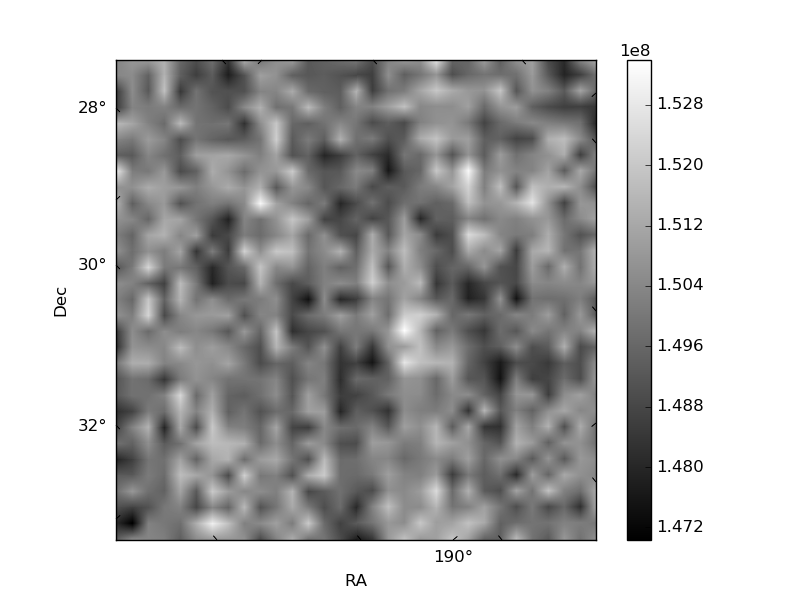
Histogram calculated using DETX and DETY for each event in the final _common_clean file
| Quadrant A | 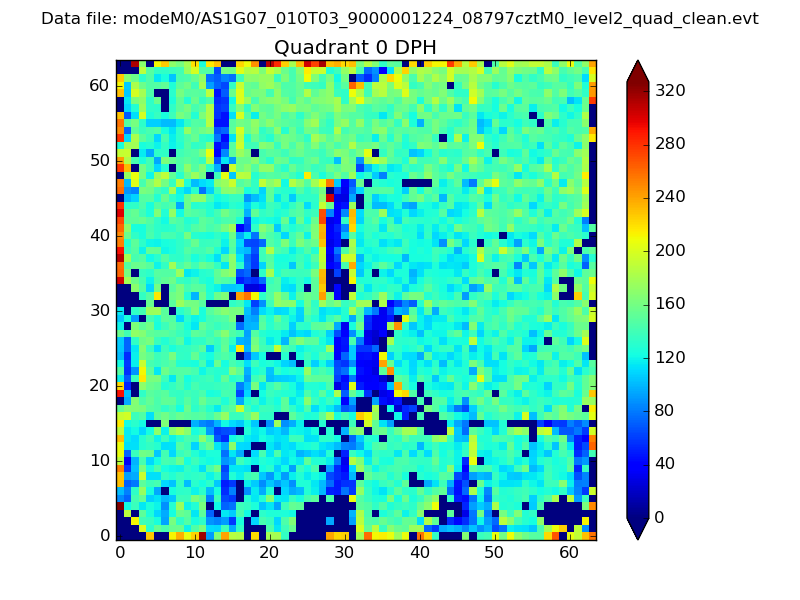 |
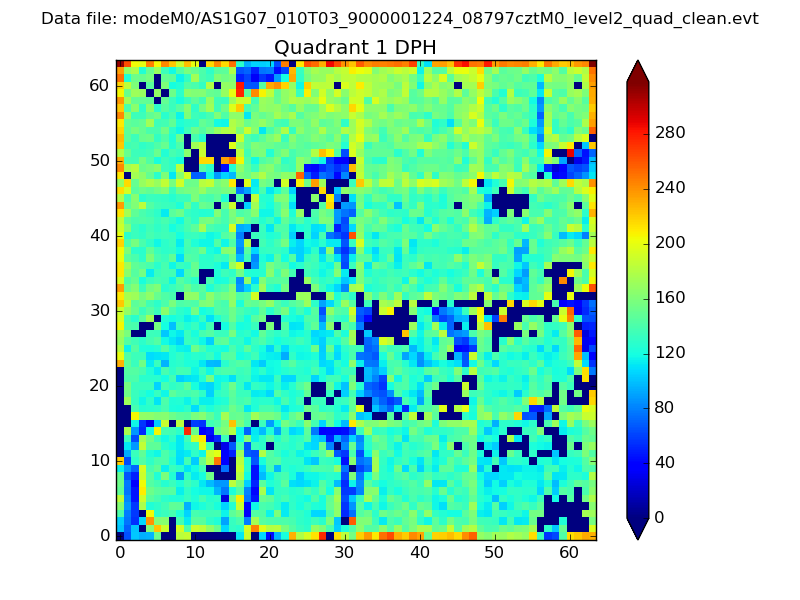 |
Quadrant B |
|---|---|---|---|
| Quadrant D | 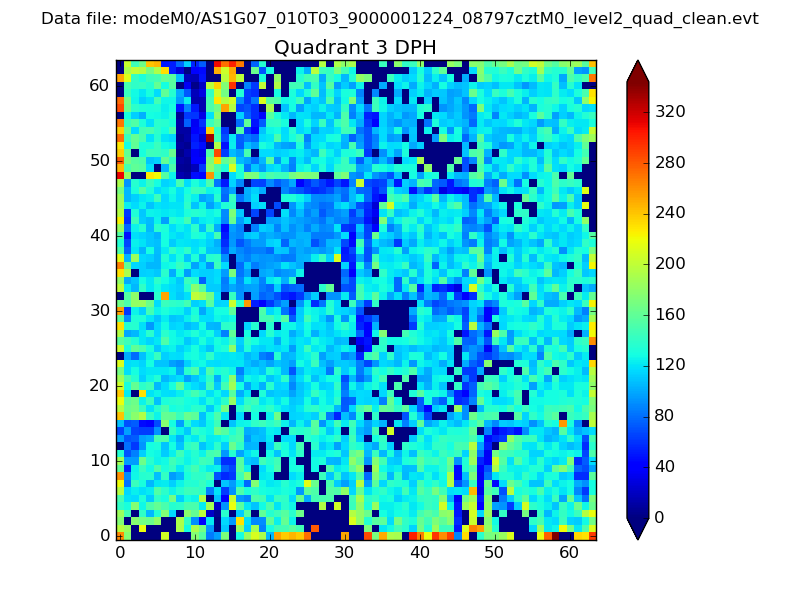 |
 |
Quadrant C |
| Plot type | Count rate plots | Images |
|---|---|---|
| Comparison with Poisson distribution Blue bars denote a histogram of data divided into 1 sec bins. Red curve is a Poisson curve with rate = median count rate of data. |
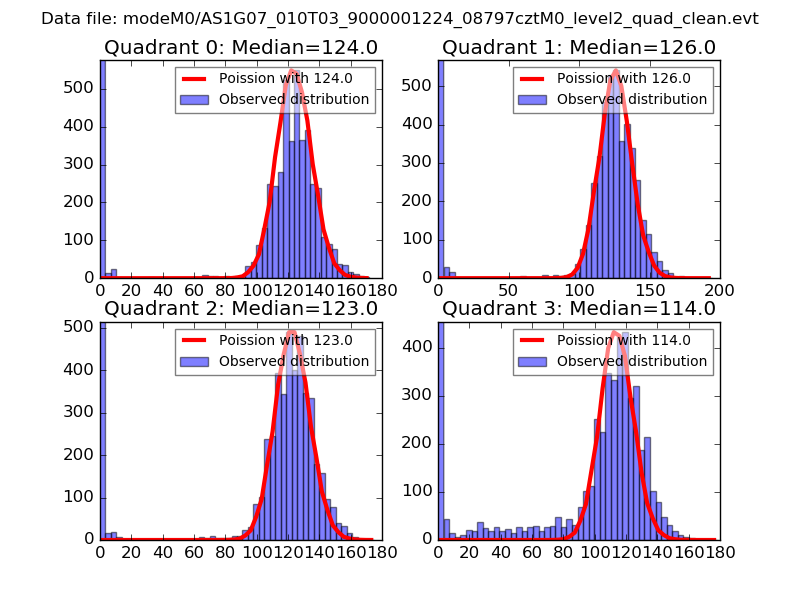 |
 |
| Quadrant-wise count rates Data is divided into 100 sec bins |
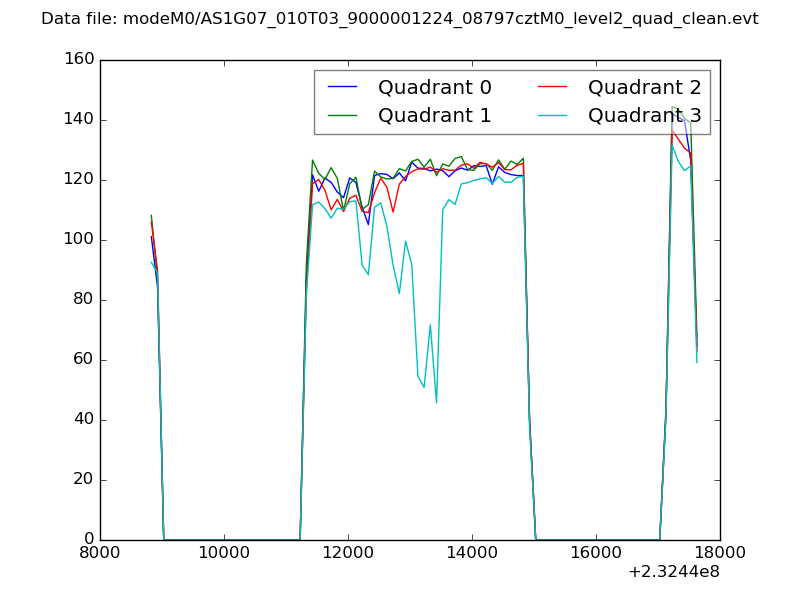 |
|
| Module-wise count rates for Quadrant A Data is divided into 100 sec bins |
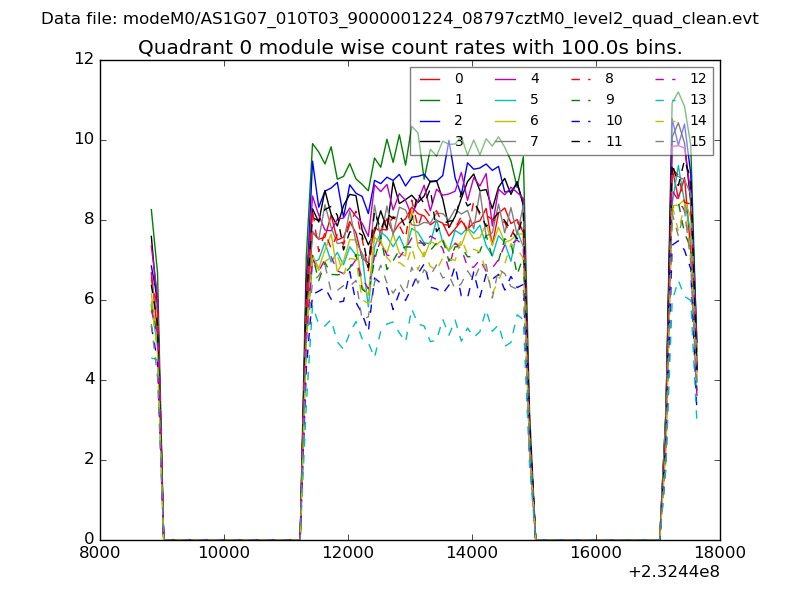 |
 |
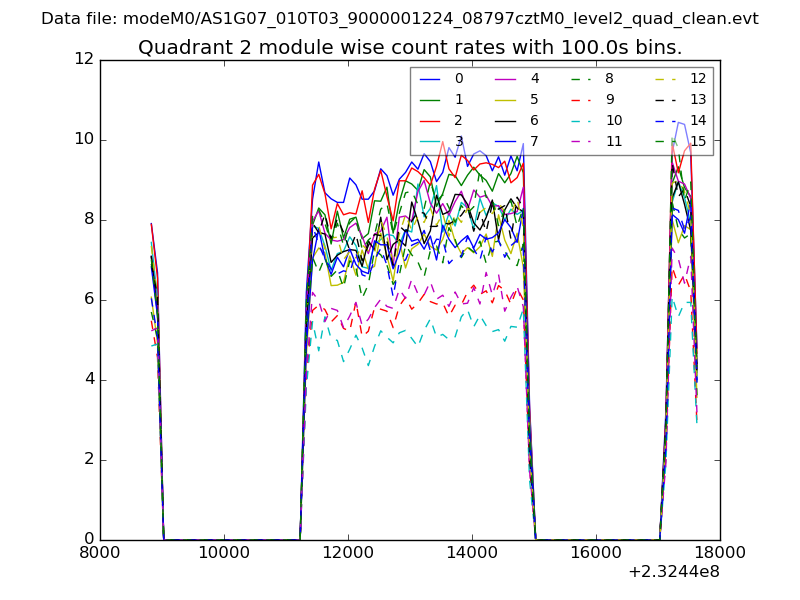
| Module-wise count rates for Quadrant B Data is divided into 100 sec bins |
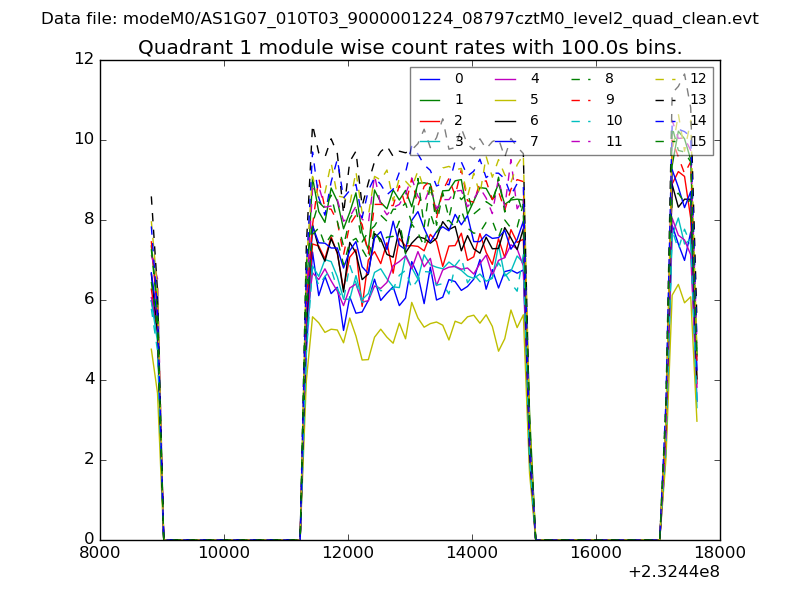 |
 |
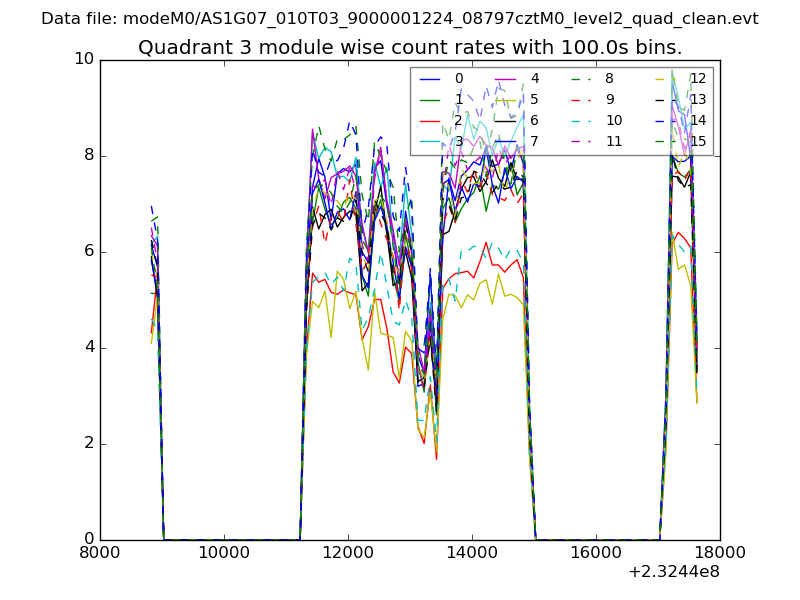
| Module-wise count rates for Quadrant C Data is divided into 100 sec bins |
 |
 |
| Module-wise count rates for Quadrant D Data is divided into 100 sec bins |
 |
 |
| Parameter | Plot |
|---|---|
| CZT HV Monitor | 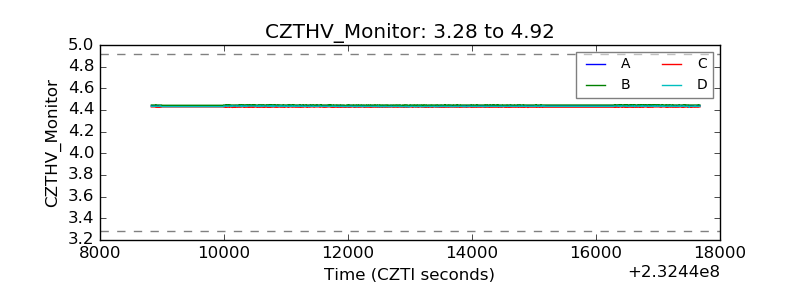 |
| D_VDD | 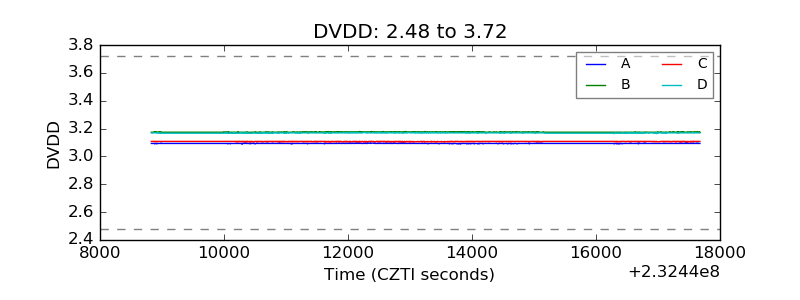 |
| Temperature 1 | 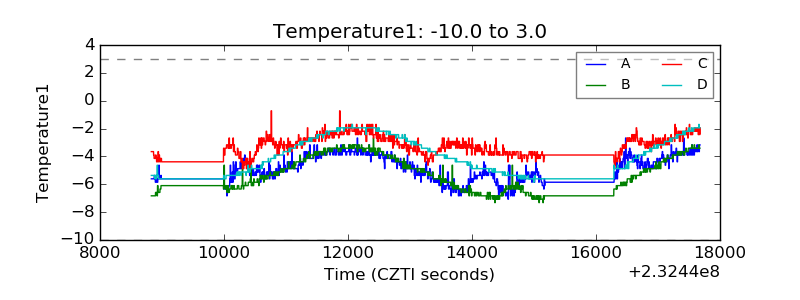 |
| Veto HV Monitor | 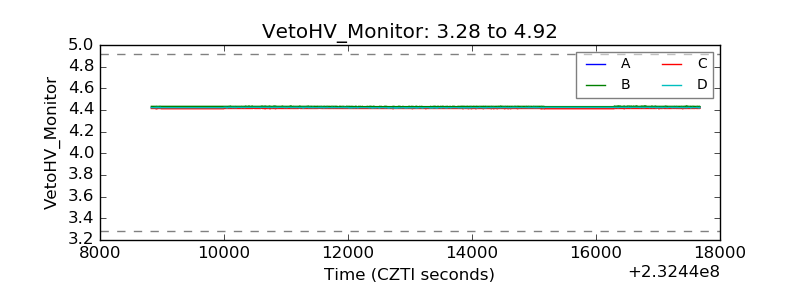 |
| Veto LLD | 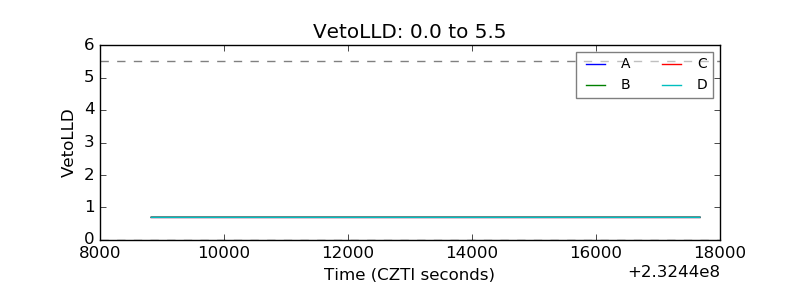 |
| Alpha Counter | 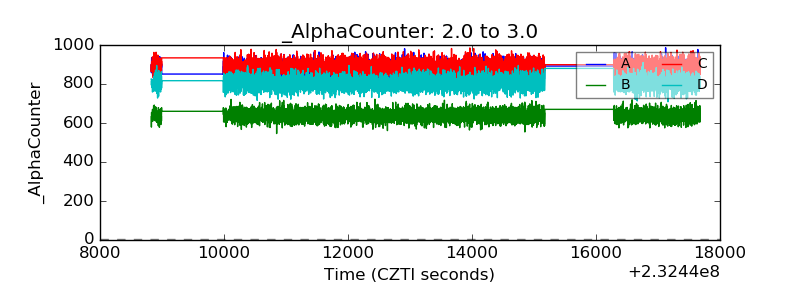 |
| _CPM_Rate | 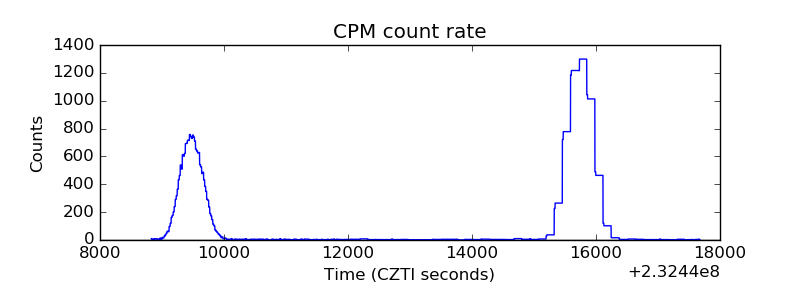 |
| CZT Counter | 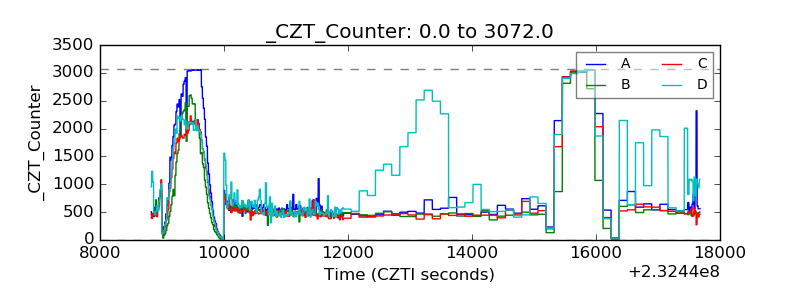 |
| +2.5 Volts monitor |  |
| +5 Volts monitor | 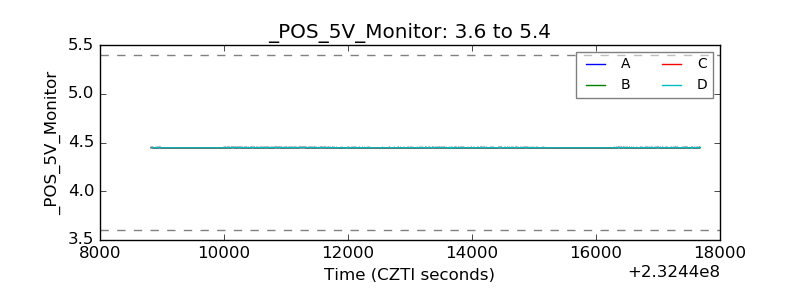 |
| _ROLL_ROT | 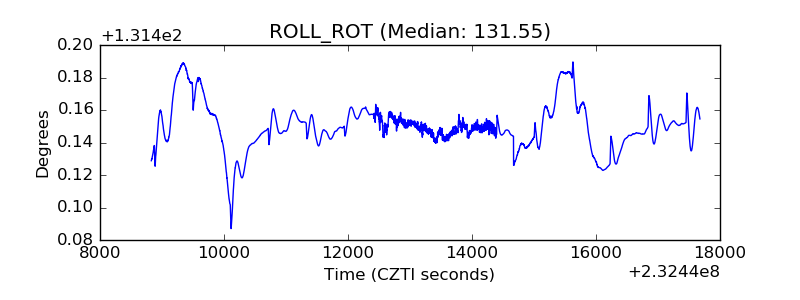 |
| _Roll_DEC | 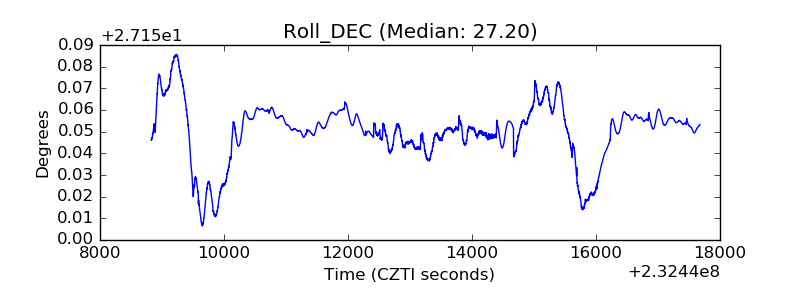 |
| _Roll_RA | 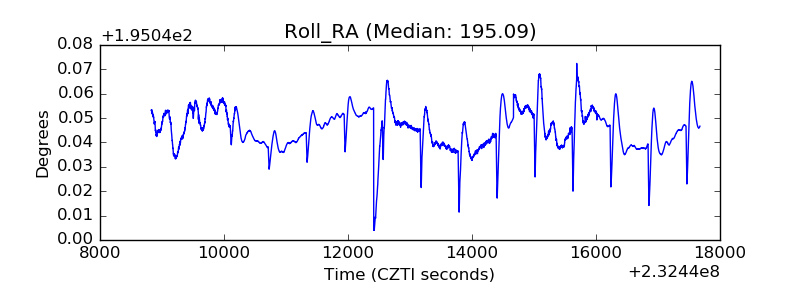 |
| Veto Counter | 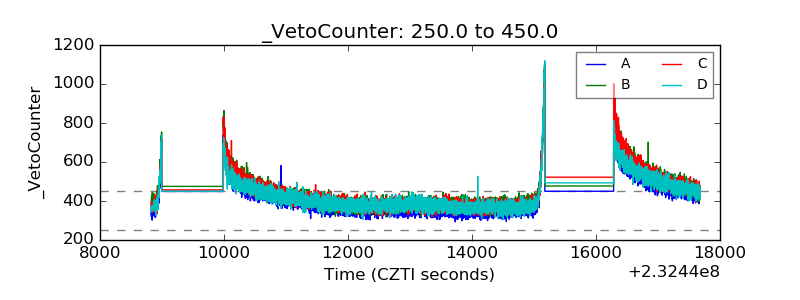 |