| Param | Original file | Final file |
|---|---|---|
| Filename | modeM0/AS1G07_010T03_9000001224_08798cztM0_level2.evt | modeM0/AS1G07_010T03_9000001224_08798cztM0_level2_quad_clean.evt |
| Size (bytes) | 553,573,440 | 94,147,200 |
| Size | 527.9 MB | 89.8 MB |
| Events in quadrant A | 4,123,124 | 607,522 |
| Events in quadrant B | 3,238,008 | 618,886 |
| Events in quadrant C | 3,149,424 | 602,876 |
| Events in quadrant D | 5,820,113 | 574,550 |
| Mode SS | |||
|---|---|---|---|
| Quadrant | BADHDUFLAG | Total packets | Discarded packets |
| A | 0 | 130 | 0 |
| B | 0 | 130 | 0 |
| C | 0 | 130 | 0 |
| D | 0 | 130 | 0 |
| Mode M0 | |||
|---|---|---|---|
| Quadrant | BADHDUFLAG | Total packets | Discarded packets |
| A | 0 | 16600 | 2 |
| B | 0 | 13676 | 1 |
| C | 0 | 13449 | 1 |
| D | 0 | 21678 | 1 |
| Mode M9 | |||
|---|---|---|---|
| Quadrant | BADHDUFLAG | Total packets | Discarded packets |
| A | 0 | 12 | 0 |
| B | 0 | 12 | 0 |
| C | 0 | 12 | 0 |
| D | 0 | 12 | 0 |
| Quadrant | Total seconds | Saturated seconds | Saturation percentage |
|---|---|---|---|
| A | 6413 | 217 | 3.383752% |
| B | 6413 | 63 | 0.982380% |
| C | 6413 | 45 | 0.701700% |
| D | 6413 | 470 | 7.328863% |
Noise dominated data is calculated using 1-second bins in cleaned event files. If a bin has >2000 counts, and if more than 50% of those come from <1% of pixels, then it is considered to be noise-dominated and hence unusable.
| Quadrant | # 1 sec bins | Bins with >0 counts | Bins with >2000 counts | High rate bins dominated by noise | Noise dominated (total time) | Noise dominated (detector-on time) | Marked lightcurve |
|---|---|---|---|---|---|---|---|
| A | 7638 | 6413 | 106 | 106 | 1.39% | 1.65% | 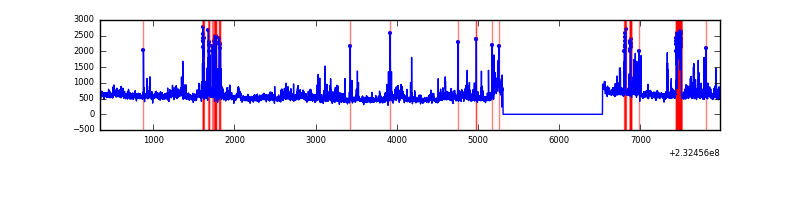 |
| B | 7638 | 6413 | 0 | 0 | 0.00% | 0.00% | 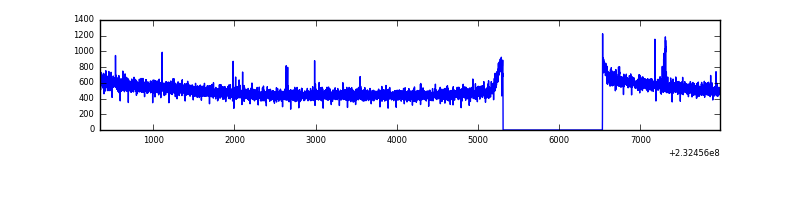 |
| C | 7638 | 6413 | 1 | 1 | 0.01% | 0.02% | 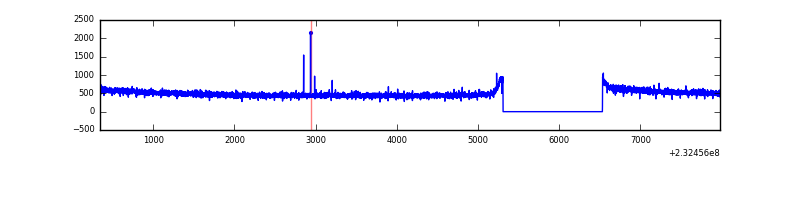 |
| D | 7638 | 6413 | 324 | 324 | 4.24% | 5.05% | 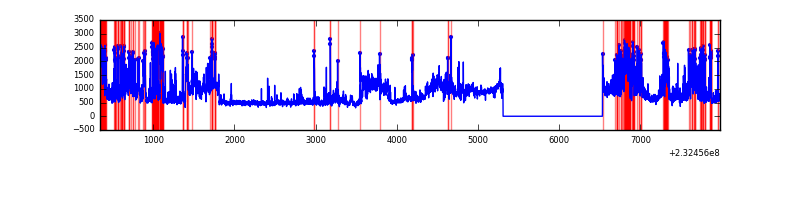 |
Top three noisy pixels from each quadrant. If the there are fewer than three noisy pixels in the level2.evt file, extra rows are filled as -1
| Pixel properties | Quadrant properties | ||||||
|---|---|---|---|---|---|---|---|
| Quadrant | DetID | PixID | Counts | Sigma | Mean | Median | Sigma |
| A | 8 | 5 | 571742 | 3403.84 | 831 | 814 | 167.7 |
| A | 15 | 223 | 239367 | 1422.24 | 831 | 814 | 167.7 |
| A | 15 | 239 | 79522 | 469.25 | 831 | 814 | 167.7 |
| B | 12 | 111 | 17289 | 105.21 | 829 | 810 | 156.6 |
| B | 11 | 111 | 13990 | 84.15 | 829 | 810 | 156.6 |
| B | 5 | 174 | 13313 | 79.83 | 829 | 810 | 156.6 |
| C | 13 | 61 | 6081 | 28.49 | 806 | 809 | 185.0 |
| C | 12 | 4 | 5443 | 25.05 | 806 | 809 | 185.0 |
| C | 8 | 222 | 2396 | 8.58 | 806 | 809 | 185.0 |
| D | 2 | 16 | 1520292 | 7774.94 | 781 | 761 | 195.4 |
| D | 13 | 122 | 668013 | 3414.11 | 781 | 761 | 195.4 |
| D | 4 | 95 | 283288 | 1445.6 | 781 | 761 | 195.4 |
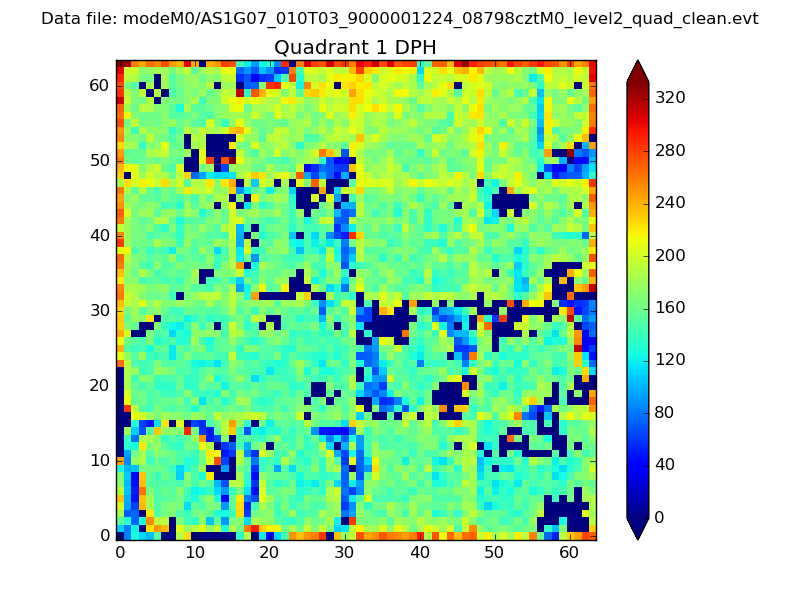
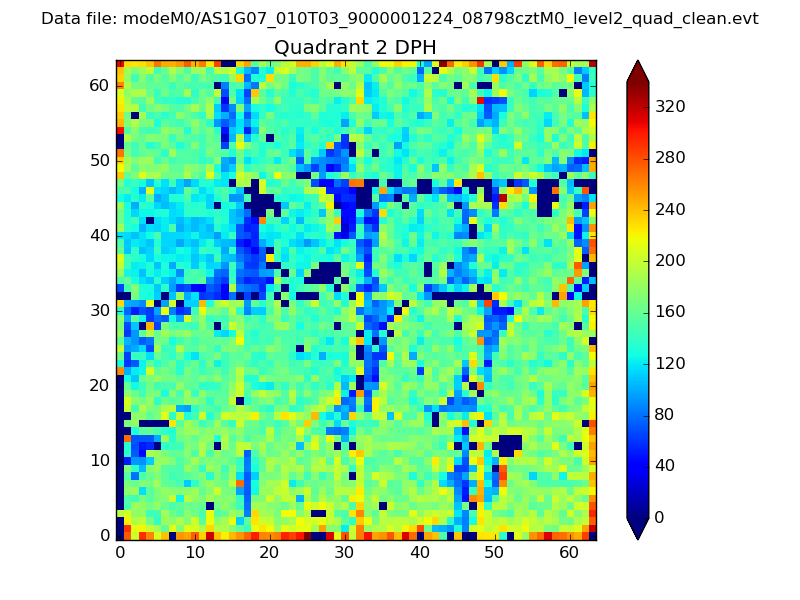
Histogram calculated using DETX and DETY for each event in the final _common_clean file
| Quadrant A |  |
 |
Quadrant B |
|---|---|---|---|
| Quadrant D |  |
 |
Quadrant C |
| Plot type | Count rate plots | Images |
|---|---|---|
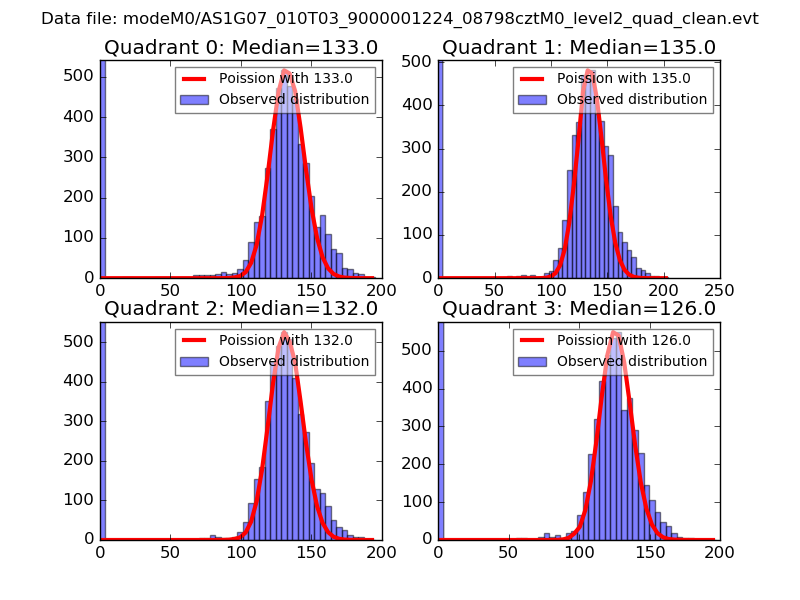
| Comparison with Poisson distribution Blue bars denote a histogram of data divided into 1 sec bins. Red curve is a Poisson curve with rate = median count rate of data. |
 |
 |
| Quadrant-wise count rates Data is divided into 100 sec bins |
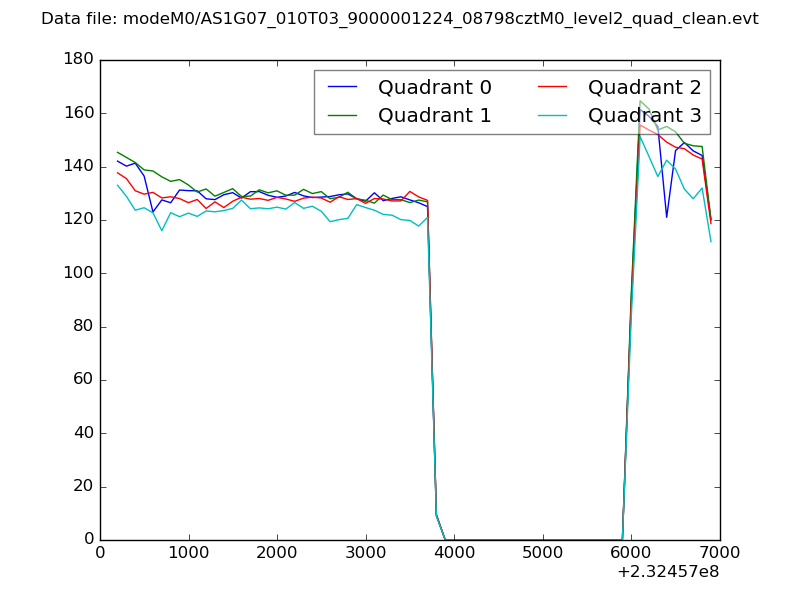 |
|
| Module-wise count rates for Quadrant A Data is divided into 100 sec bins |
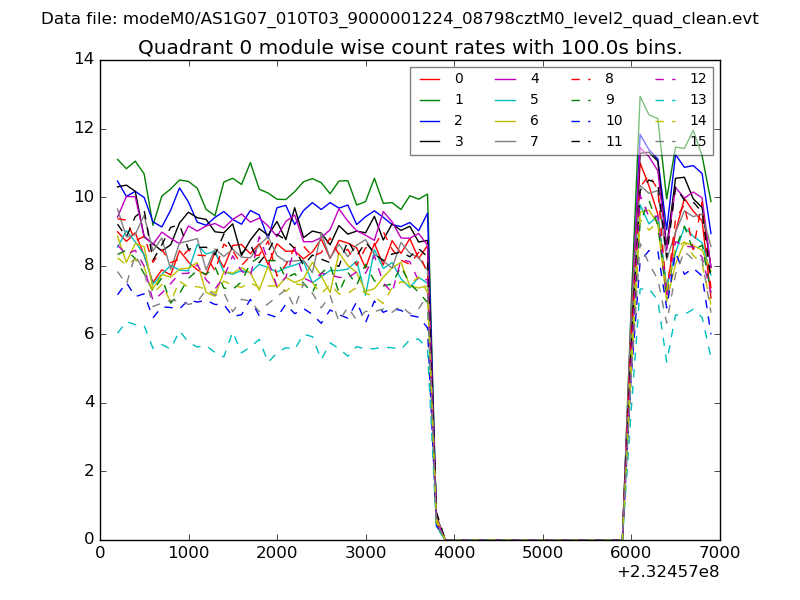 |
 |
| Module-wise count rates for Quadrant B Data is divided into 100 sec bins |
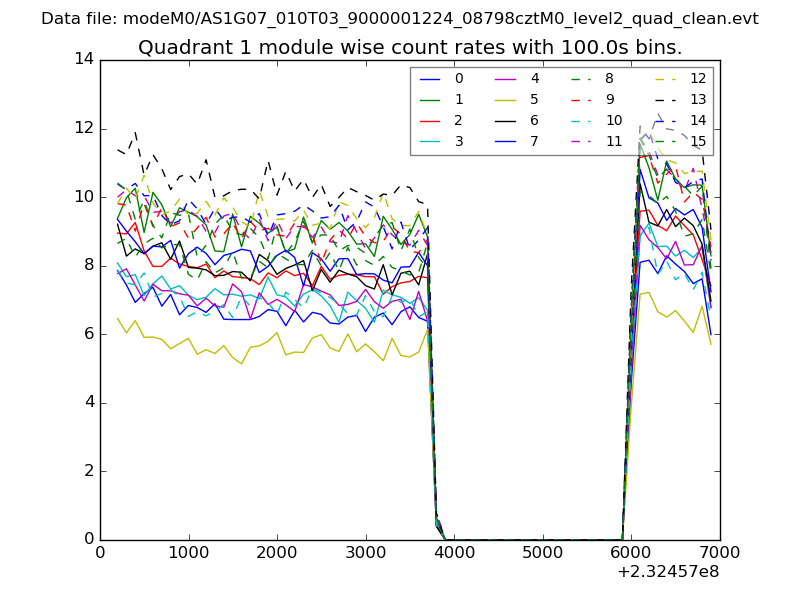 |
 |
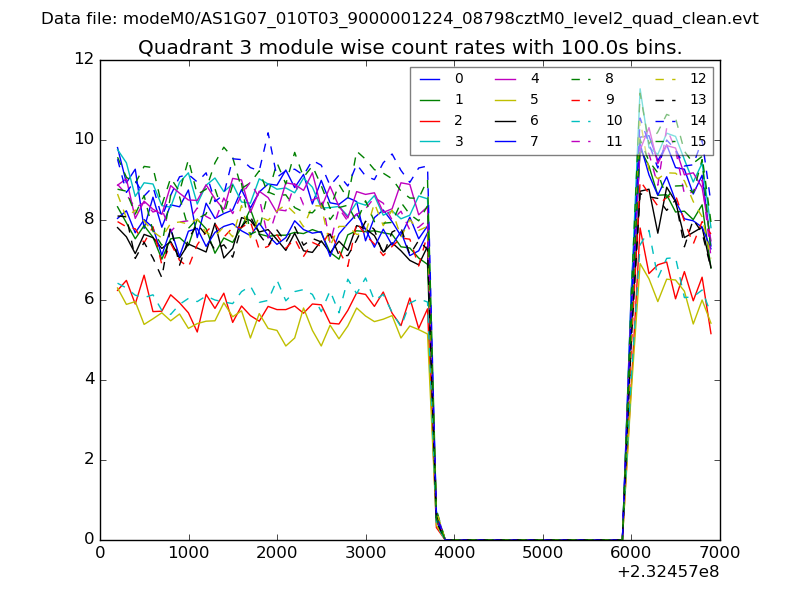
| Module-wise count rates for Quadrant C Data is divided into 100 sec bins |
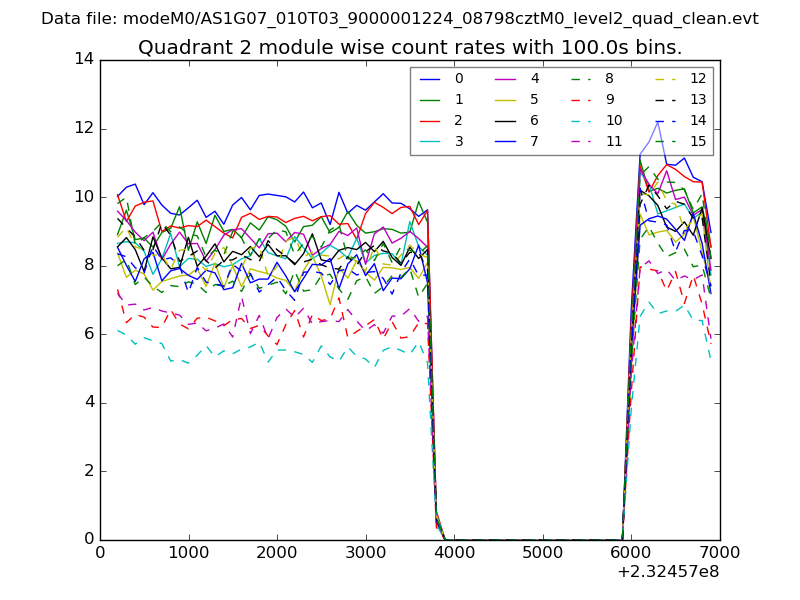 |
 |
| Module-wise count rates for Quadrant D Data is divided into 100 sec bins |
 |
 |
| Parameter | Plot |
|---|---|
| CZT HV Monitor | 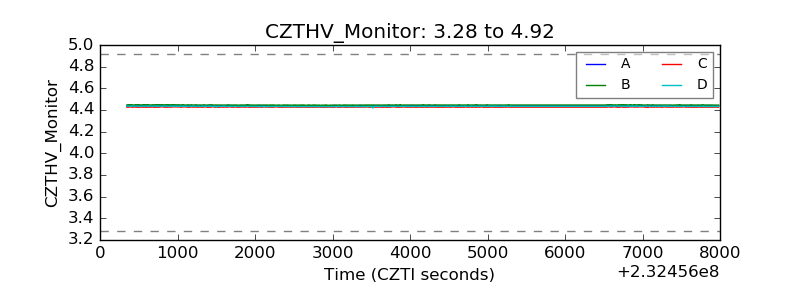 |
| D_VDD |  |
| Temperature 1 | 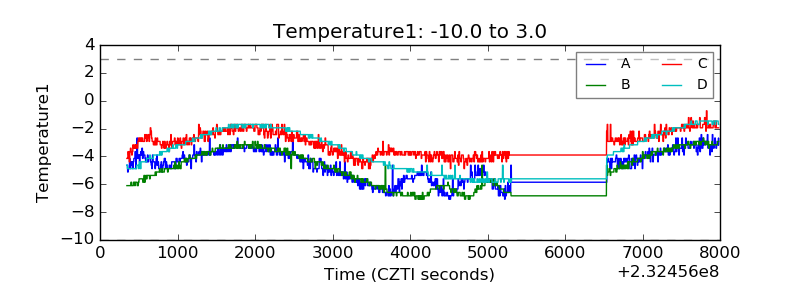 |
| Veto HV Monitor | 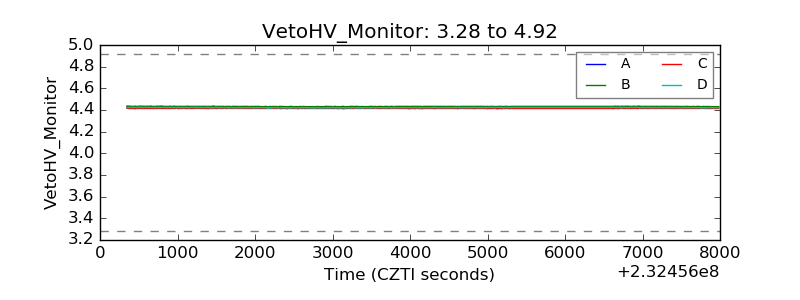 |
| Veto LLD | 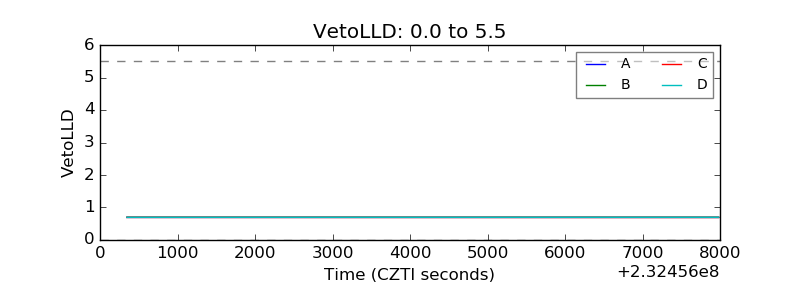 |
| Alpha Counter | 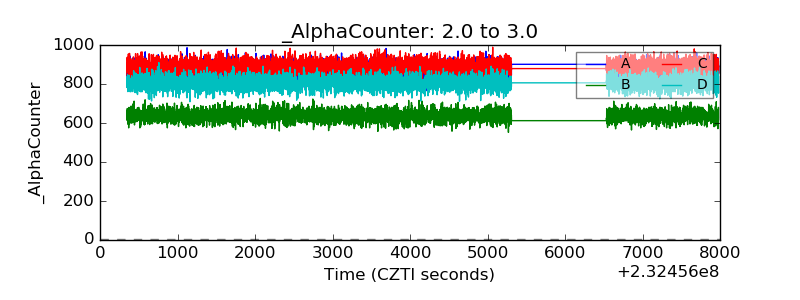 |
| _CPM_Rate | 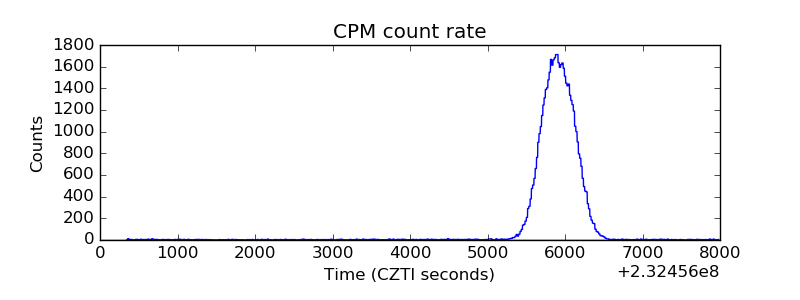 |
| CZT Counter | 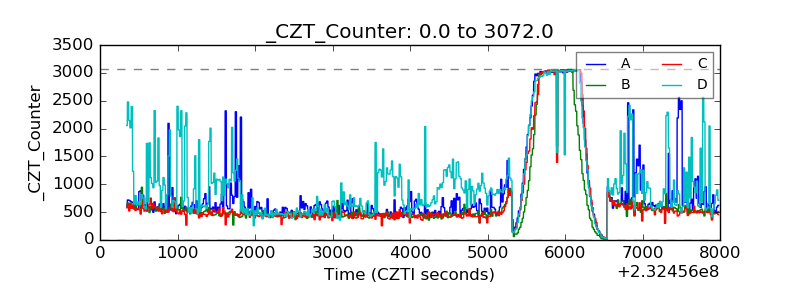 |
| +2.5 Volts monitor |  |
| +5 Volts monitor | 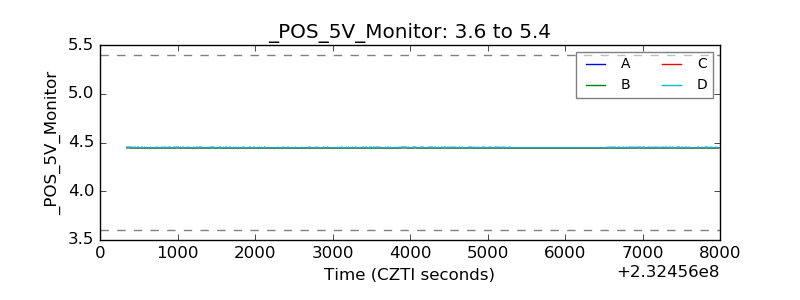 |
| _ROLL_ROT | 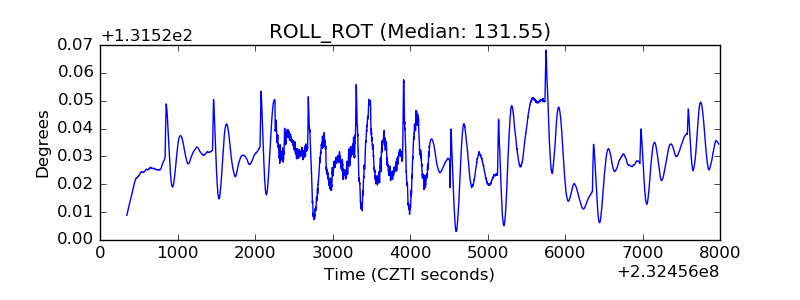 |
| _Roll_DEC | 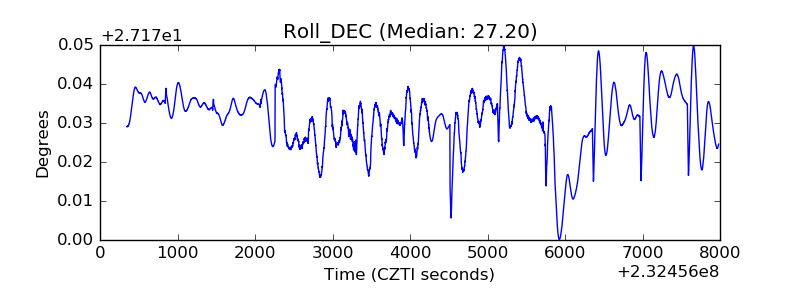 |
| _Roll_RA | 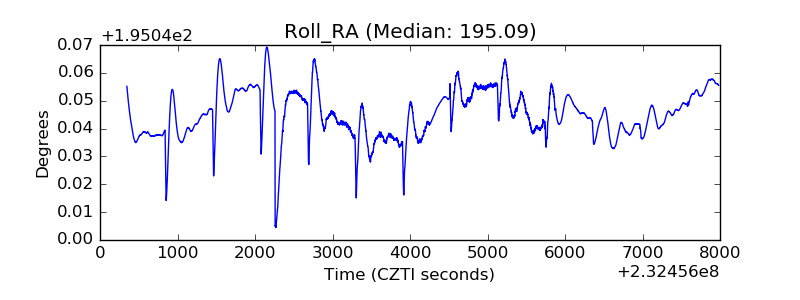 |
| Veto Counter | 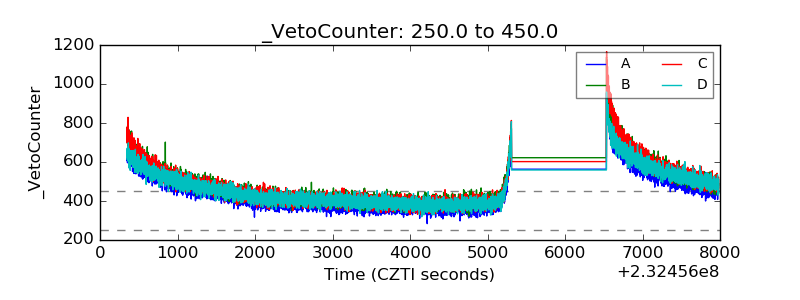 |