| Param | Original file | Final file |
|---|---|---|
| Filename | modeM0/AS1G07_010T03_9000001224_08799cztM0_level2.evt | modeM0/AS1G07_010T03_9000001224_08799cztM0_level2_quad_clean.evt |
| Size (bytes) | 265,970,880 | 60,292,800 |
| Size | 253.6 MB | 57.5 MB |
| Events in quadrant A | 1,945,940 | 414,204 |
| Events in quadrant B | 1,450,323 | 419,875 |
| Events in quadrant C | 1,412,143 | 415,728 |
| Events in quadrant D | 3,037,363 | 358,131 |
| Mode SS | |||
|---|---|---|---|
| Quadrant | BADHDUFLAG | Total packets | Discarded packets |
| A | 0 | 62 | 0 |
| B | 0 | 62 | 0 |
| C | 0 | 62 | 0 |
| D | 0 | 62 | 0 |
| Mode M0 | |||
|---|---|---|---|
| Quadrant | BADHDUFLAG | Total packets | Discarded packets |
| A | 0 | 7779 | 7 |
| B | 0 | 6220 | 0 |
| C | 0 | 6140 | 0 |
| D | 0 | 11113 | 5 |
| Quadrant | Total seconds | Saturated seconds | Saturation percentage |
|---|---|---|---|
| A | 3051 | 81 | 2.654867% |
| B | 3053 | 1 | 0.032755% |
| C | 3053 | 0 | 0.000000% |
| D | 3051 | 464 | 15.208128% |
Noise dominated data is calculated using 1-second bins in cleaned event files. If a bin has >2000 counts, and if more than 50% of those come from <1% of pixels, then it is considered to be noise-dominated and hence unusable.
| Quadrant | # 1 sec bins | Bins with >0 counts | Bins with >2000 counts | High rate bins dominated by noise | Noise dominated (total time) | Noise dominated (detector-on time) | Marked lightcurve |
|---|---|---|---|---|---|---|---|
| A | 3053 | 3053 | 70 | 70 | 2.29% | 2.29% | 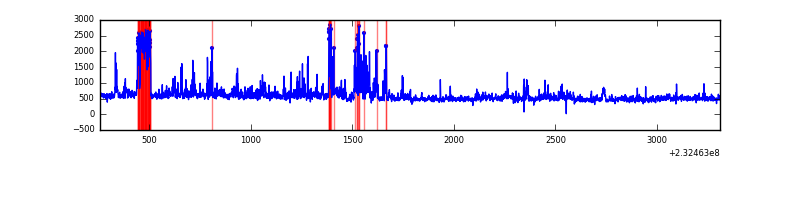 |
| B | 3053 | 3053 | 0 | 0 | 0.00% | 0.00% | 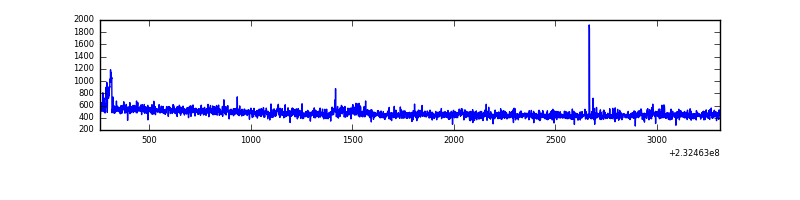 |
| C | 3053 | 3053 | 0 | 0 | 0.00% | 0.00% | 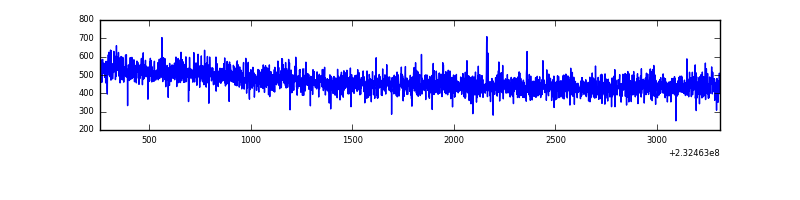 |
| D | 3052 | 3052 | 455 | 455 | 14.91% | 14.91% | 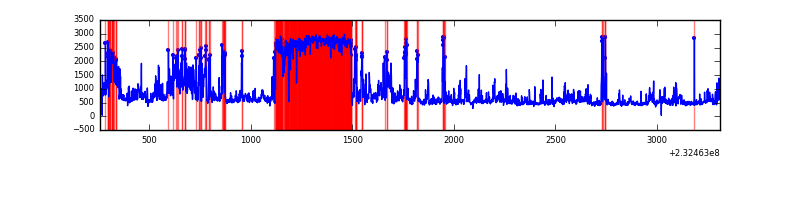 |
Top three noisy pixels from each quadrant. If the there are fewer than three noisy pixels in the level2.evt file, extra rows are filled as -1
| Pixel properties | Quadrant properties | ||||||
|---|---|---|---|---|---|---|---|
| Quadrant | DetID | PixID | Counts | Sigma | Mean | Median | Sigma |
| A | 15 | 223 | 234808 | 3122.74 | 366 | 359 | 75.1 |
| A | 8 | 5 | 184134 | 2447.79 | 366 | 359 | 75.1 |
| A | 15 | 239 | 89198 | 1183.29 | 366 | 359 | 75.1 |
| B | 5 | 174 | 11497 | 158.76 | 366 | 358 | 70.2 |
| B | 0 | 168 | 9494 | 130.21 | 366 | 358 | 70.2 |
| B | 12 | 111 | 7207 | 97.62 | 366 | 358 | 70.2 |
| C | 13 | 61 | 2732 | 27.98 | 361 | 365 | 84.6 |
| C | 8 | 222 | 1921 | 18.39 | 361 | 365 | 84.6 |
| C | 12 | 4 | 1241 | 10.35 | 361 | 365 | 84.6 |
| D | 2 | 16 | 1359787 | 16713.45 | 326 | 319 | 81.3 |
| D | 2 | 152 | 155073 | 1902.56 | 326 | 319 | 81.3 |
| D | 4 | 95 | 123694 | 1516.79 | 326 | 319 | 81.3 |
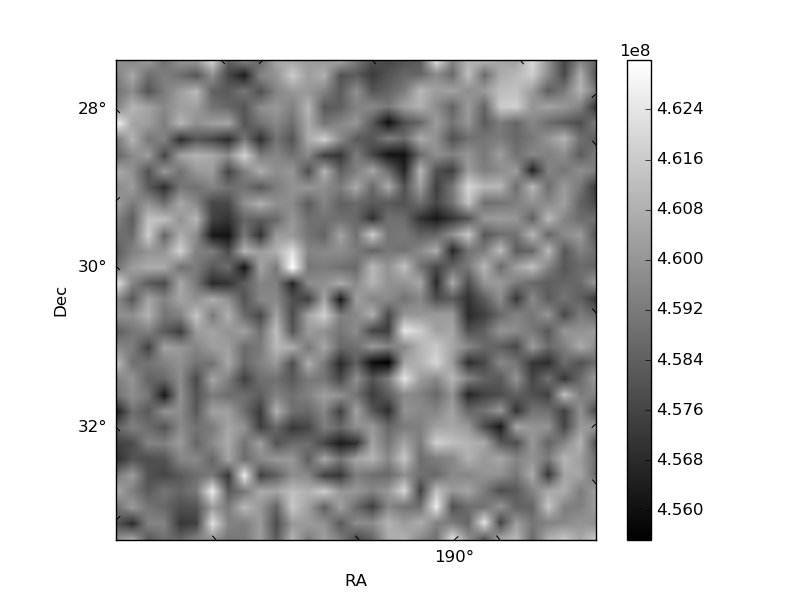
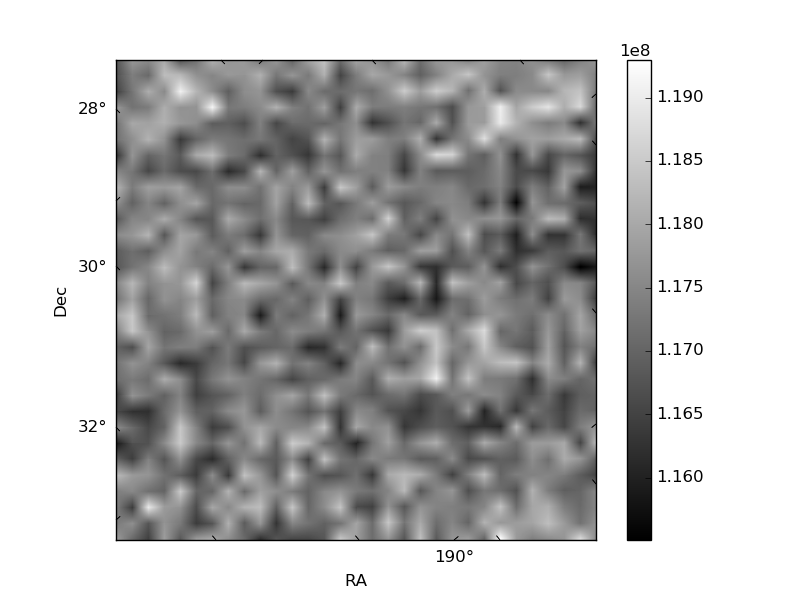
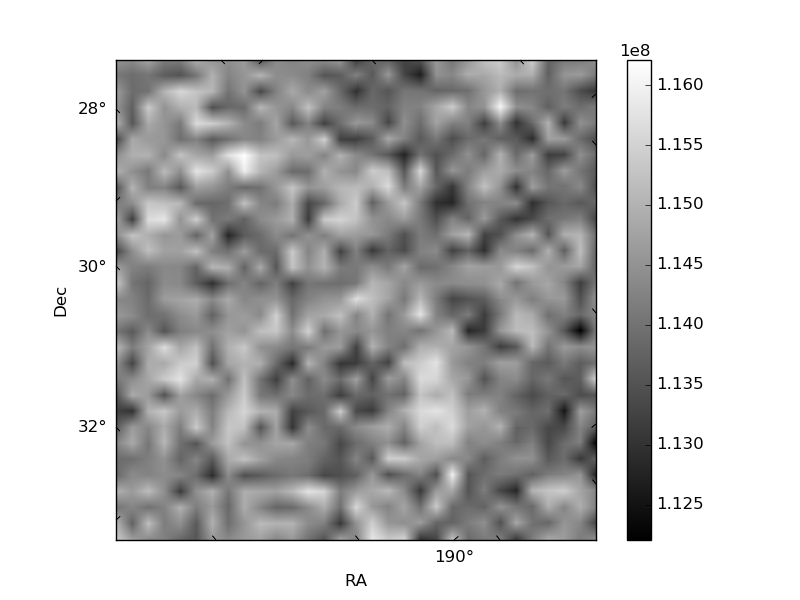
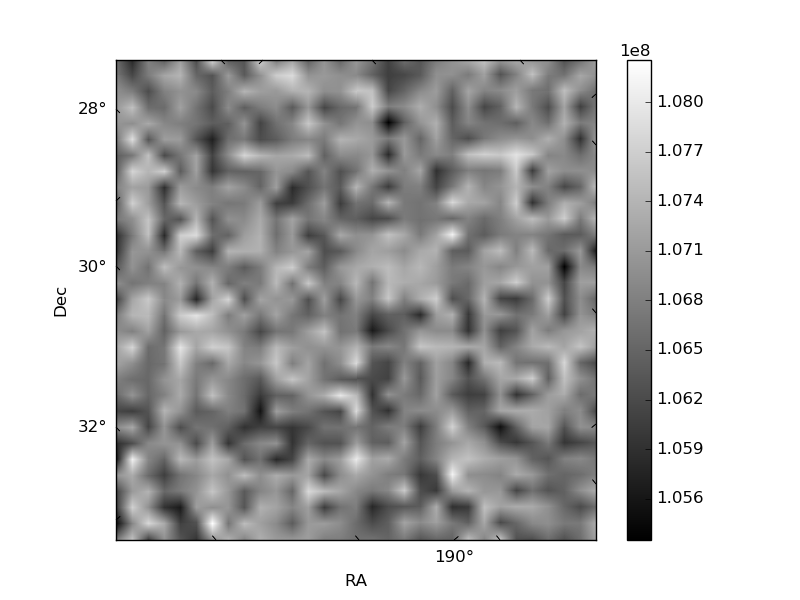
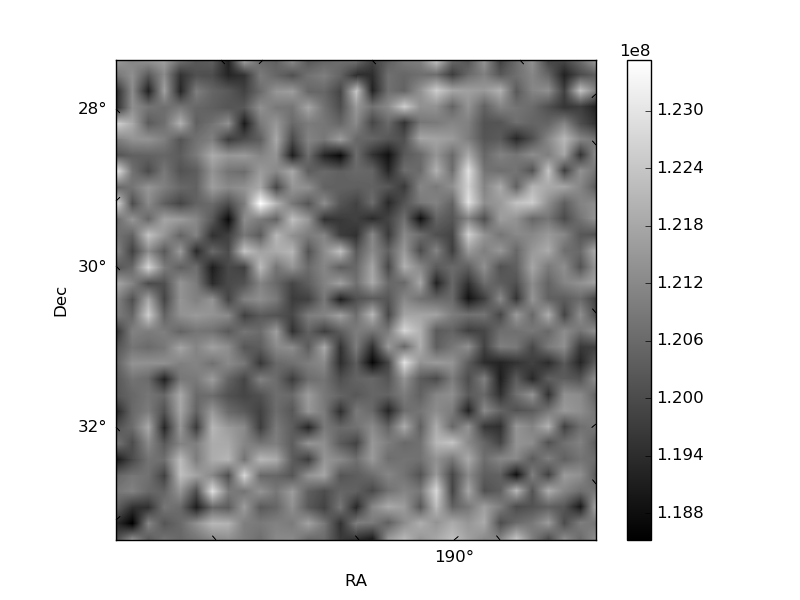
Histogram calculated using DETX and DETY for each event in the final _common_clean file
| Quadrant A | 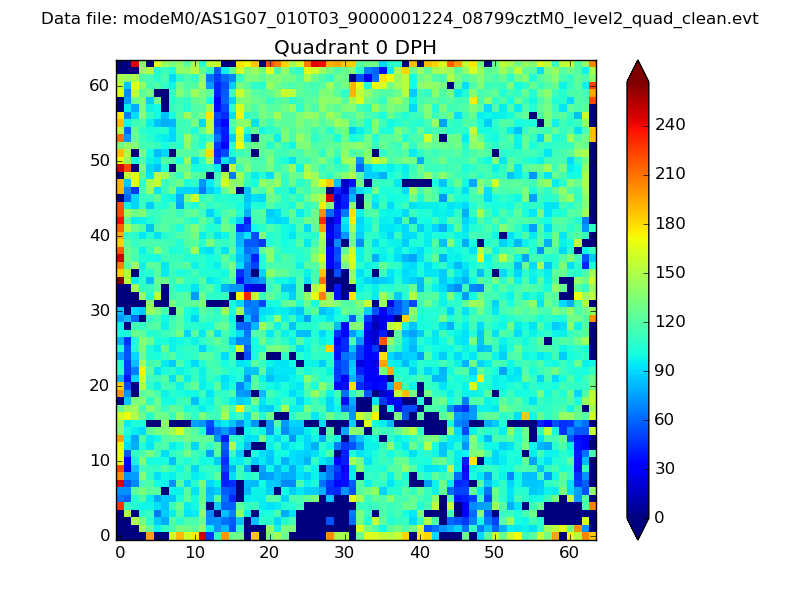 |
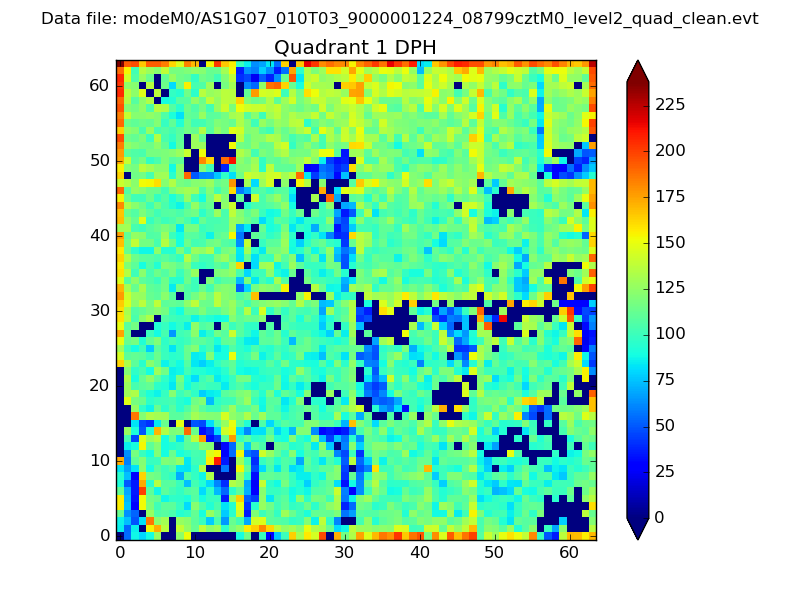 |
Quadrant B |
|---|---|---|---|
| Quadrant D | 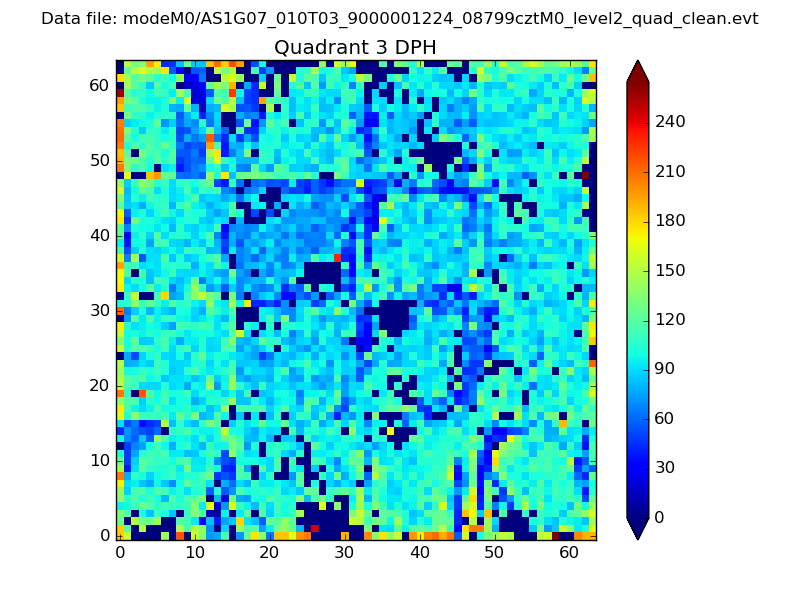 |
 |
Quadrant C |
| Plot type | Count rate plots | Images |
|---|---|---|
| Comparison with Poisson distribution Blue bars denote a histogram of data divided into 1 sec bins. Red curve is a Poisson curve with rate = median count rate of data. |
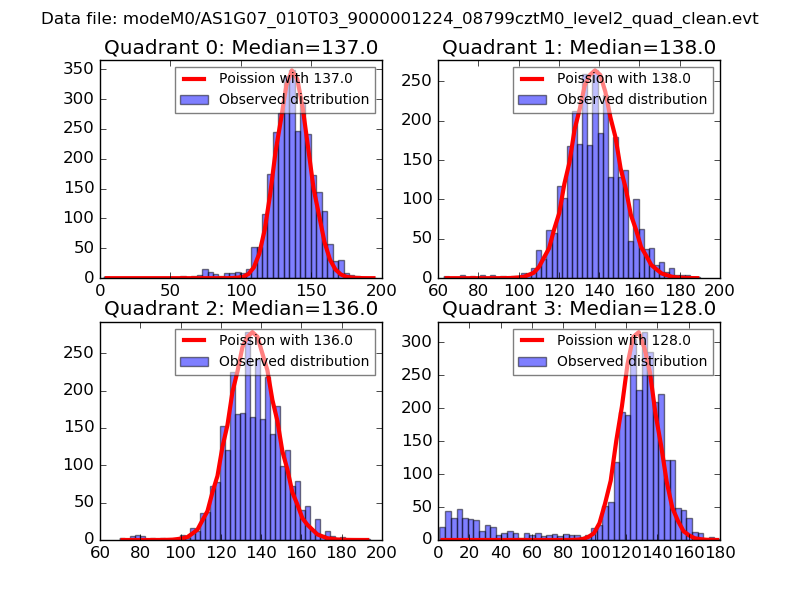 |
 |
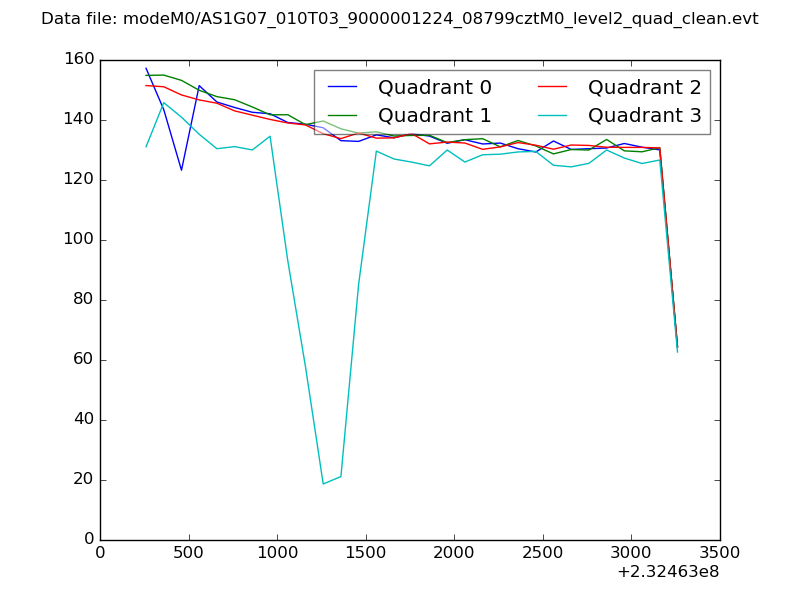
| Quadrant-wise count rates Data is divided into 100 sec bins |
 |
|
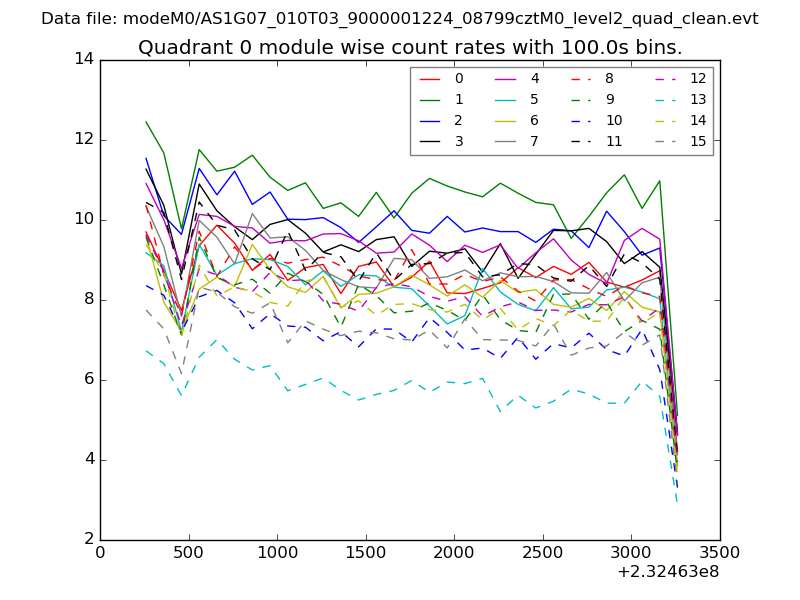
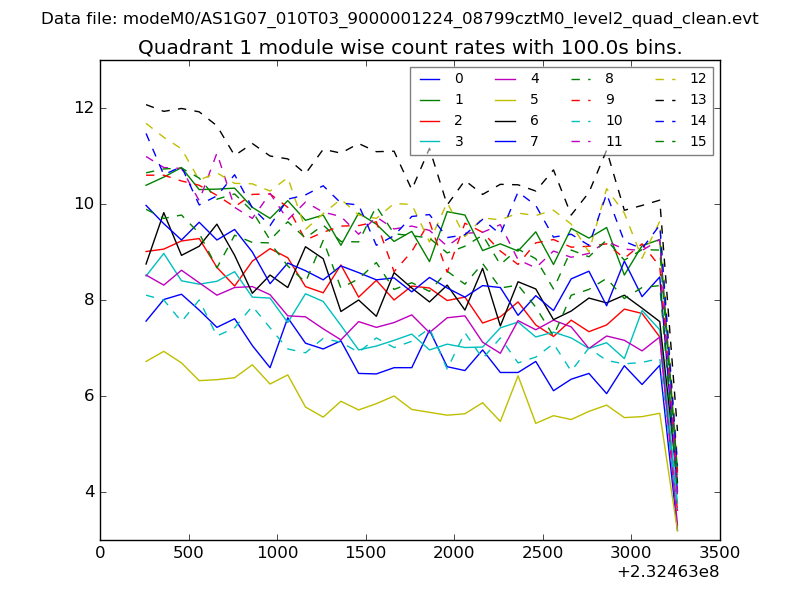
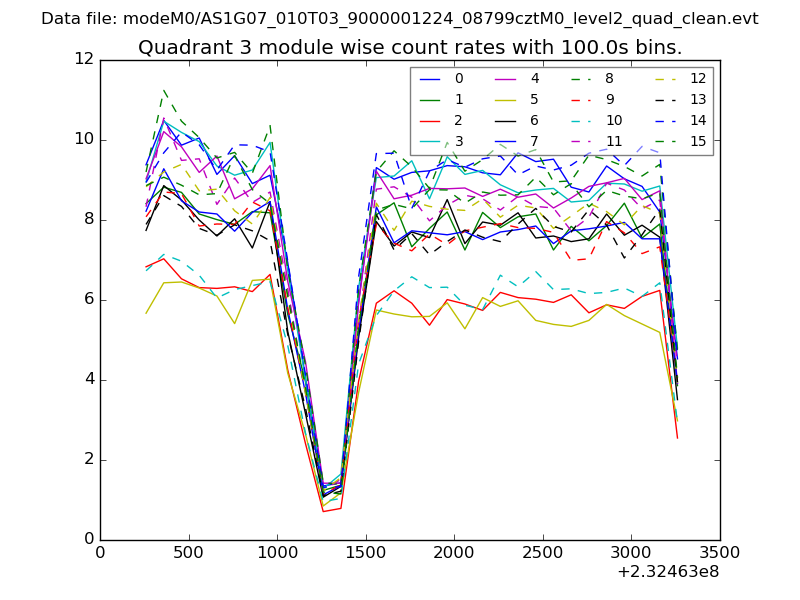
| Module-wise count rates for Quadrant A Data is divided into 100 sec bins |
 |
 |
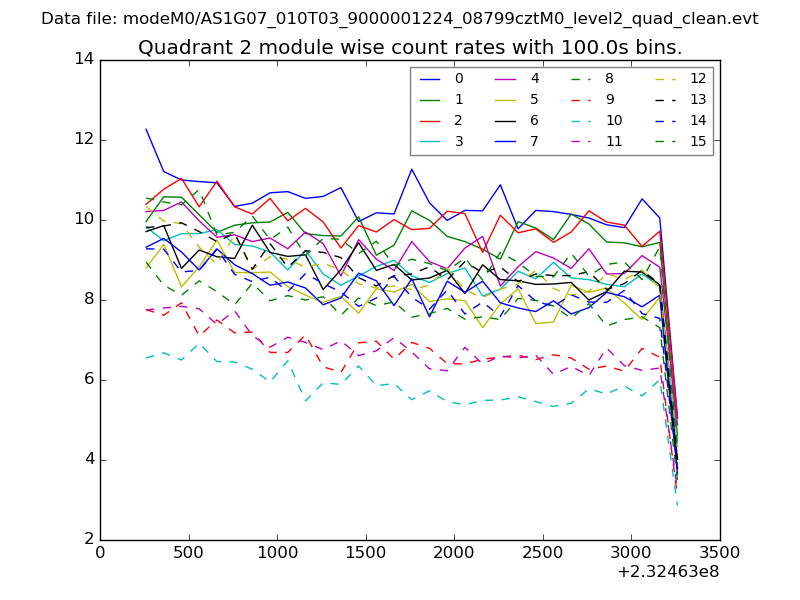
| Module-wise count rates for Quadrant B Data is divided into 100 sec bins |
 |
 |
| Module-wise count rates for Quadrant C Data is divided into 100 sec bins |
 |
 |
| Module-wise count rates for Quadrant D Data is divided into 100 sec bins |
 |
 |
| Parameter | Plot |
|---|---|
| CZT HV Monitor | 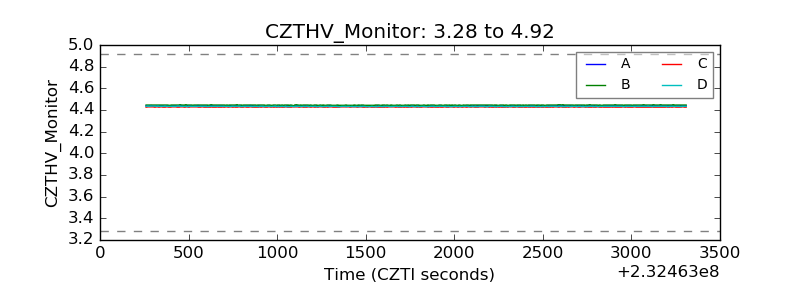 |
| D_VDD | 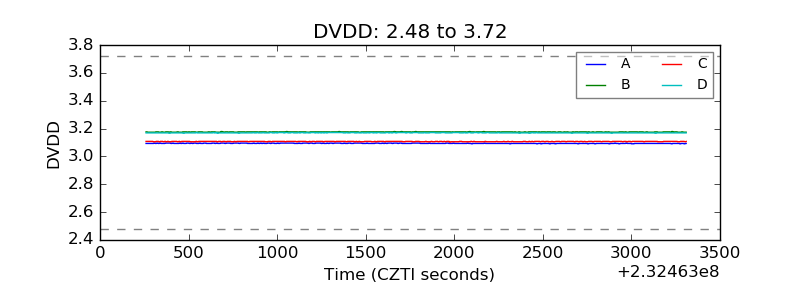 |
| Temperature 1 | 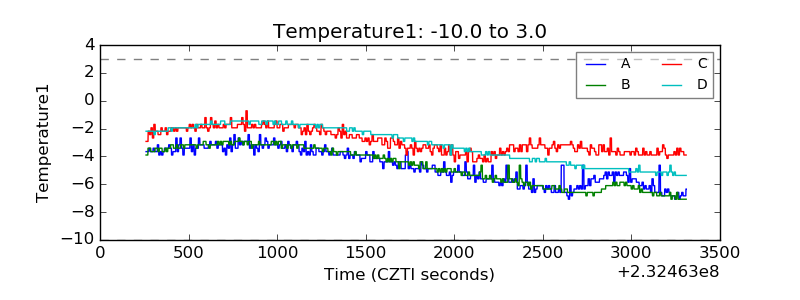 |
| Veto HV Monitor | 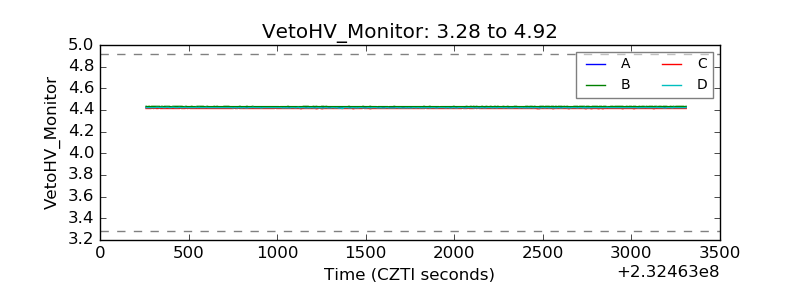 |
| Veto LLD |  |
| Alpha Counter | 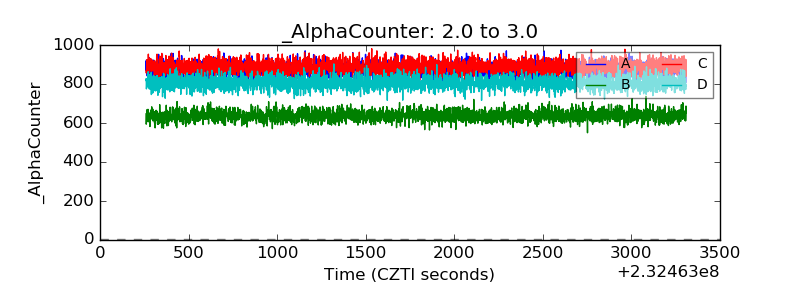 |
| _CPM_Rate | 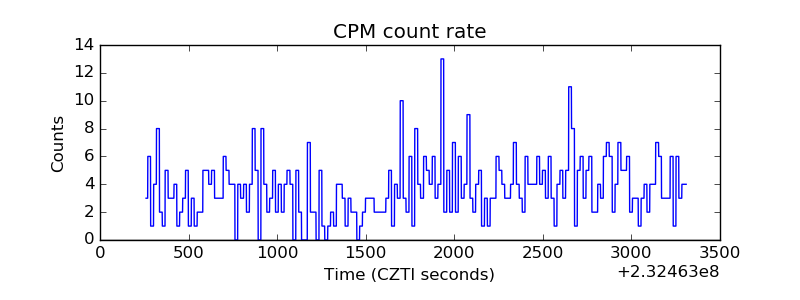 |
| CZT Counter | 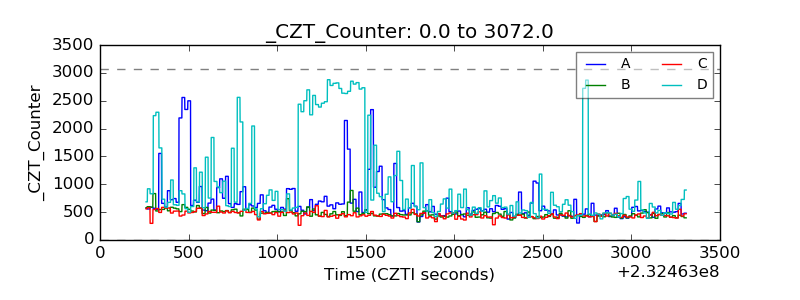 |
| +2.5 Volts monitor |  |
| +5 Volts monitor |  |
| _ROLL_ROT | 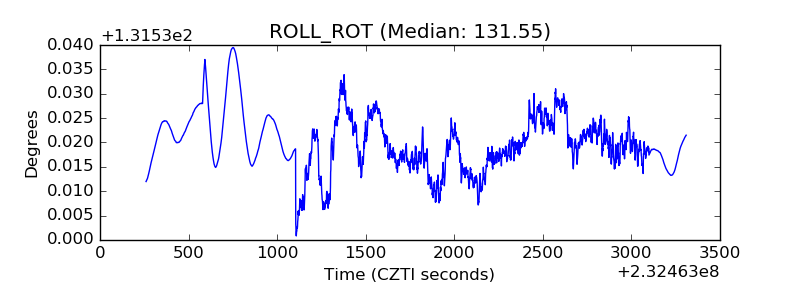 |
| _Roll_DEC | 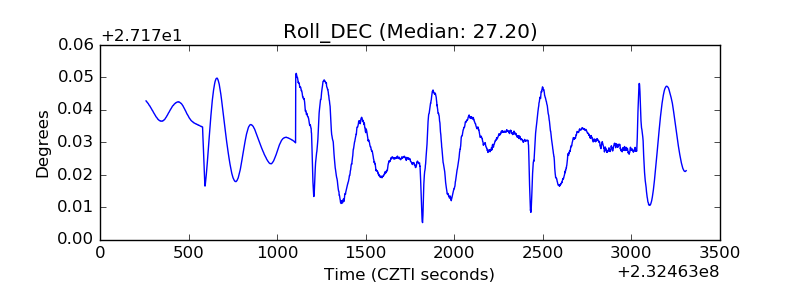 |
| _Roll_RA | 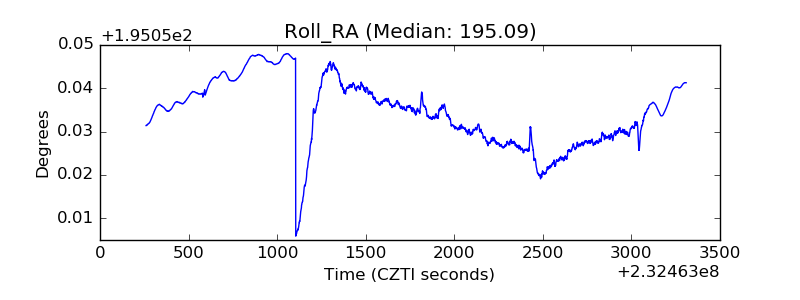 |
| Veto Counter | 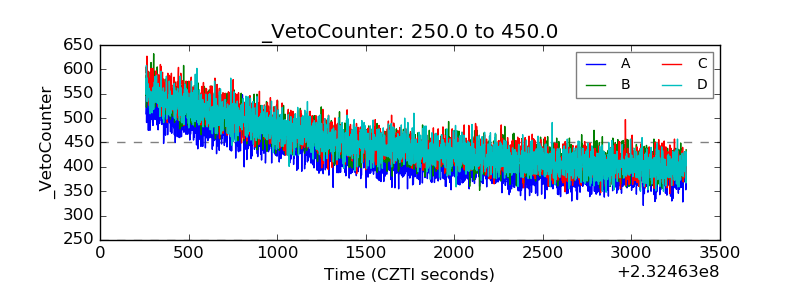 |