| Param | Original file | Final file |
|---|---|---|
| Filename | modeM0/AS1A03_135T01_9000001226cztM0_level2.fits | modeM0/AS1A03_135T01_9000001226cztM0_level2_quad_clean.evt |
| Size (bytes) | 1,354,043,520 | 1,296,325,440 |
| Size | 1.3 GB | 1.2 GB |
| Events in quadrant A | 8,304,378 | 7,819,972 |
| Events in quadrant B | 7,957,692 | 7,733,808 |
| Events in quadrant C | 8,115,050 | 7,383,361 |
| Events in quadrant D | 6,793,954 | 6,491,833 |
| Mode SS | |||
|---|---|---|---|
| Quadrant | BADHDUFLAG | Total packets | Discarded packets |
| A | 0 | 2938 | 0 |
| B | 0 | 2938 | 0 |
| C | 0 | 2936 | 0 |
| D | 0 | 2928 | 0 |
| Mode M0 | |||
|---|---|---|---|
| Quadrant | BADHDUFLAG | Total packets | Discarded packets |
| A | 0 | 338679 | 0 |
| B | 0 | 317308 | 0 |
| C | 0 | 295528 | 0 |
| D | 0 | 399463 | 0 |
| Mode M9 | |||
|---|---|---|---|
| Quadrant | BADHDUFLAG | Total packets | Discarded packets |
| A | 0 | 218 | 0 |
| B | 0 | 218 | 0 |
| C | 0 | 217 | 0 |
| D | 0 | 218 | 0 |
| Quadrant | Total seconds | Saturated seconds | Saturation percentage |
|---|---|---|---|
| A | 143418 | 2687 | 1.873544% |
| B | 143460 | 2900 | 2.021469% |
| C | 143447 | 1002 | 0.698516% |
| D | 143429 | 10490 | 7.313723% |
Noise dominated data is calculated using 1-second bins in cleaned event files. If a bin has >2000 counts, and if more than 50% of those come from <1% of pixels, then it is considered to be noise-dominated and hence unusable.
| Quadrant | # 1 sec bins | Bins with >0 counts | Bins with >2000 counts | High rate bins dominated by noise | Noise dominated (total time) | Noise dominated (detector-on time) | Marked lightcurve |
|---|---|---|---|---|---|---|---|
| A | 173848 | 143855 | 0 | 0 | 0.00% | 0.00% |  |
| B | 173848 | 143820 | 0 | 0 | 0.00% | 0.00% |  |
| C | 173848 | 143877 | 0 | 0 | 0.00% | 0.00% | 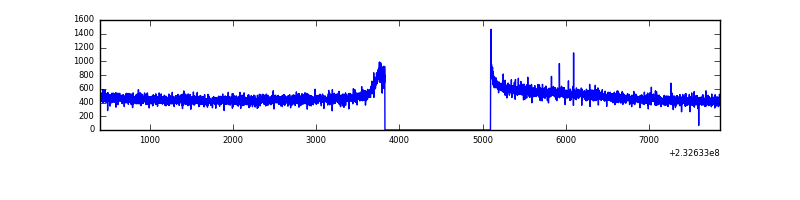 |
| D | 173848 | 143282 | 0 | 0 | 0.00% | 0.00% |  |
Top three noisy pixels from each quadrant. If the there are fewer than three noisy pixels in the level2.evt file, extra rows are filled as -1
| Pixel properties | Quadrant properties | ||||||
|---|---|---|---|---|---|---|---|
| Quadrant | DetID | PixID | Counts | Sigma | Mean | Median | Sigma |
| A | 0 | 29 | 7980 | 11.06 | 2157 | 2013 | 539.7 |
| A | 7 | 110 | 6928 | 9.11 | 2157 | 2013 | 539.7 |
| A | 9 | 19 | 6118 | 7.61 | 2157 | 2013 | 539.7 |
| B | 2 | 9 | 6866 | 11.77 | 2096 | 1993 | 414.2 |
| B | 3 | 17 | 5336 | 8.07 | 2096 | 1993 | 414.2 |
| B | 14 | 254 | 5299 | 7.98 | 2096 | 1993 | 414.2 |
| C | 1 | 80 | 5966 | 7.06 | 2144 | 1983 | 563.8 |
| C | 1 | 81 | 5924 | 6.99 | 2144 | 1983 | 563.8 |
| C | 12 | 241 | 5648 | 6.5 | 2144 | 1983 | 563.8 |
| D | 6 | 231 | 4996 | 6.26 | 1939 | 1765 | 516.1 |
| D | 3 | 14 | 4870 | 6.02 | 1939 | 1765 | 516.1 |
| D | 1 | 19 | 4822 | 5.92 | 1939 | 1765 | 516.1 |
Histogram calculated using DETX and DETY for each event in the final _common_clean file
| Quadrant A | 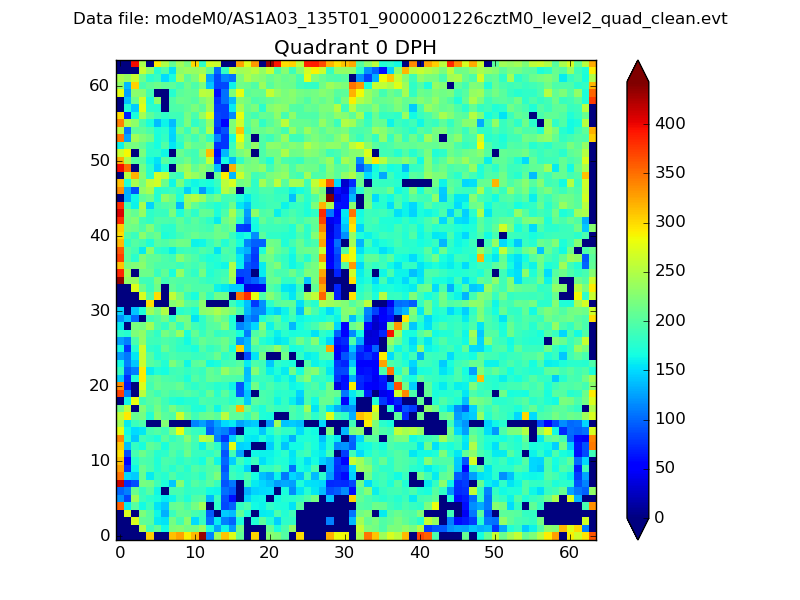 |
 |
Quadrant B |
|---|---|---|---|
| Quadrant D |  |
 |
Quadrant C |
| Plot type | Count rate plots | Images |
|---|---|---|
| Comparison with Poisson distribution Blue bars denote a histogram of data divided into 1 sec bins. Red curve is a Poisson curve with rate = median count rate of data. |
 |
 |
| Quadrant-wise count rates Data is divided into 100 sec bins |
 |
|
| Module-wise count rates for Quadrant A Data is divided into 100 sec bins |
 |
 |
| Module-wise count rates for Quadrant B Data is divided into 100 sec bins |
 |
 |
| Module-wise count rates for Quadrant C Data is divided into 100 sec bins |
 |
 |
| Module-wise count rates for Quadrant D Data is divided into 100 sec bins |
 |
 |
| Parameter | Plot |
|---|---|
| CZT HV Monitor |  |
| D_VDD |  |
| Temperature 1 |  |
| Veto HV Monitor |  |
| Veto LLD |  |
| Alpha Counter |  |
| _CPM_Rate |  |
| CZT Counter |  |
| +2.5 Volts monitor | 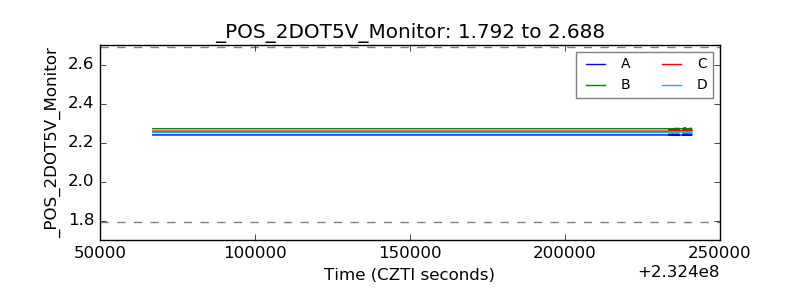 |
| +5 Volts monitor |  |
| _ROLL_ROT |  |
| _Roll_DEC | 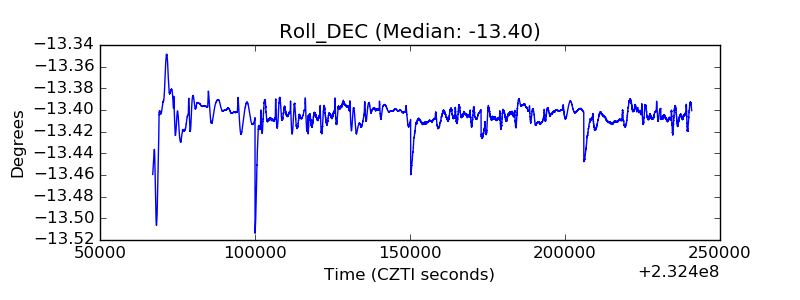 |
| _Roll_RA |  |
| Veto Counter |  |