| Param | Original file | Final file |
|---|---|---|
| Filename | modeM0/AS1A03_135T01_9000001226_08799cztM0_level2.evt | modeM0/AS1A03_135T01_9000001226_08799cztM0_level2_quad_clean.evt |
| Size (bytes) | 191,859,840 | 29,090,880 |
| Size | 183.0 MB | 27.7 MB |
| Events in quadrant A | 1,167,817 | 195,443 |
| Events in quadrant B | 1,025,440 | 197,298 |
| Events in quadrant C | 984,257 | 188,542 |
| Events in quadrant D | 2,512,048 | 170,868 |
| Mode SS | |||
|---|---|---|---|
| Quadrant | BADHDUFLAG | Total packets | Discarded packets |
| A | 0 | 36 | 0 |
| B | 0 | 36 | 0 |
| C | 0 | 36 | 0 |
| D | 0 | 36 | 0 |
| Mode M0 | |||
|---|---|---|---|
| Quadrant | BADHDUFLAG | Total packets | Discarded packets |
| A | 0 | 4765 | 2 |
| B | 0 | 4165 | 1 |
| C | 0 | 3969 | 4 |
| D | 0 | 8713 | 1 |
| Mode M9 | |||
|---|---|---|---|
| Quadrant | BADHDUFLAG | Total packets | Discarded packets |
| A | 0 | 12 | 0 |
| B | 0 | 12 | 0 |
| C | 0 | 12 | 0 |
| D | 0 | 12 | 0 |
| Quadrant | Total seconds | Saturated seconds | Saturation percentage |
|---|---|---|---|
| A | 1746 | 88 | 5.040092% |
| B | 1746 | 71 | 4.066438% |
| C | 1745 | 58 | 3.323782% |
| D | 1746 | 676 | 38.717068% |
Noise dominated data is calculated using 1-second bins in cleaned event files. If a bin has >2000 counts, and if more than 50% of those come from <1% of pixels, then it is considered to be noise-dominated and hence unusable.
| Quadrant | # 1 sec bins | Bins with >0 counts | Bins with >2000 counts | High rate bins dominated by noise | Noise dominated (total time) | Noise dominated (detector-on time) | Marked lightcurve |
|---|---|---|---|---|---|---|---|
| A | 3036 | 1746 | 1 | 1 | 0.03% | 0.06% | 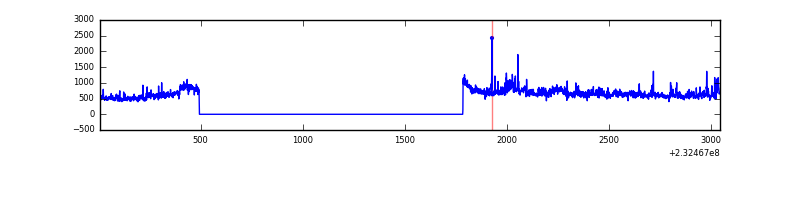 |
| B | 3036 | 1746 | 1 | 1 | 0.03% | 0.06% | 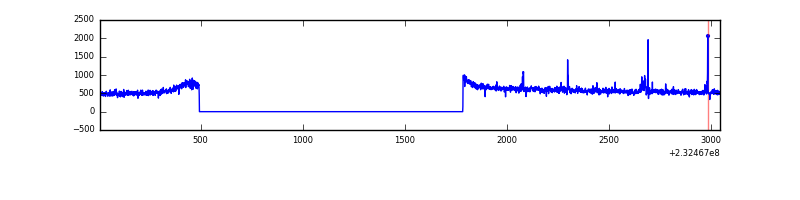 |
| C | 3036 | 1746 | 0 | 0 | 0.00% | 0.00% | 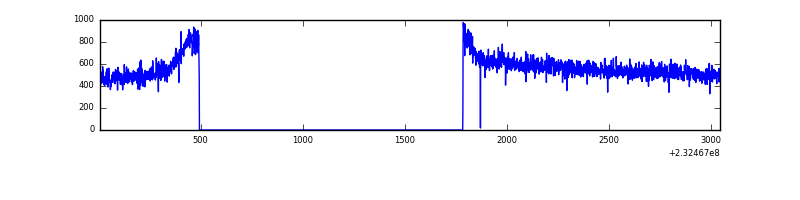 |
| D | 3036 | 1746 | 470 | 470 | 15.48% | 26.92% |  |
Top three noisy pixels from each quadrant. If the there are fewer than three noisy pixels in the level2.evt file, extra rows are filled as -1
| Pixel properties | Quadrant properties | ||||||
|---|---|---|---|---|---|---|---|
| Quadrant | DetID | PixID | Counts | Sigma | Mean | Median | Sigma |
| A | 8 | 5 | 145927 | 2633.55 | 264 | 258 | 55.3 |
| A | 13 | 14 | 3332 | 55.57 | 264 | 258 | 55.3 |
| A | 0 | 226 | 2457 | 39.76 | 264 | 258 | 55.3 |
| B | 4 | 48 | 16633 | 321.5 | 259 | 253 | 50.9 |
| B | 12 | 111 | 5324 | 99.53 | 259 | 253 | 50.9 |
| B | 11 | 111 | 4678 | 86.85 | 259 | 253 | 50.9 |
| C | 13 | 61 | 1892 | 27.49 | 252 | 253 | 59.6 |
| C | 8 | 222 | 708 | 7.63 | 252 | 253 | 59.6 |
| C | 1 | 3 | 666 | 6.93 | 252 | 253 | 59.6 |
| D | 2 | 16 | 1545803 | 26813.98 | 219 | 213 | 57.6 |
| D | 1 | 52 | 69653 | 1204.69 | 219 | 213 | 57.6 |
| D | 2 | 152 | 37019 | 638.54 | 219 | 213 | 57.6 |
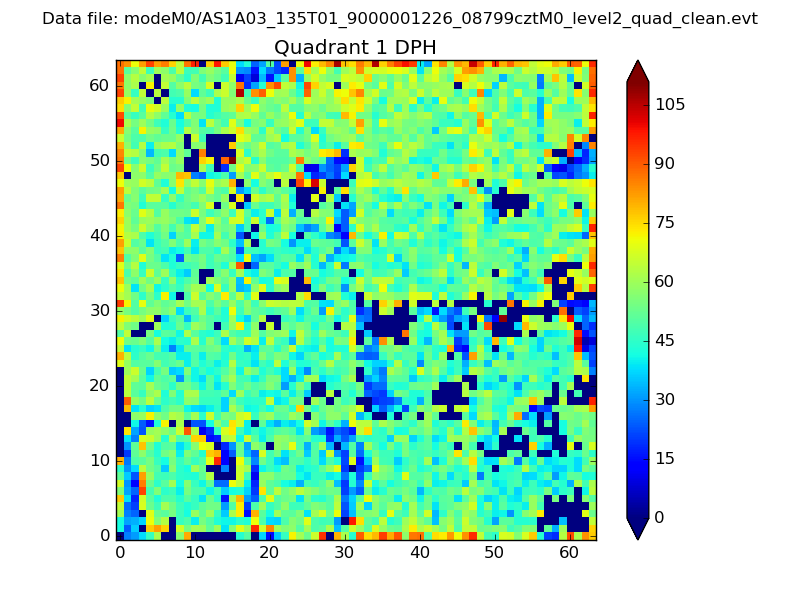
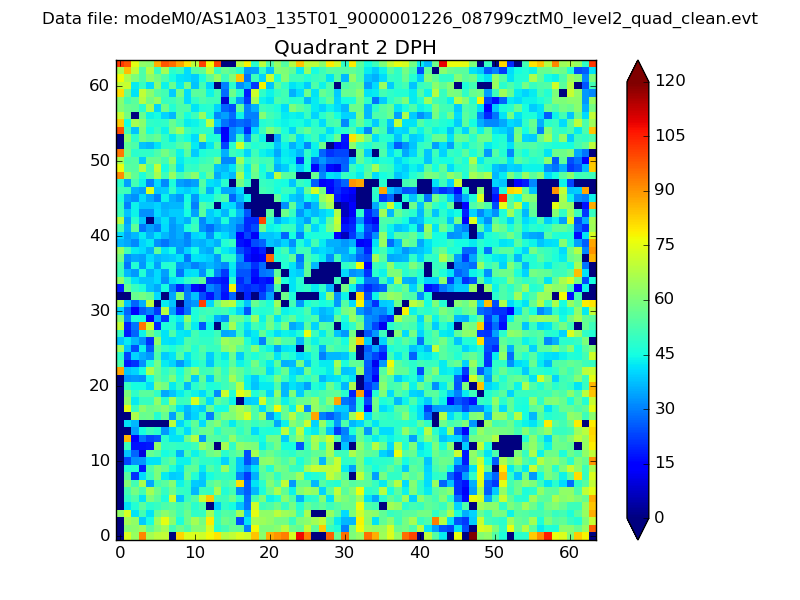
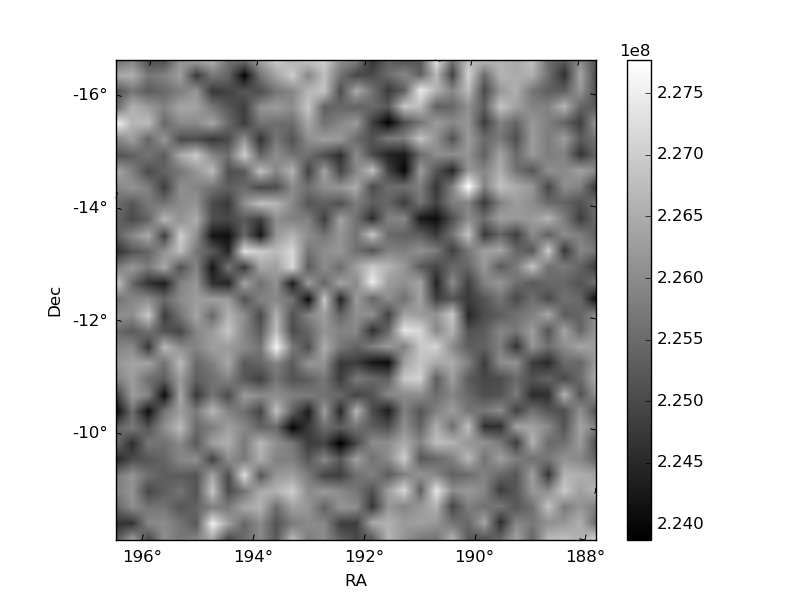
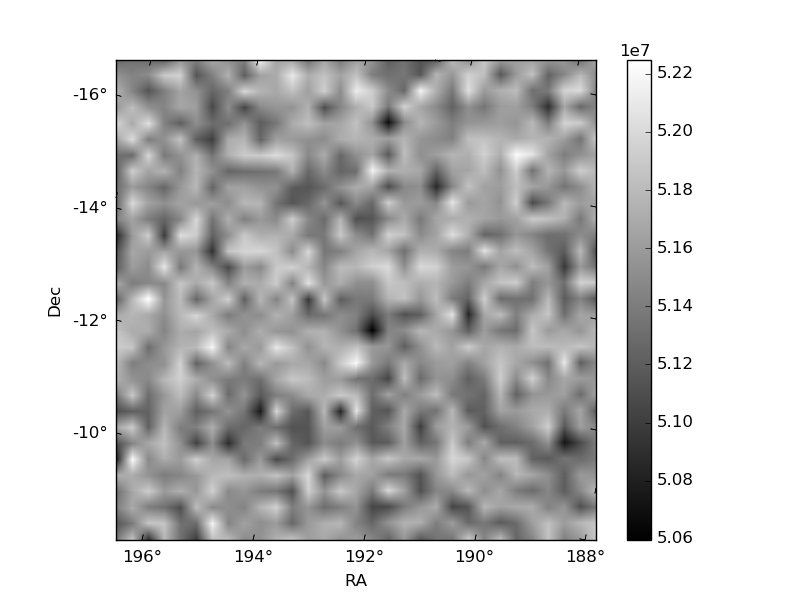
Histogram calculated using DETX and DETY for each event in the final _common_clean file
| Quadrant A | 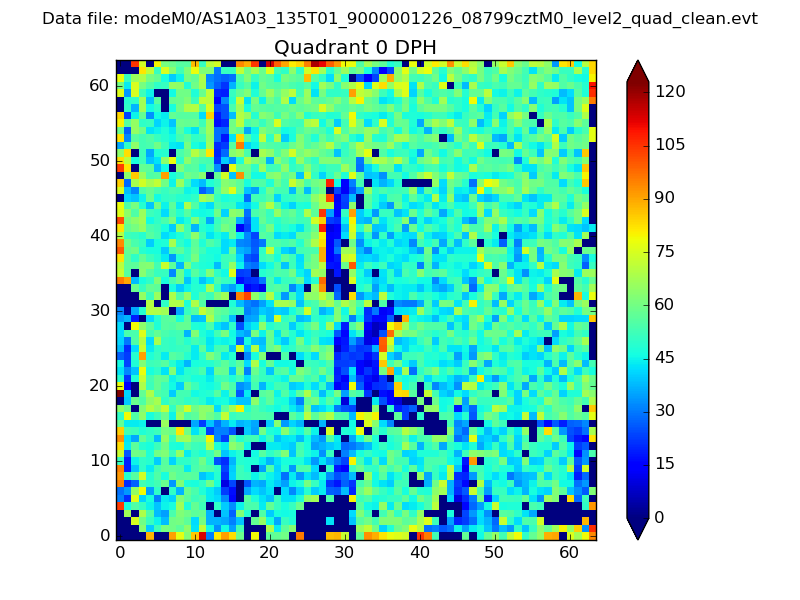 |
 |
Quadrant B |
|---|---|---|---|
| Quadrant D | 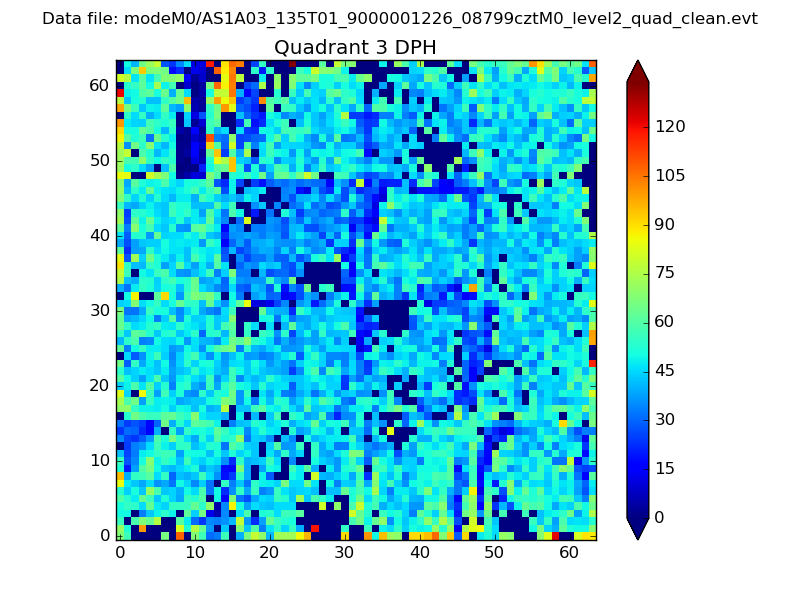 |
 |
Quadrant C |
| Plot type | Count rate plots | Images |
|---|---|---|
| Comparison with Poisson distribution Blue bars denote a histogram of data divided into 1 sec bins. Red curve is a Poisson curve with rate = median count rate of data. |
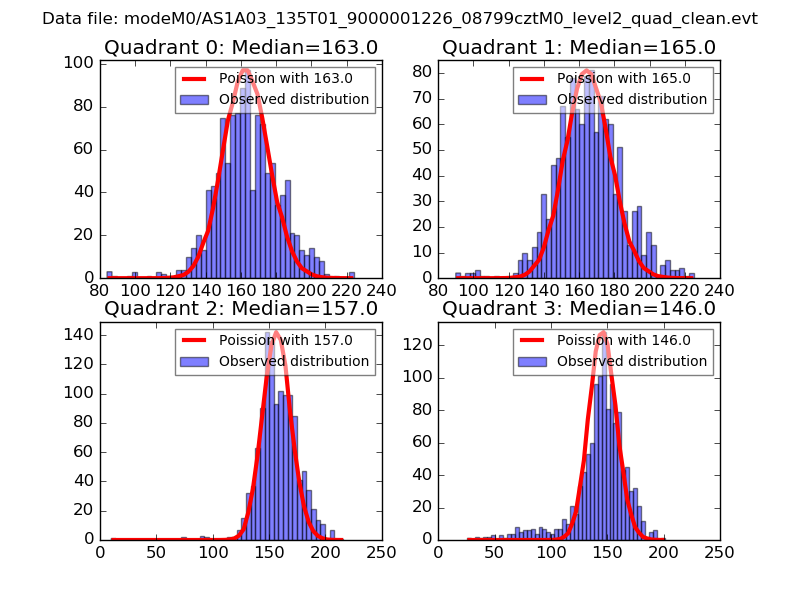 |
 |
| Quadrant-wise count rates Data is divided into 100 sec bins |
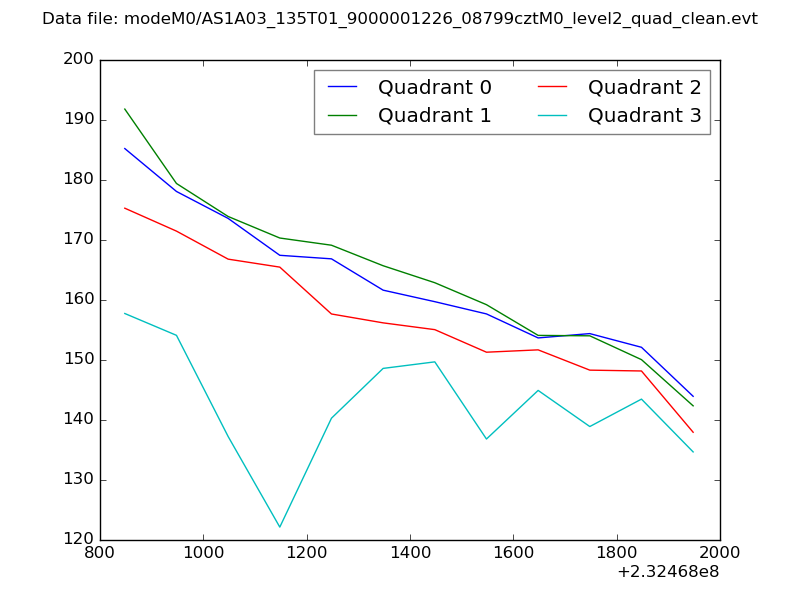 |
|
| Module-wise count rates for Quadrant A Data is divided into 100 sec bins |
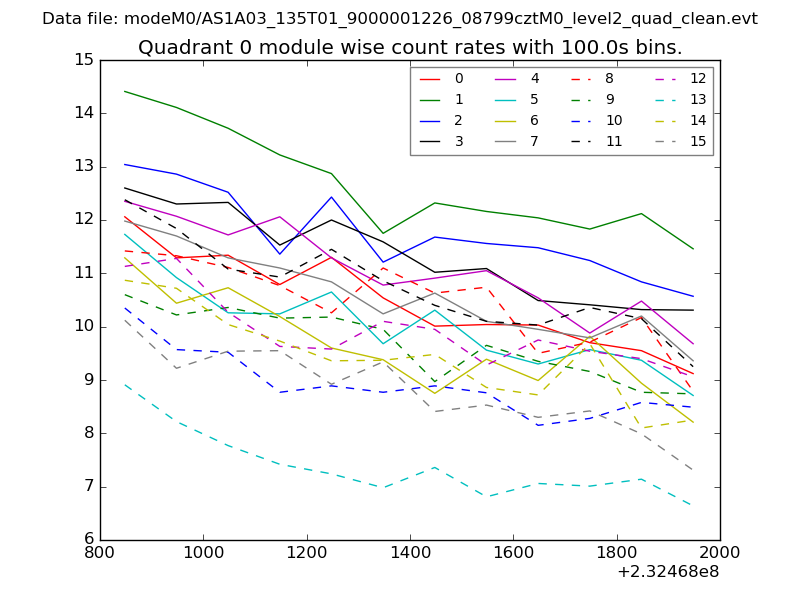 |
 |
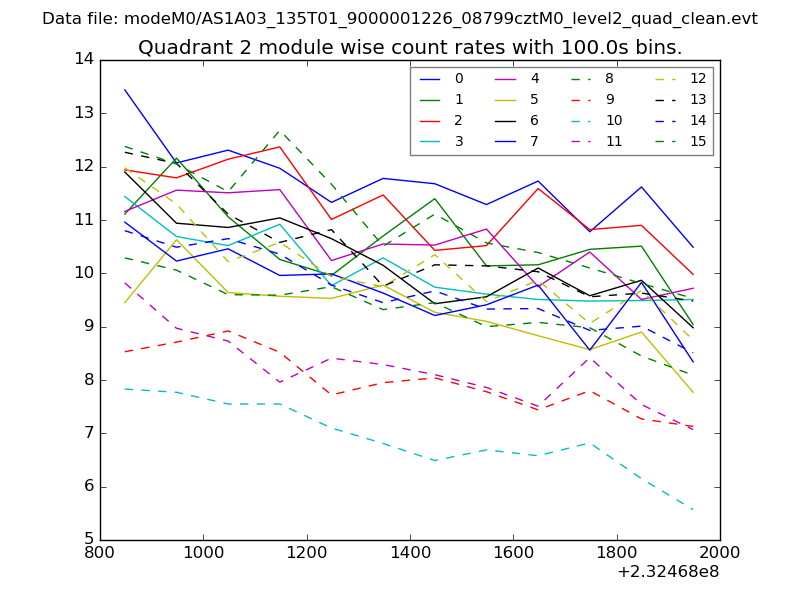
| Module-wise count rates for Quadrant B Data is divided into 100 sec bins |
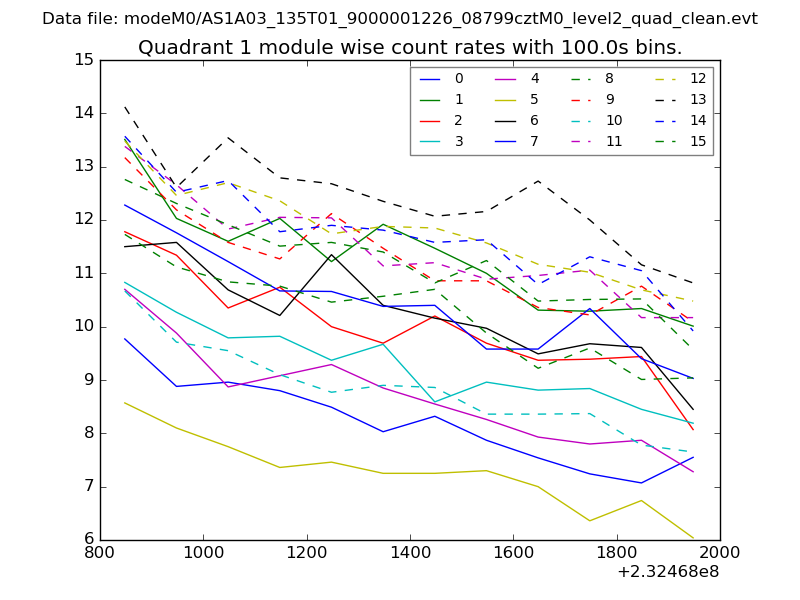 |
 |
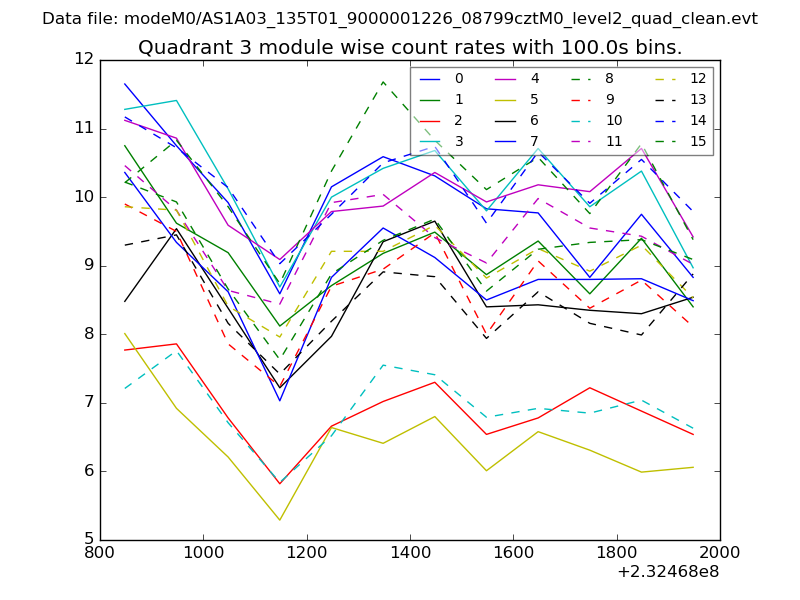
| Module-wise count rates for Quadrant C Data is divided into 100 sec bins |
 |
 |
| Module-wise count rates for Quadrant D Data is divided into 100 sec bins |
 |
 |
| Parameter | Plot |
|---|---|
| CZT HV Monitor | 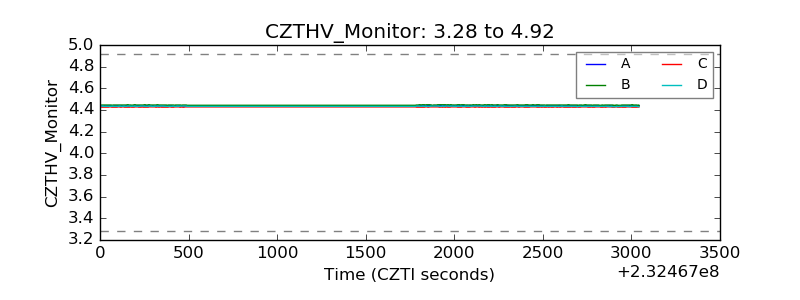 |
| D_VDD | 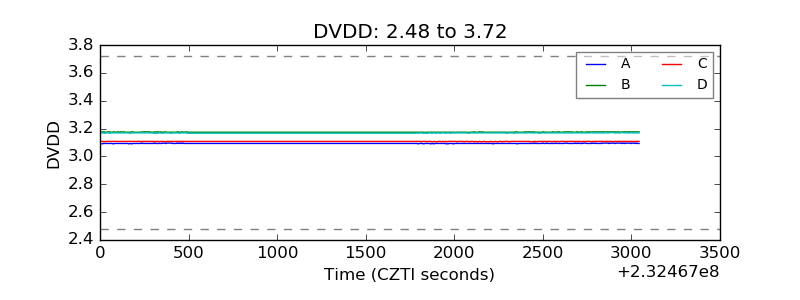 |
| Temperature 1 | 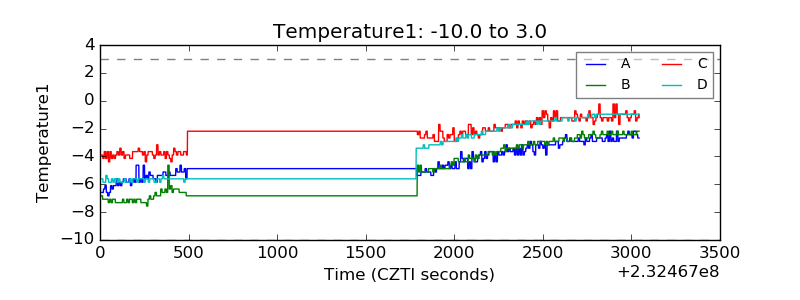 |
| Veto HV Monitor | 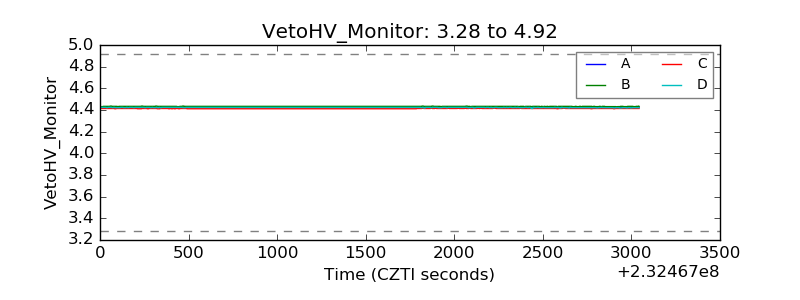 |
| Veto LLD | 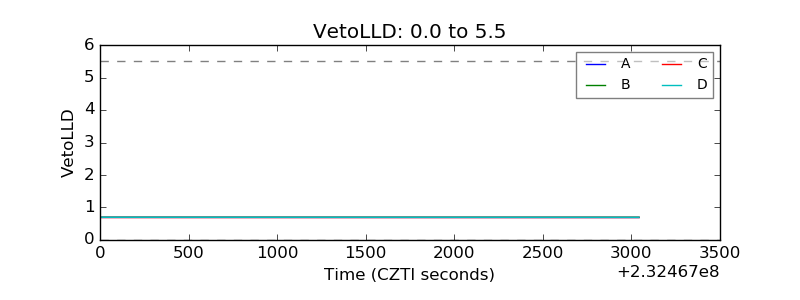 |
| Alpha Counter | 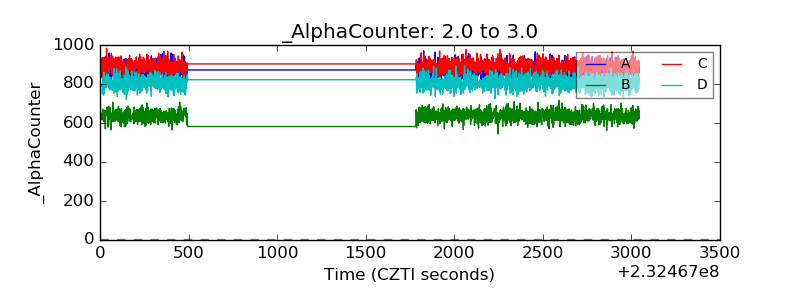 |
| _CPM_Rate | 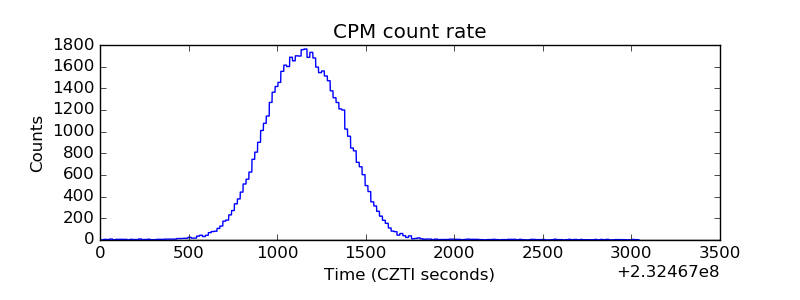 |
| CZT Counter | 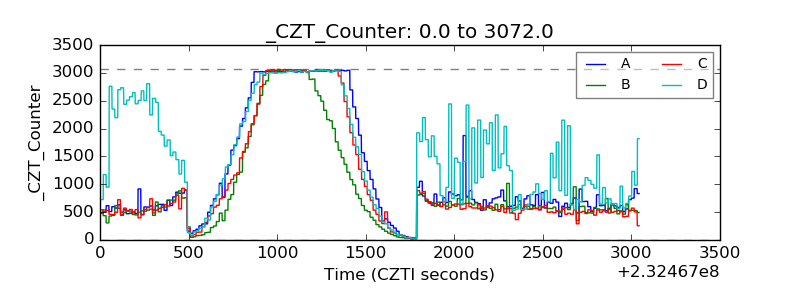 |
| +2.5 Volts monitor |  |
| +5 Volts monitor |  |
| _ROLL_ROT | 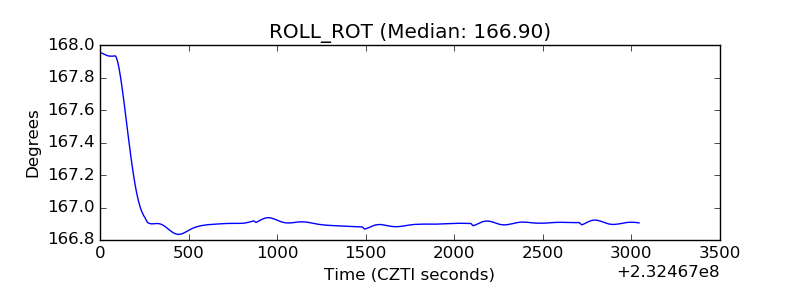 |
| _Roll_DEC | 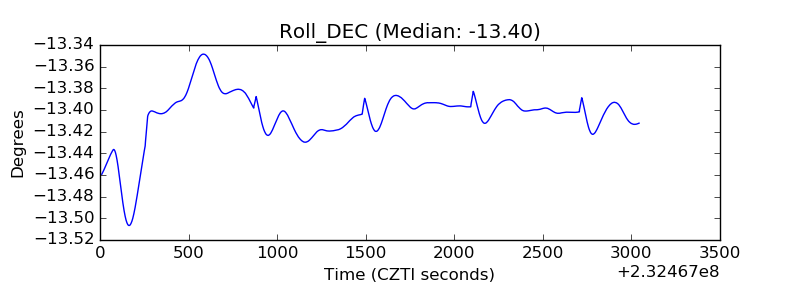 |
| _Roll_RA | 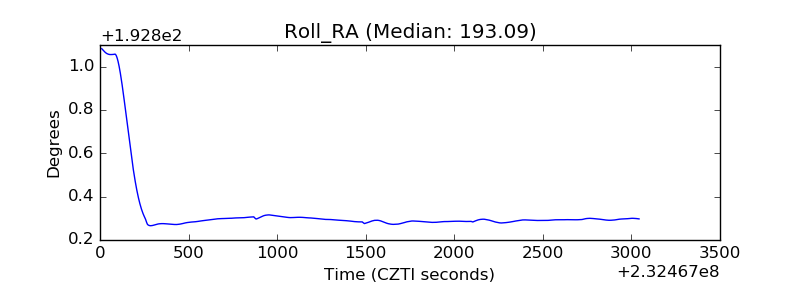 |
| Veto Counter | 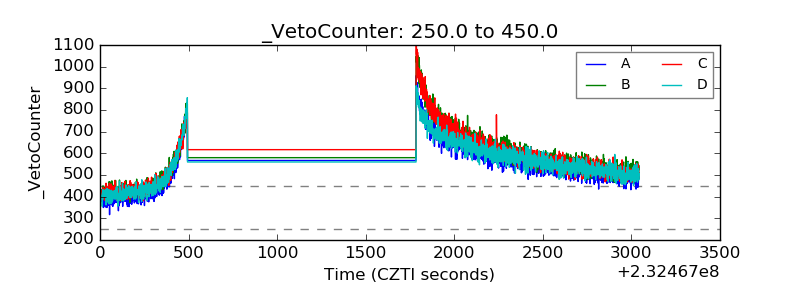 |