| Param | Original file | Final file |
|---|---|---|
| Filename | modeM0/AS1A03_135T01_9000001226_08800cztM0_level2.evt | modeM0/AS1A03_135T01_9000001226_08800cztM0_level2_quad_clean.evt |
| Size (bytes) | 586,540,800 | 111,646,080 |
| Size | 559.4 MB | 106.5 MB |
| Events in quadrant A | 3,719,660 | 761,133 |
| Events in quadrant B | 3,473,468 | 755,039 |
| Events in quadrant C | 3,177,132 | 734,173 |
| Events in quadrant D | 6,956,345 | 680,908 |
| Mode SS | |||
|---|---|---|---|
| Quadrant | BADHDUFLAG | Total packets | Discarded packets |
| A | 0 | 130 | 0 |
| B | 0 | 130 | 0 |
| C | 0 | 130 | 0 |
| D | 0 | 130 | 0 |
| Mode M0 | |||
|---|---|---|---|
| Quadrant | BADHDUFLAG | Total packets | Discarded packets |
| A | 0 | 15331 | 2 |
| B | 0 | 14369 | 1 |
| C | 0 | 13554 | 1 |
| D | 0 | 25319 | 1 |
| Mode M9 | |||
|---|---|---|---|
| Quadrant | BADHDUFLAG | Total packets | Discarded packets |
| A | 0 | 13 | 0 |
| B | 0 | 13 | 0 |
| C | 0 | 13 | 0 |
| D | 0 | 13 | 0 |
| Quadrant | Total seconds | Saturated seconds | Saturation percentage |
|---|---|---|---|
| A | 6452 | 146 | 2.262864% |
| B | 6452 | 174 | 2.696838% |
| C | 6452 | 94 | 1.456913% |
| D | 6452 | 881 | 13.654681% |
Noise dominated data is calculated using 1-second bins in cleaned event files. If a bin has >2000 counts, and if more than 50% of those come from <1% of pixels, then it is considered to be noise-dominated and hence unusable.
| Quadrant | # 1 sec bins | Bins with >0 counts | Bins with >2000 counts | High rate bins dominated by noise | Noise dominated (total time) | Noise dominated (detector-on time) | Marked lightcurve |
|---|---|---|---|---|---|---|---|
| A | 7747 | 6452 | 11 | 11 | 0.14% | 0.17% | 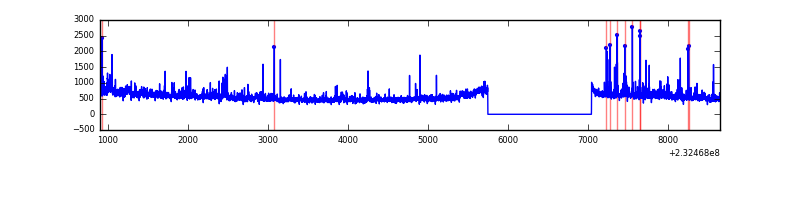 |
| B | 7747 | 6452 | 41 | 41 | 0.53% | 0.64% | 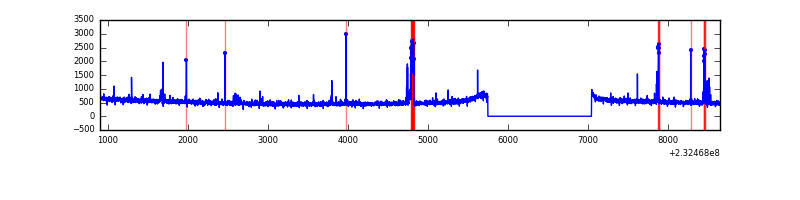 |
| C | 7747 | 6452 | 0 | 0 | 0.00% | 0.00% | 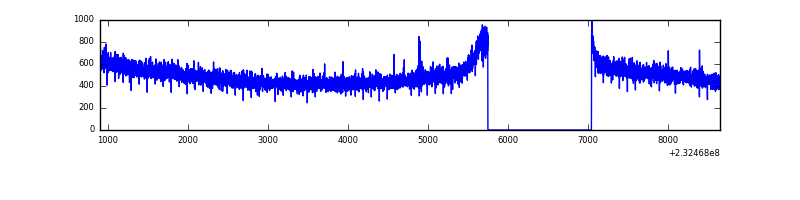 |
| D | 7747 | 6452 | 672 | 672 | 8.67% | 10.42% | 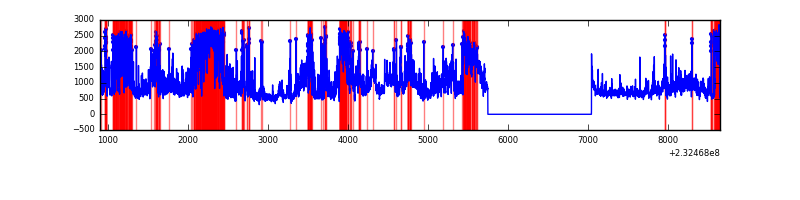 |
Top three noisy pixels from each quadrant. If the there are fewer than three noisy pixels in the level2.evt file, extra rows are filled as -1
| Pixel properties | Quadrant properties | ||||||
|---|---|---|---|---|---|---|---|
| Quadrant | DetID | PixID | Counts | Sigma | Mean | Median | Sigma |
| A | 8 | 5 | 397686 | 2306.28 | 855 | 842 | 172.1 |
| A | 13 | 251 | 10766 | 57.67 | 855 | 842 | 172.1 |
| A | 13 | 14 | 9830 | 52.23 | 855 | 842 | 172.1 |
| B | 5 | 255 | 99032 | 618.77 | 841 | 822 | 158.7 |
| B | 0 | 213 | 44903 | 277.73 | 841 | 822 | 158.7 |
| B | 4 | 80 | 26347 | 160.82 | 841 | 822 | 158.7 |
| C | 1 | 16 | 6943 | 32.74 | 812 | 816 | 187.1 |
| C | 13 | 61 | 6127 | 28.38 | 812 | 816 | 187.1 |
| C | 8 | 222 | 2583 | 9.44 | 812 | 816 | 187.1 |
| D | 2 | 16 | 3154916 | 16650.13 | 788 | 772 | 189.4 |
| D | 2 | 152 | 477118 | 2514.54 | 788 | 772 | 189.4 |
| D | 1 | 52 | 203387 | 1069.57 | 788 | 772 | 189.4 |
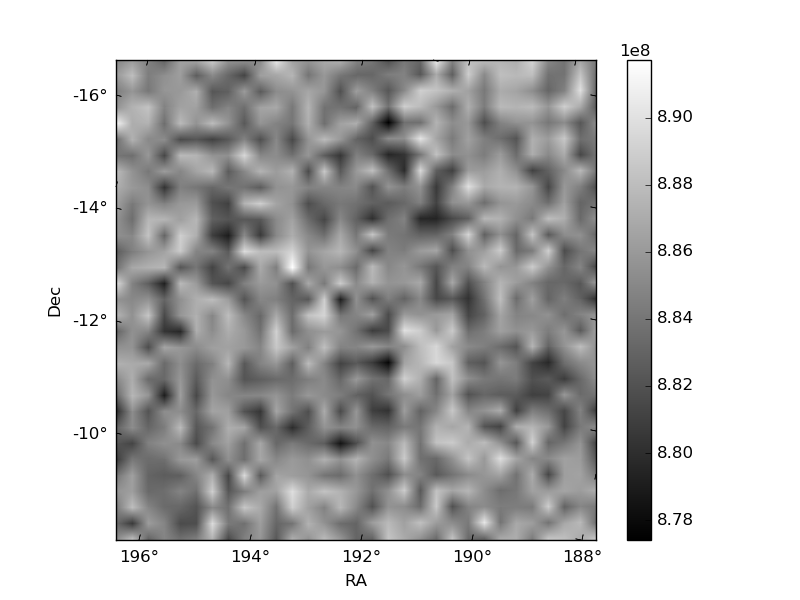
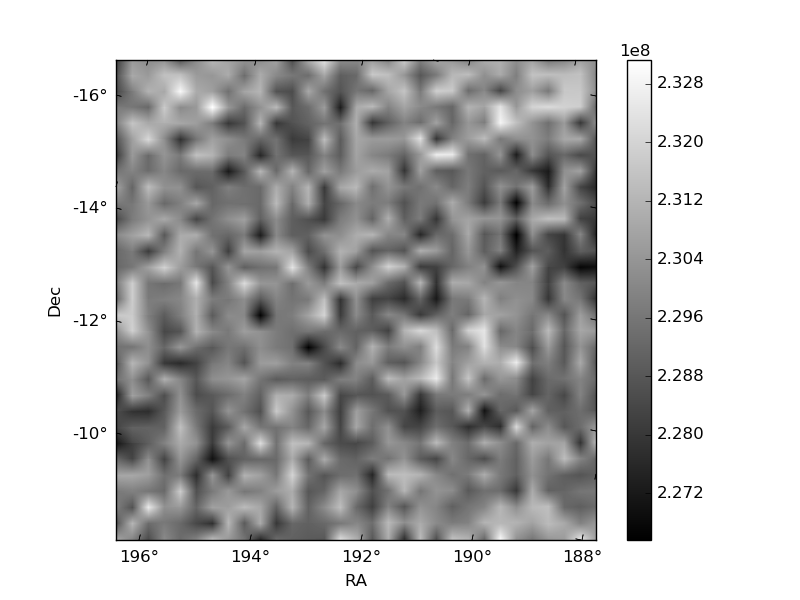
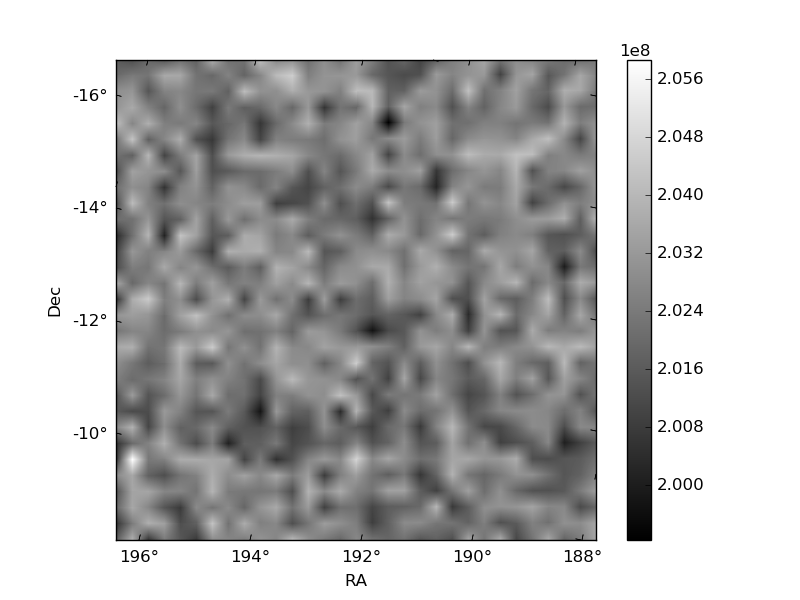
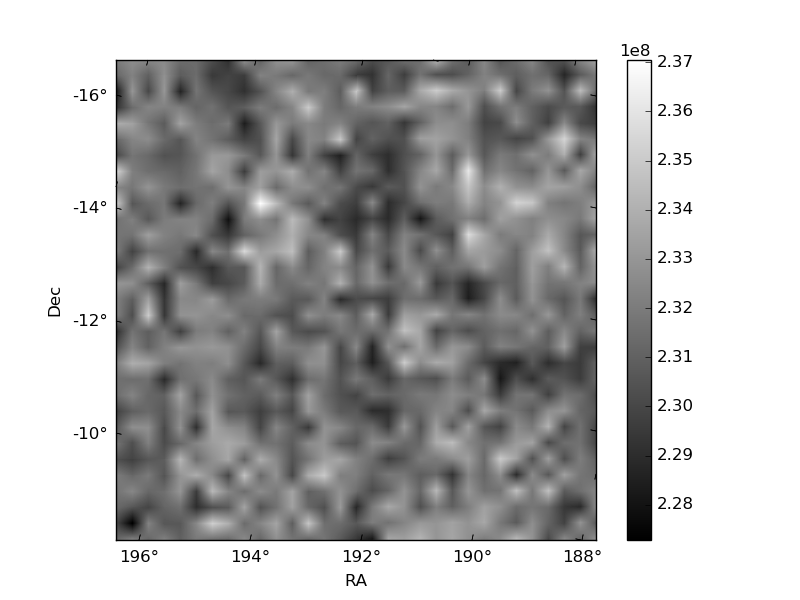
Histogram calculated using DETX and DETY for each event in the final _common_clean file
| Quadrant A | 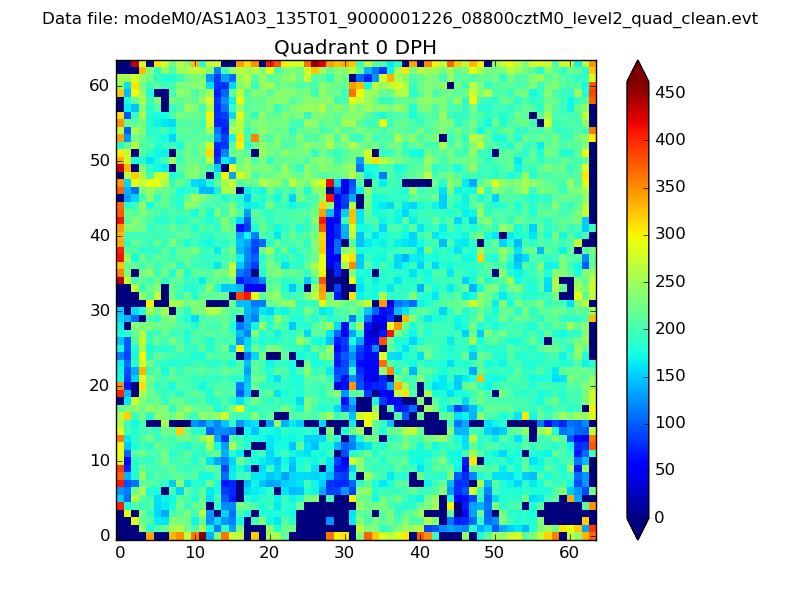 |
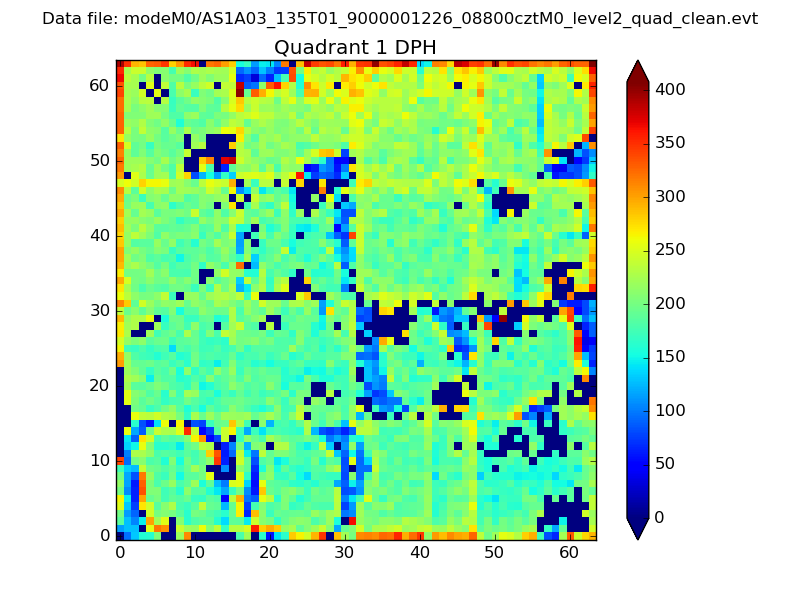 |
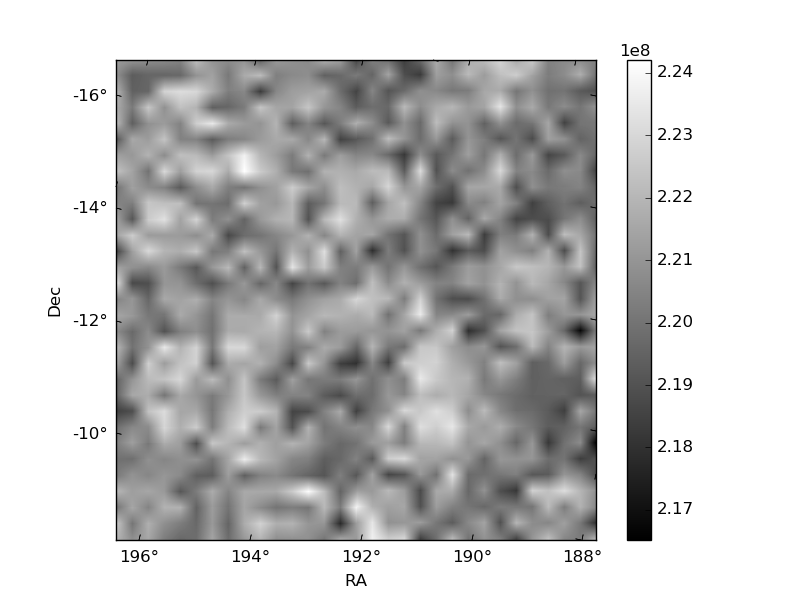
Quadrant B |
|---|---|---|---|
| Quadrant D | 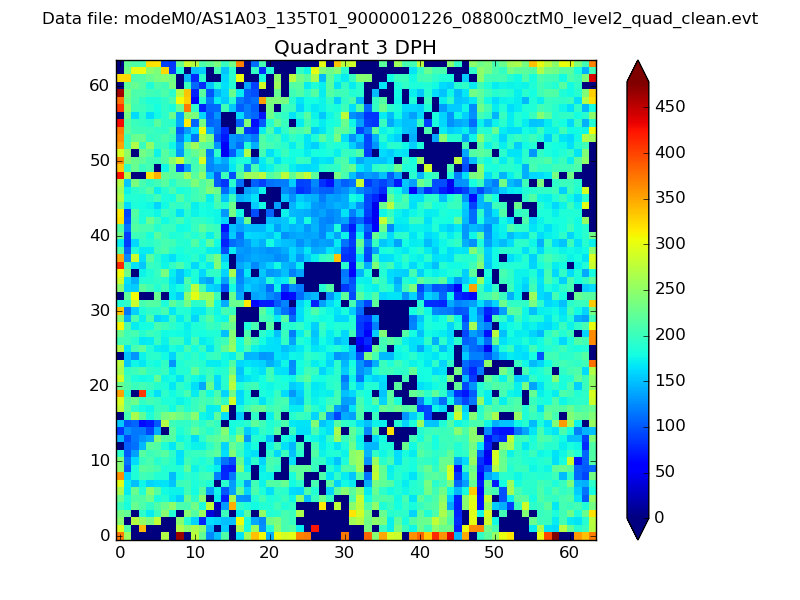 |
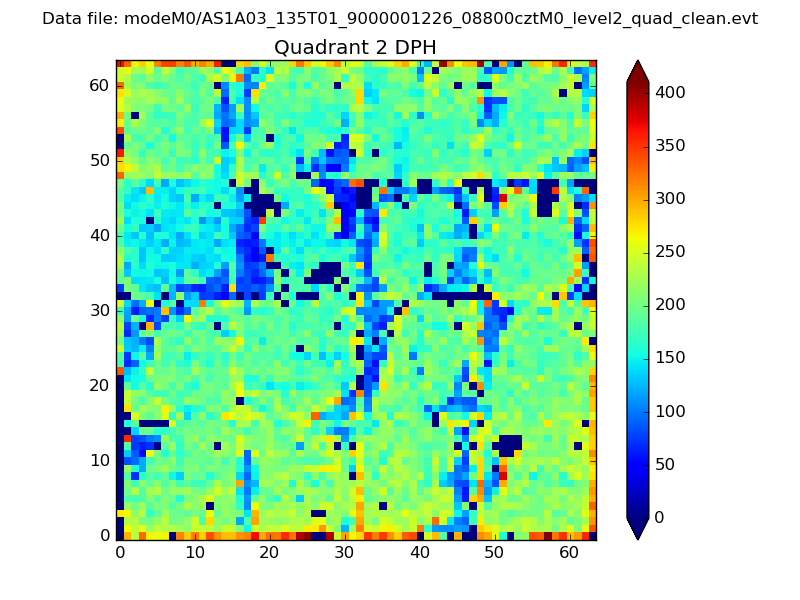 |
Quadrant C |
| Plot type | Count rate plots | Images |
|---|---|---|
| Comparison with Poisson distribution Blue bars denote a histogram of data divided into 1 sec bins. Red curve is a Poisson curve with rate = median count rate of data. |
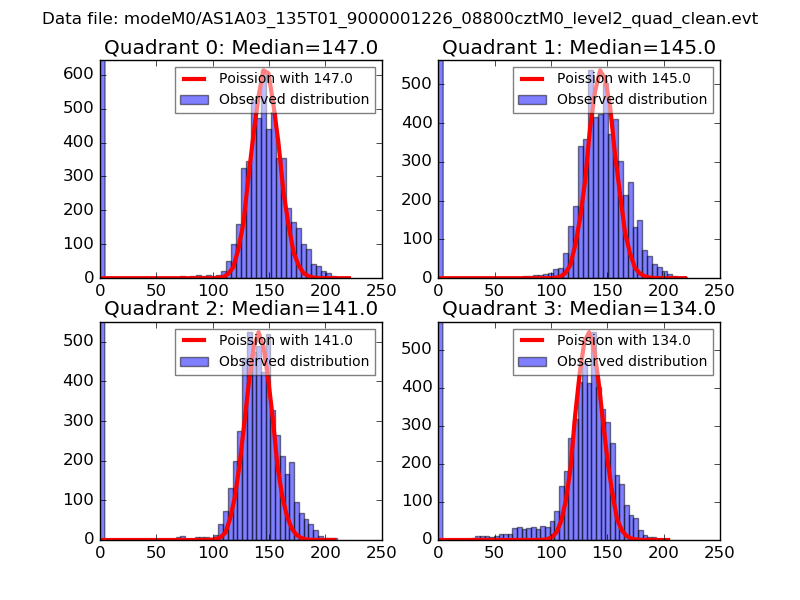 |
 |
| Quadrant-wise count rates Data is divided into 100 sec bins |
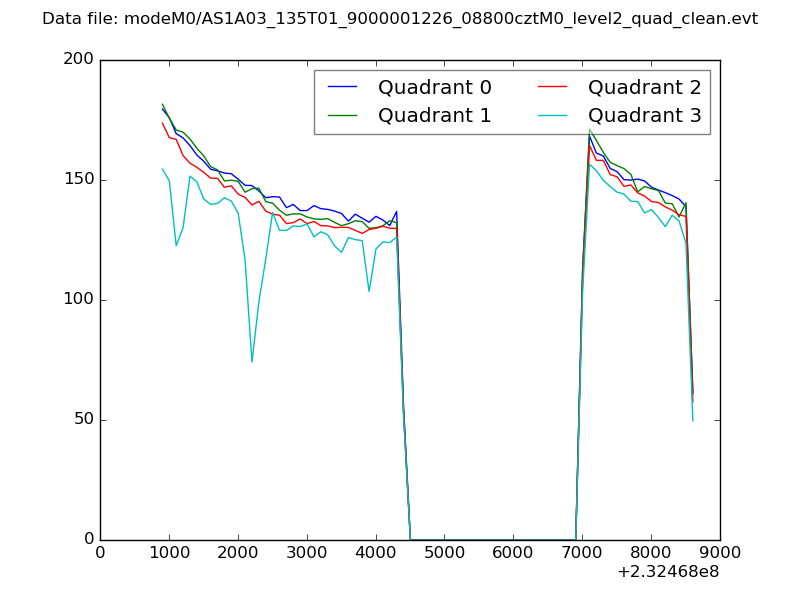 |
|
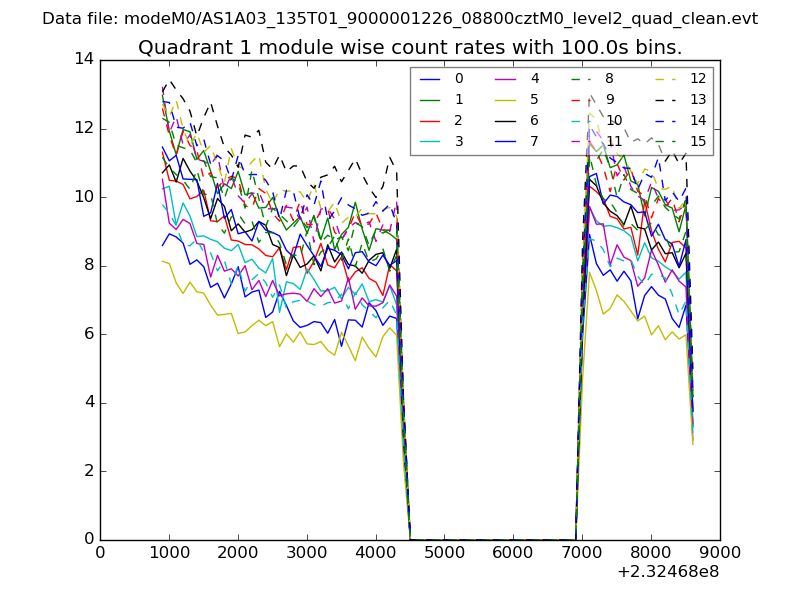
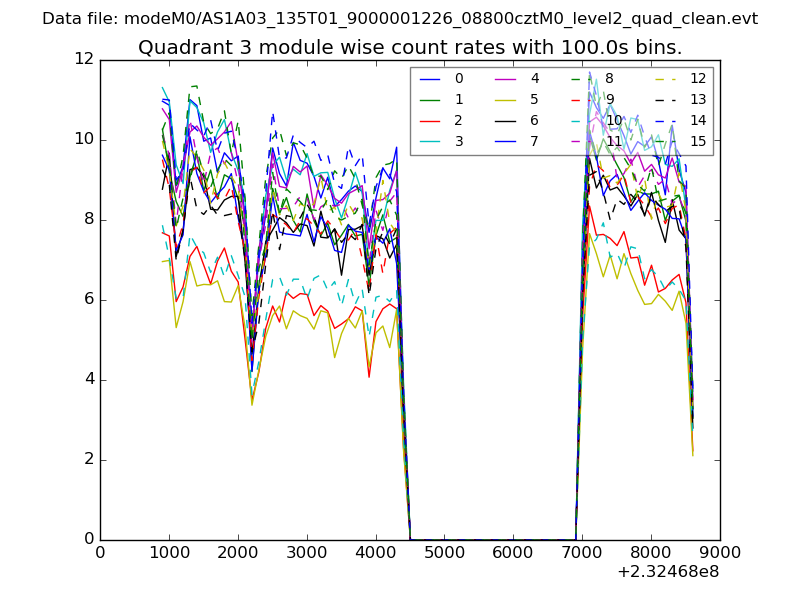
| Module-wise count rates for Quadrant A Data is divided into 100 sec bins |
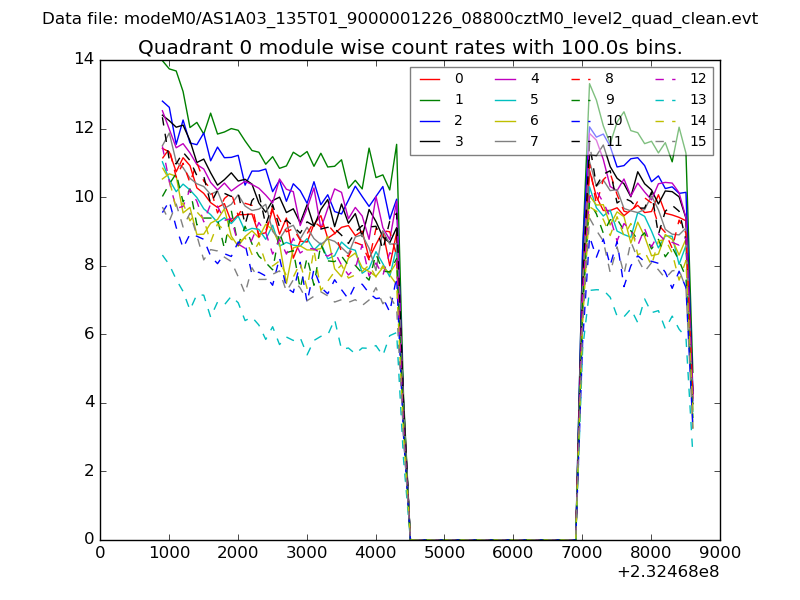 |
 |
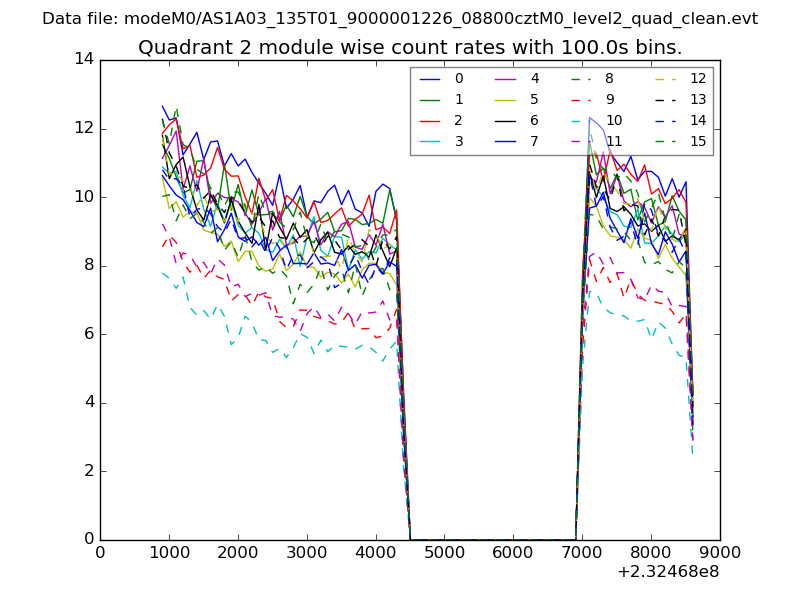
| Module-wise count rates for Quadrant B Data is divided into 100 sec bins |
 |
 |
| Module-wise count rates for Quadrant C Data is divided into 100 sec bins |
 |
 |
| Module-wise count rates for Quadrant D Data is divided into 100 sec bins |
 |
 |
| Parameter | Plot |
|---|---|
| CZT HV Monitor | 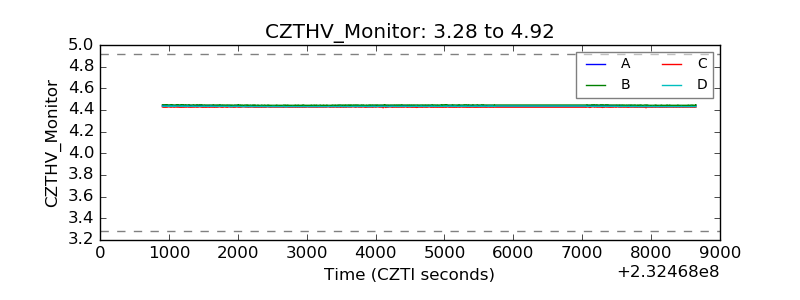 |
| D_VDD | 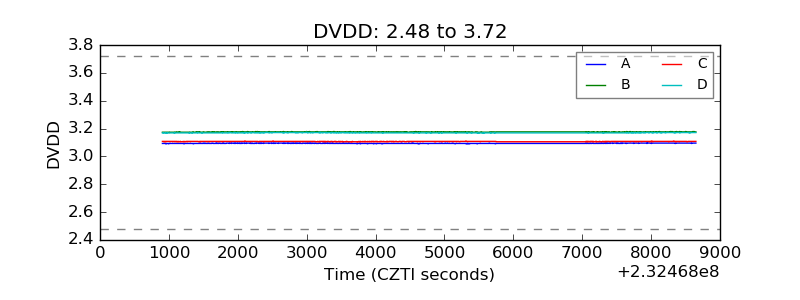 |
| Temperature 1 | 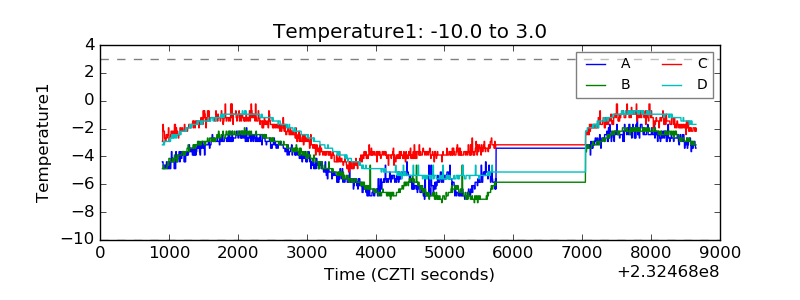 |
| Veto HV Monitor | 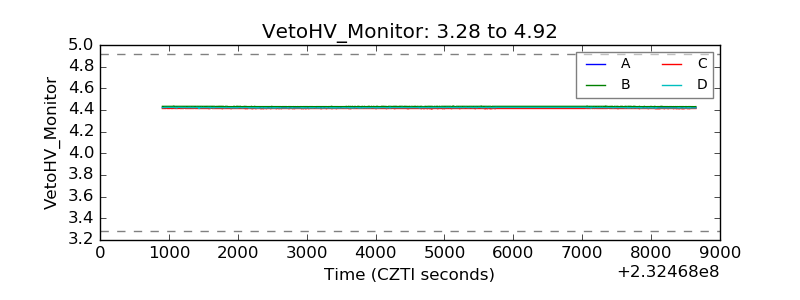 |
| Veto LLD | 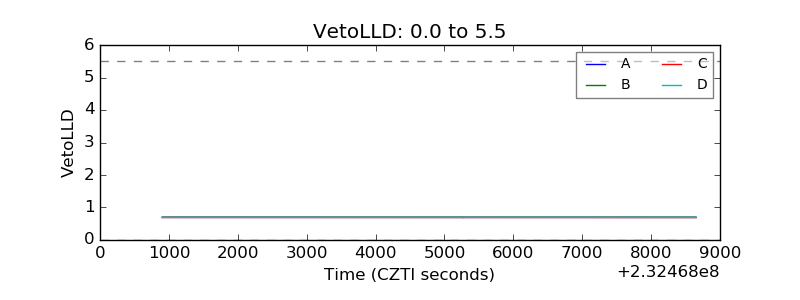 |
| Alpha Counter | 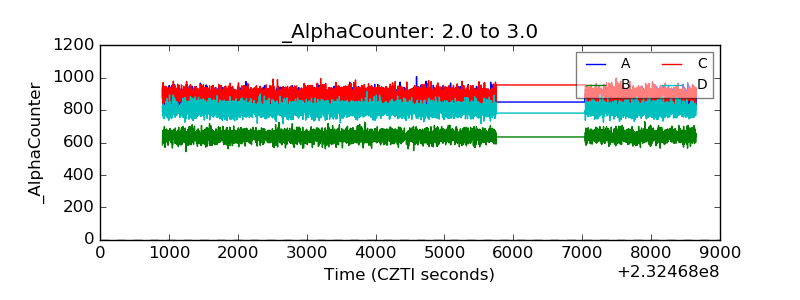 |
| _CPM_Rate | 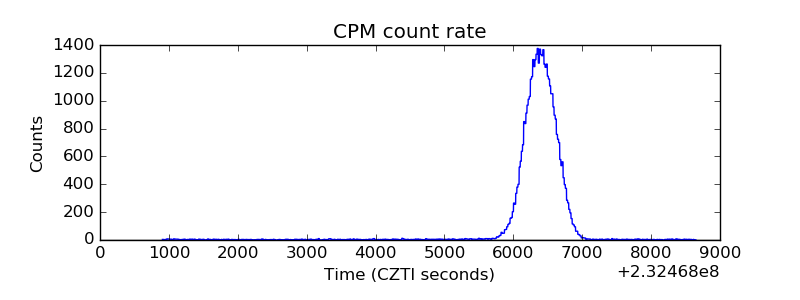 |
| CZT Counter | 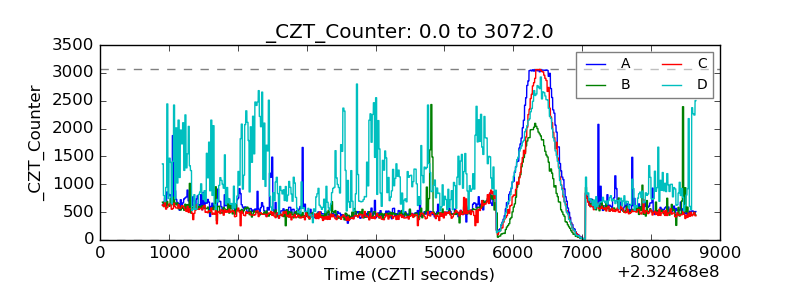 |
| +2.5 Volts monitor |  |
| +5 Volts monitor |  |
| _ROLL_ROT | 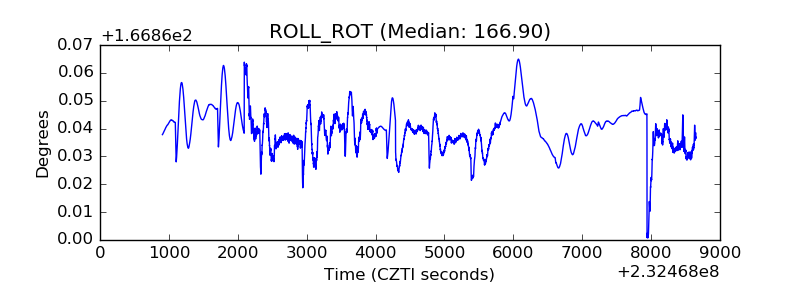 |
| _Roll_DEC | 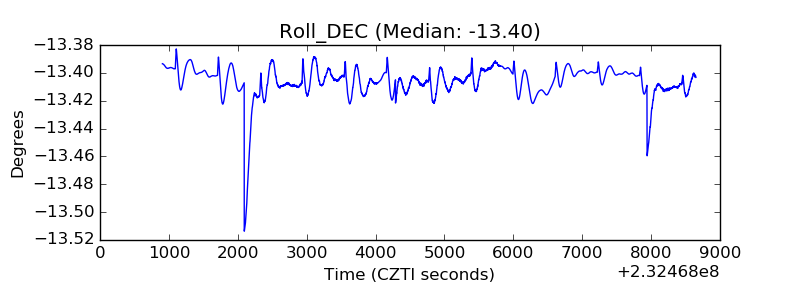 |
| _Roll_RA | 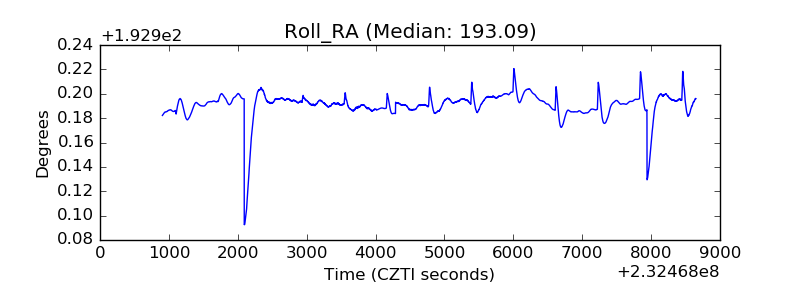 |
| Veto Counter | 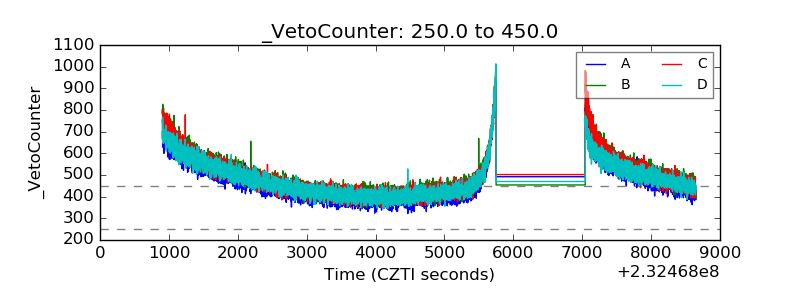 |