| Param | Original file | Final file |
|---|---|---|
| Filename | modeM0/AS1A03_135T01_9000001226_08801cztM0_level2.evt | modeM0/AS1A03_135T01_9000001226_08801cztM0_level2_quad_clean.evt |
| Size (bytes) | 518,970,240 | 93,461,760 |
| Size | 494.9 MB | 89.1 MB |
| Events in quadrant A | 3,782,928 | 613,691 |
| Events in quadrant B | 3,187,602 | 615,651 |
| Events in quadrant C | 2,929,787 | 597,970 |
| Events in quadrant D | 5,398,067 | 571,960 |
| Mode SS | |||
|---|---|---|---|
| Quadrant | BADHDUFLAG | Total packets | Discarded packets |
| A | 0 | 126 | 0 |
| B | 0 | 126 | 0 |
| C | 0 | 126 | 0 |
| D | 0 | 126 | 0 |
| Mode M0 | |||
|---|---|---|---|
| Quadrant | BADHDUFLAG | Total packets | Discarded packets |
| A | 0 | 15253 | 2 |
| B | 0 | 13361 | 1 |
| C | 0 | 12803 | 1 |
| D | 0 | 20397 | 1 |
| Mode M9 | |||
|---|---|---|---|
| Quadrant | BADHDUFLAG | Total packets | Discarded packets |
| A | 0 | 12 | 0 |
| B | 0 | 12 | 0 |
| C | 0 | 12 | 0 |
| D | 0 | 12 | 0 |
| Quadrant | Total seconds | Saturated seconds | Saturation percentage |
|---|---|---|---|
| A | 6174 | 195 | 3.158406% |
| B | 6174 | 131 | 2.121801% |
| C | 6174 | 69 | 1.117590% |
| D | 6174 | 307 | 4.972465% |
Noise dominated data is calculated using 1-second bins in cleaned event files. If a bin has >2000 counts, and if more than 50% of those come from <1% of pixels, then it is considered to be noise-dominated and hence unusable.
| Quadrant | # 1 sec bins | Bins with >0 counts | Bins with >2000 counts | High rate bins dominated by noise | Noise dominated (total time) | Noise dominated (detector-on time) | Marked lightcurve |
|---|---|---|---|---|---|---|---|
| A | 7409 | 6174 | 62 | 62 | 0.84% | 1.00% | 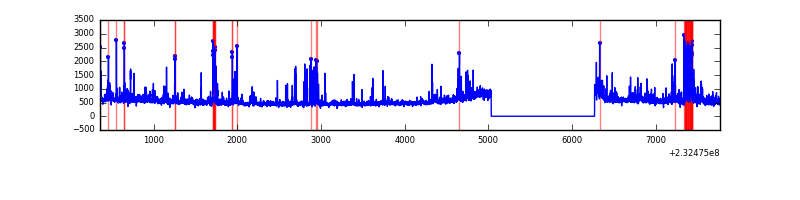 |
| B | 7409 | 6174 | 21 | 21 | 0.28% | 0.34% | 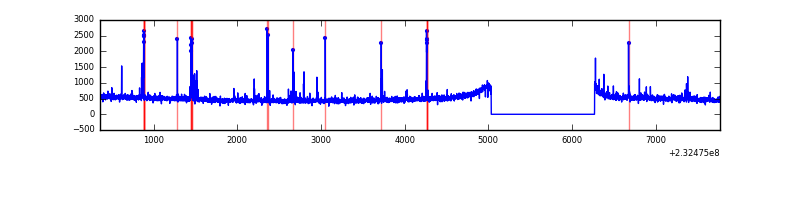 |
| C | 7409 | 6174 | 0 | 0 | 0.00% | 0.00% | 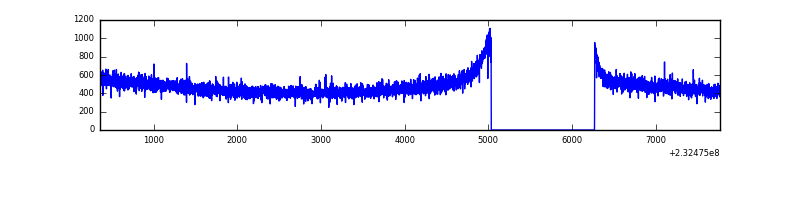 |
| D | 7409 | 6174 | 195 | 195 | 2.63% | 3.16% | 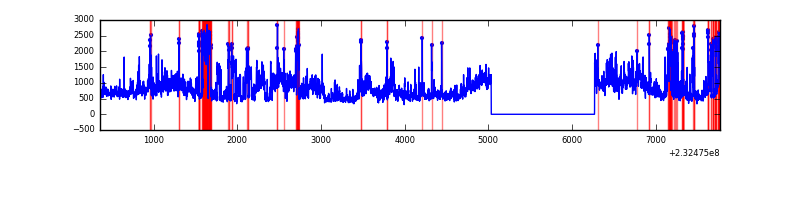 |
Top three noisy pixels from each quadrant. If the there are fewer than three noisy pixels in the level2.evt file, extra rows are filled as -1
| Pixel properties | Quadrant properties | ||||||
|---|---|---|---|---|---|---|---|
| Quadrant | DetID | PixID | Counts | Sigma | Mean | Median | Sigma |
| A | 8 | 5 | 729843 | 4552.51 | 784 | 769 | 160.1 |
| A | 15 | 174 | 12810 | 75.18 | 784 | 769 | 160.1 |
| A | 5 | 16 | 10620 | 61.51 | 784 | 769 | 160.1 |
| B | 10 | 16 | 86301 | 574.56 | 779 | 764 | 148.9 |
| B | 0 | 213 | 38943 | 256.45 | 779 | 764 | 148.9 |
| B | 4 | 80 | 25223 | 164.29 | 779 | 764 | 148.9 |
| C | 13 | 61 | 5801 | 29.2 | 749 | 754 | 172.8 |
| C | 1 | 16 | 4481 | 21.56 | 749 | 754 | 172.8 |
| C | 8 | 222 | 2404 | 9.55 | 749 | 754 | 172.8 |
| D | 2 | 16 | 2158051 | 11863.95 | 746 | 731 | 181.8 |
| D | 1 | 52 | 145509 | 796.19 | 746 | 731 | 181.8 |
| D | 2 | 152 | 84070 | 458.31 | 746 | 731 | 181.8 |
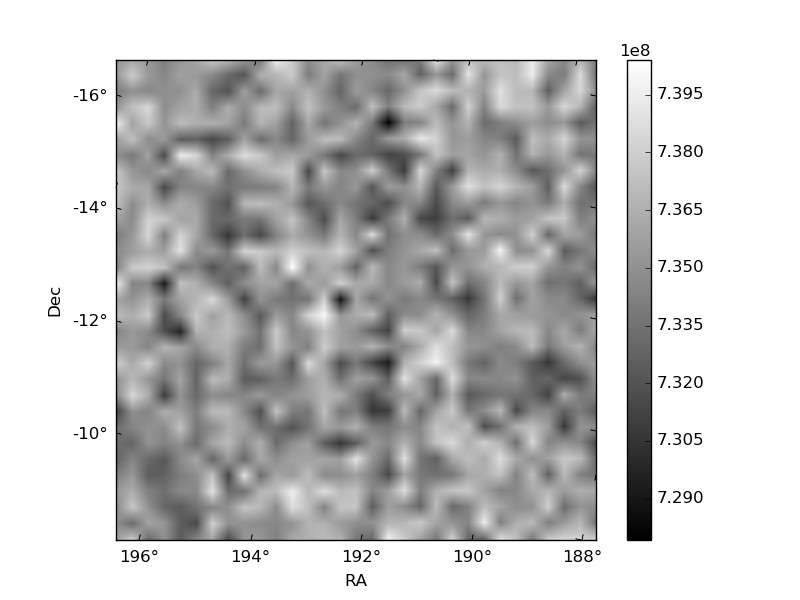
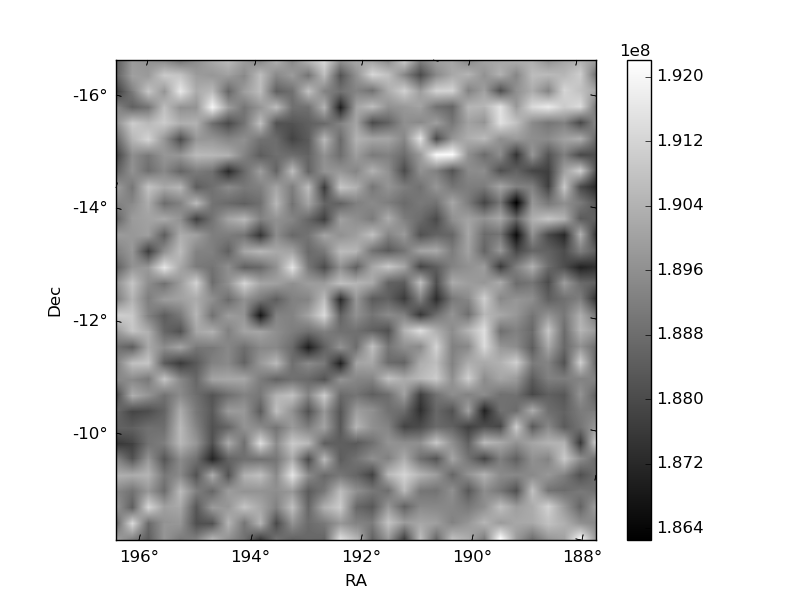
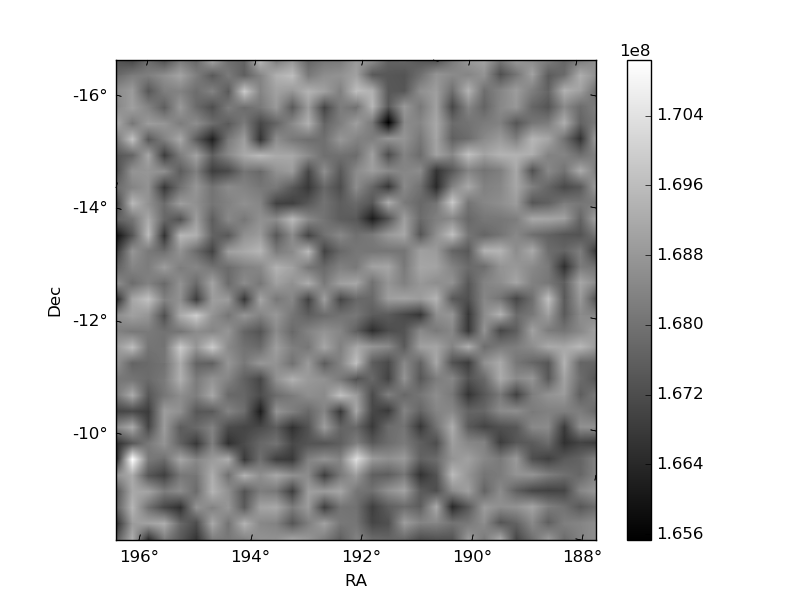
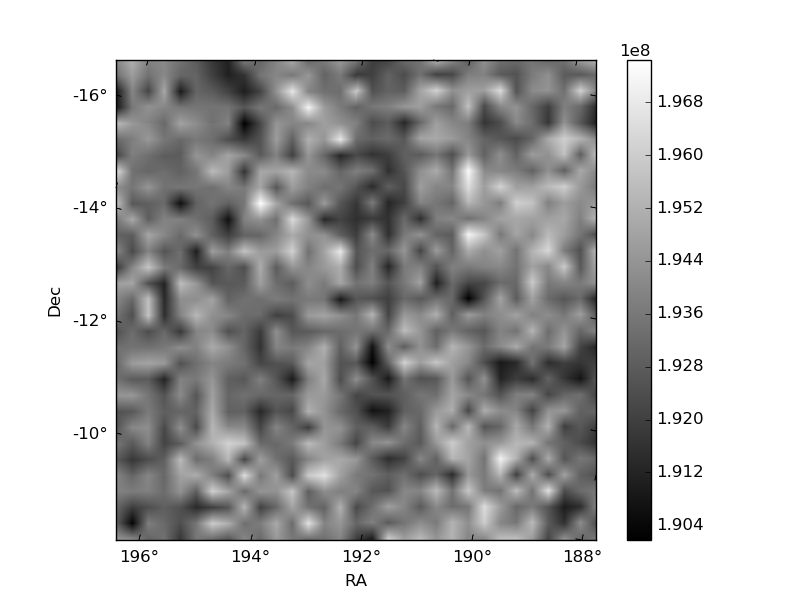
Histogram calculated using DETX and DETY for each event in the final _common_clean file
| Quadrant A | 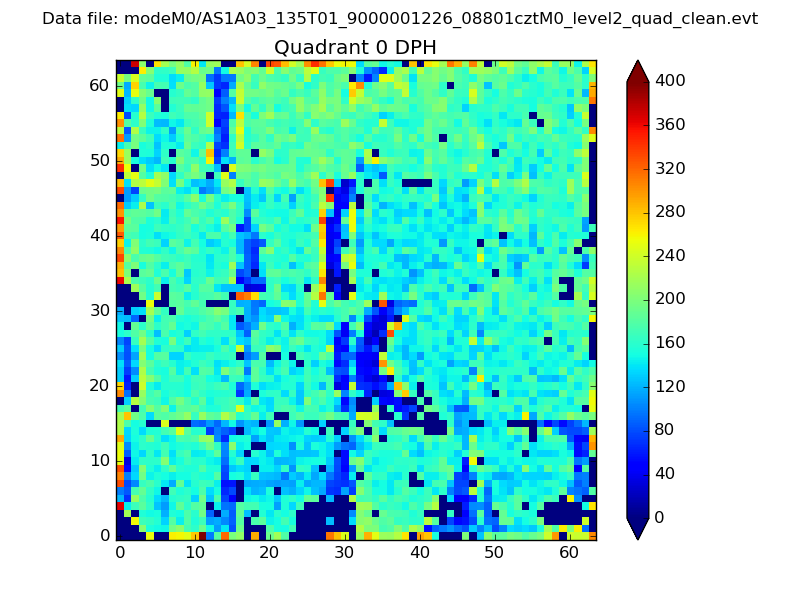 |
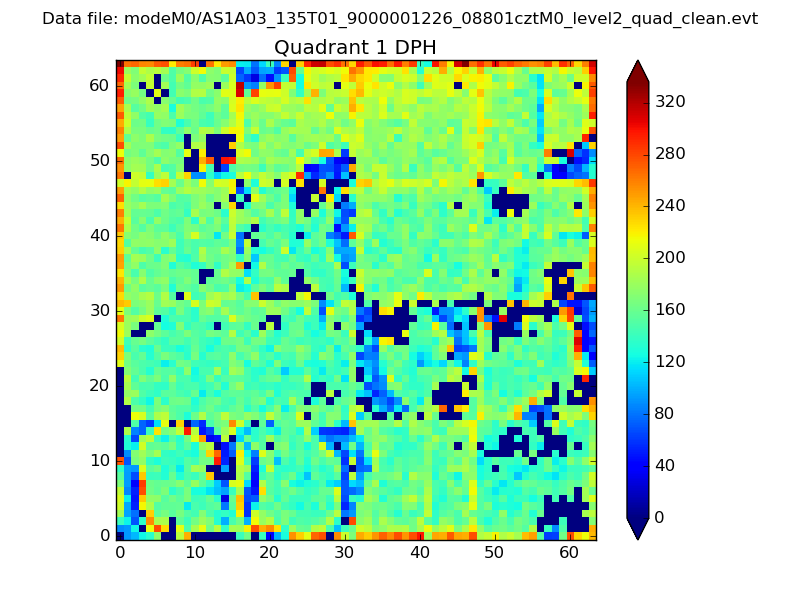 |
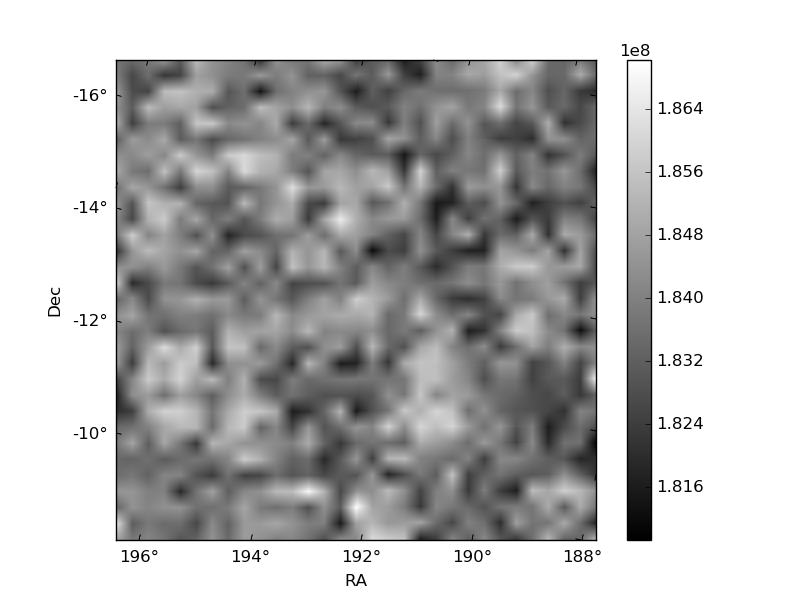
Quadrant B |
|---|---|---|---|
| Quadrant D | 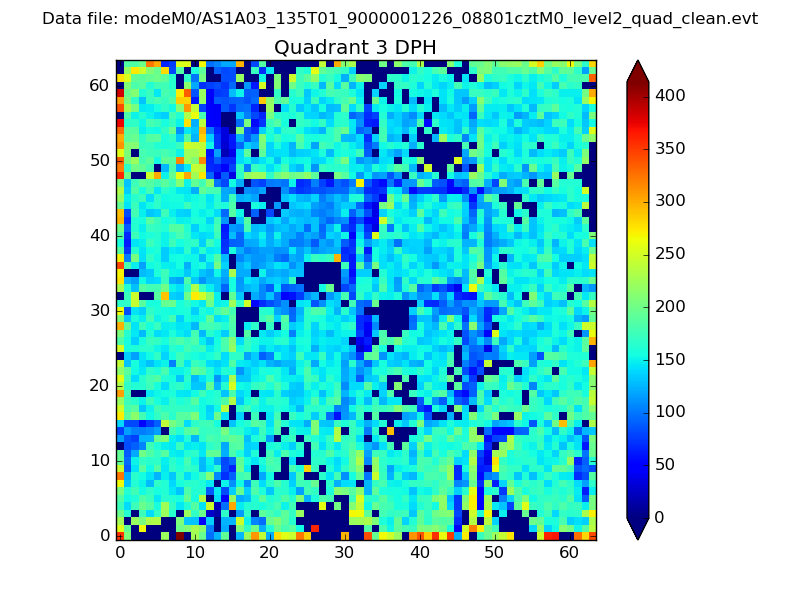 |
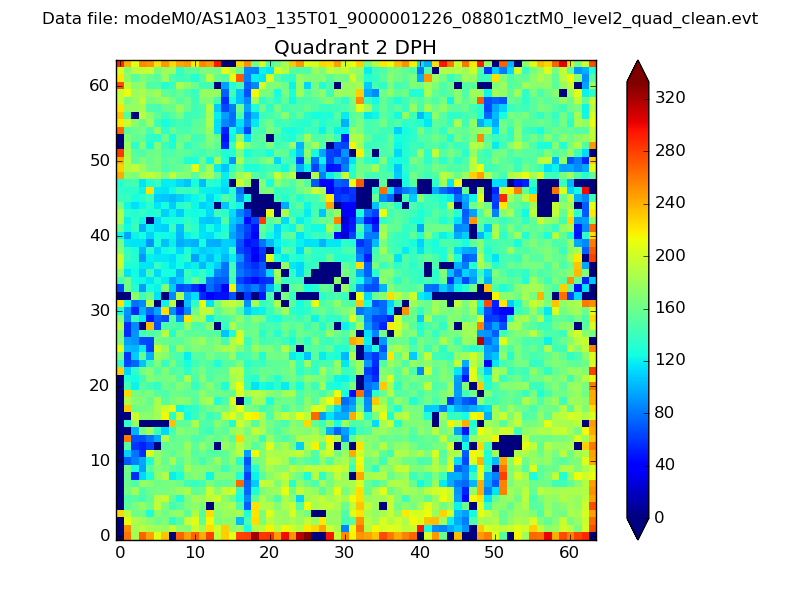 |
Quadrant C |
| Plot type | Count rate plots | Images |
|---|---|---|
| Comparison with Poisson distribution Blue bars denote a histogram of data divided into 1 sec bins. Red curve is a Poisson curve with rate = median count rate of data. |
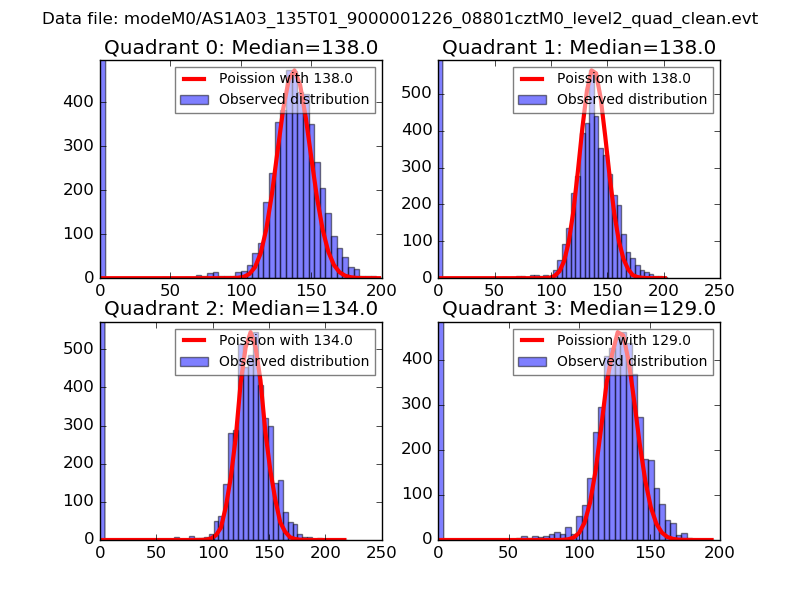 |
 |
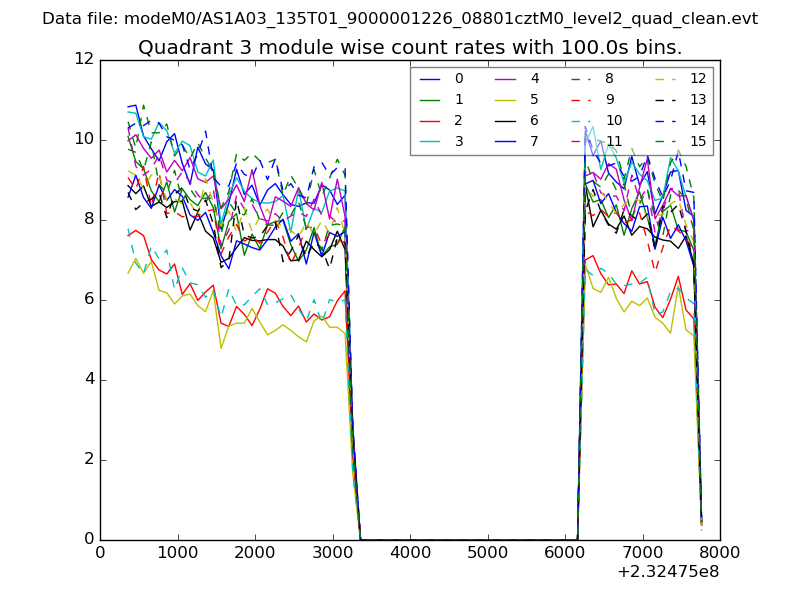
| Quadrant-wise count rates Data is divided into 100 sec bins |
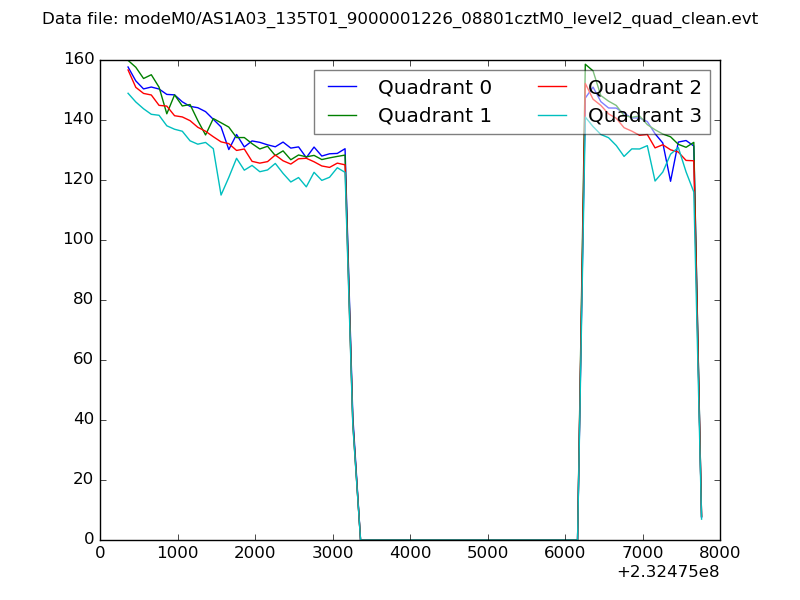 |
|
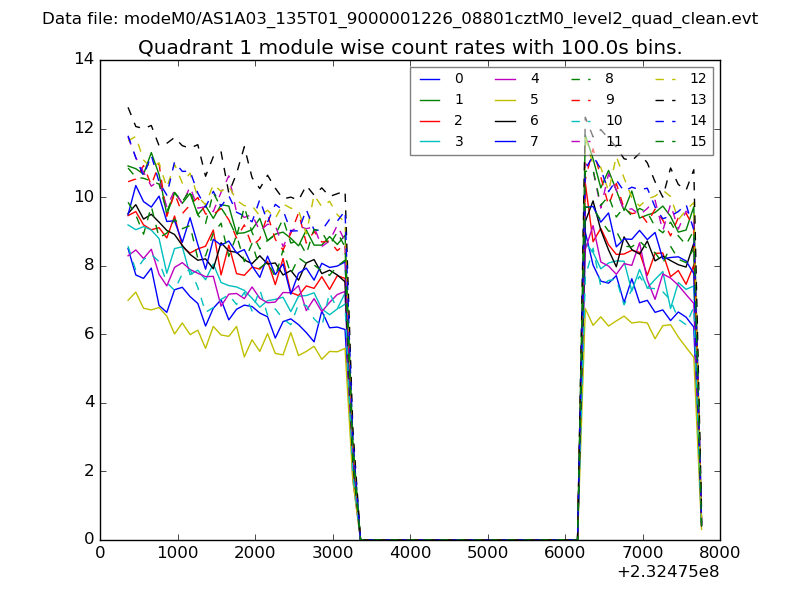
| Module-wise count rates for Quadrant A Data is divided into 100 sec bins |
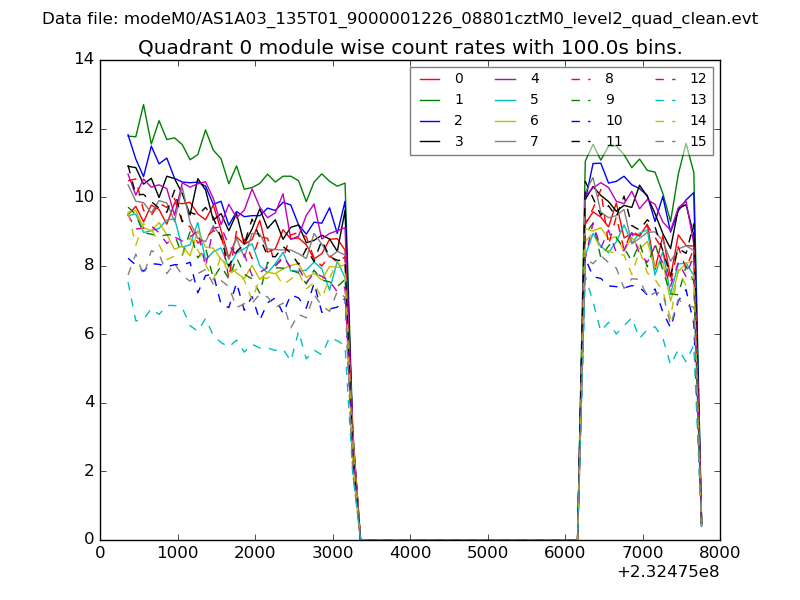 |
 |
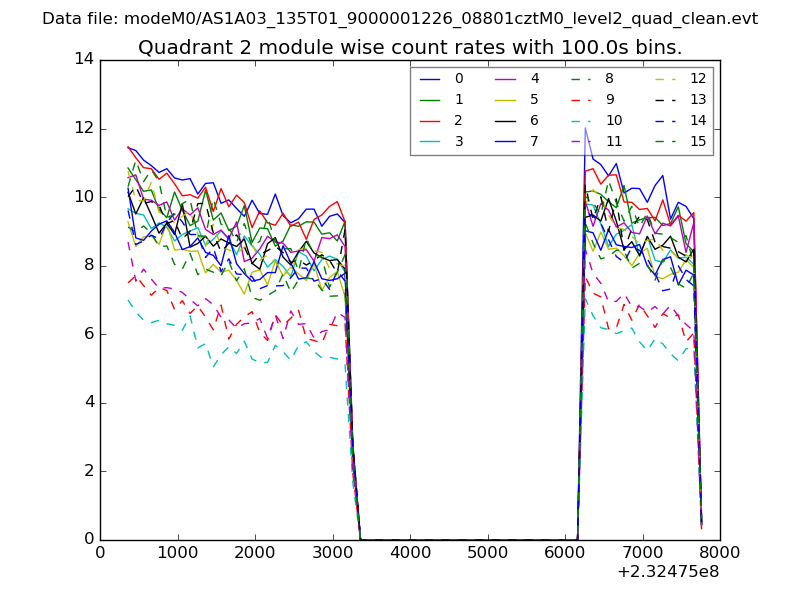
| Module-wise count rates for Quadrant B Data is divided into 100 sec bins |
 |
 |
| Module-wise count rates for Quadrant C Data is divided into 100 sec bins |
 |
 |
| Module-wise count rates for Quadrant D Data is divided into 100 sec bins |
 |
 |
| Parameter | Plot |
|---|---|
| CZT HV Monitor | 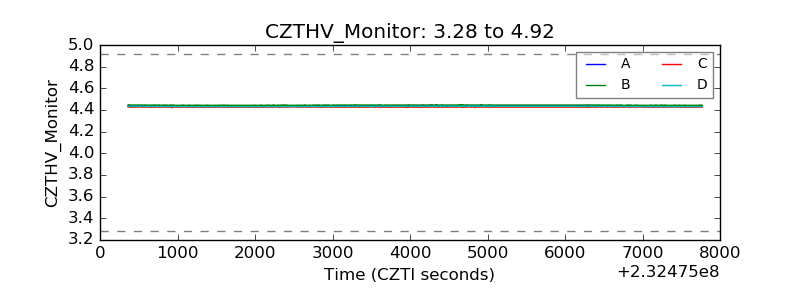 |
| D_VDD | 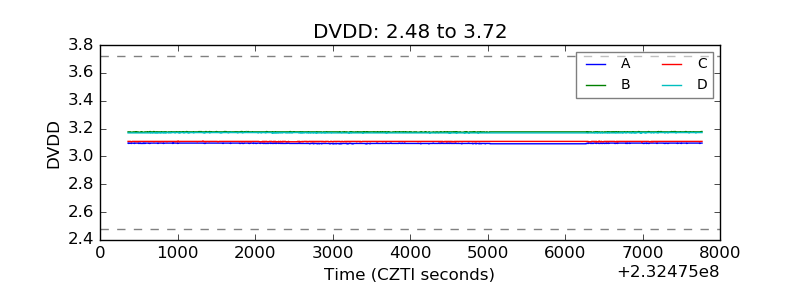 |
| Temperature 1 | 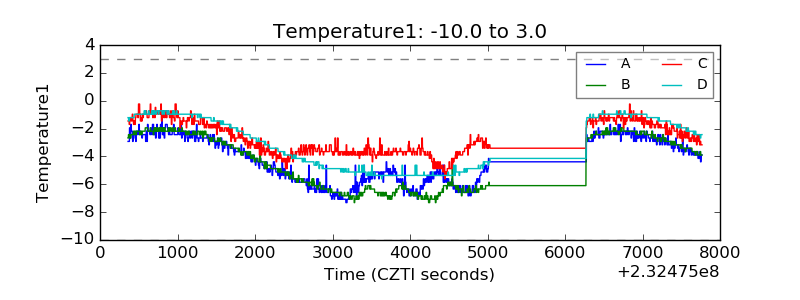 |
| Veto HV Monitor | 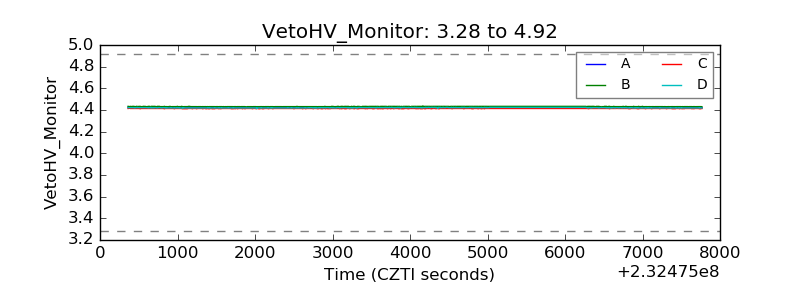 |
| Veto LLD | 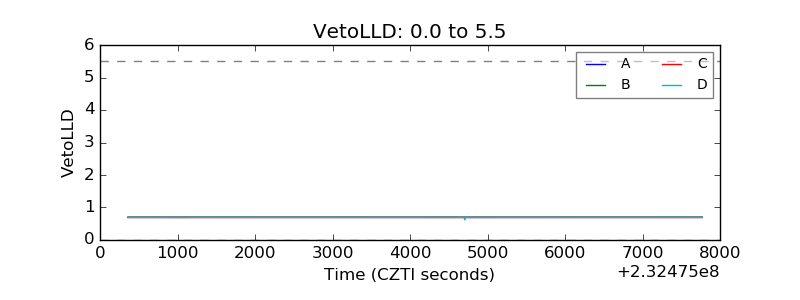 |
| Alpha Counter | 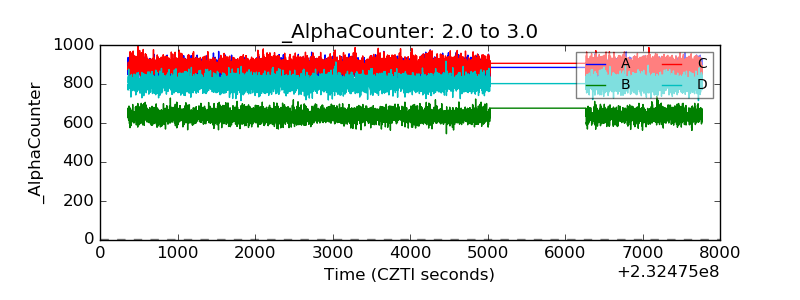 |
| _CPM_Rate | 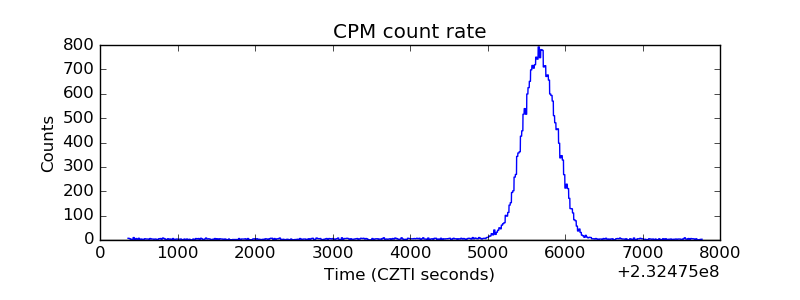 |
| CZT Counter | 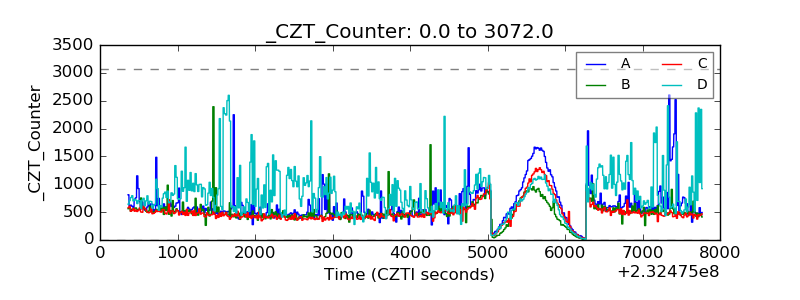 |
| +2.5 Volts monitor |  |
| +5 Volts monitor |  |
| _ROLL_ROT |  |
| _Roll_DEC | 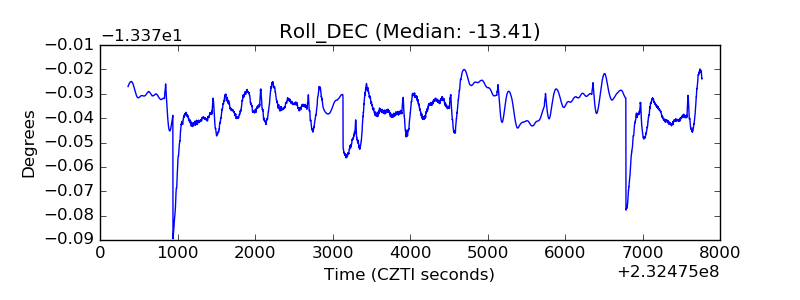 |
| _Roll_RA | 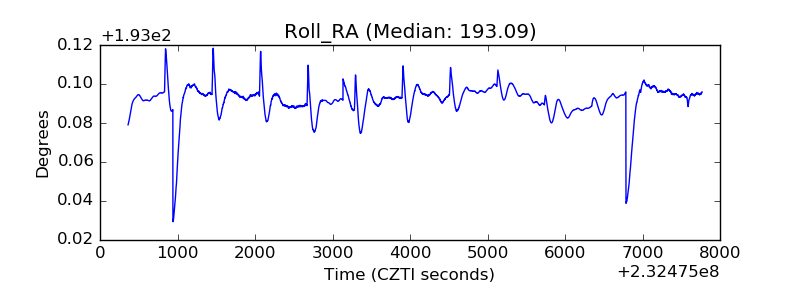 |
| Veto Counter | 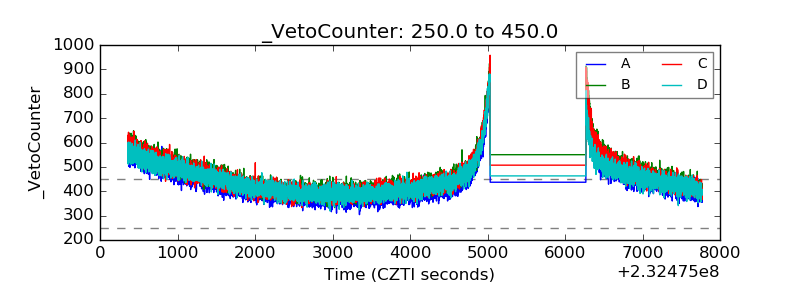 |