| Param | Original file | Final file |
|---|---|---|
| Filename | modeM0/AS1A03_135T01_9000001226_08802cztM0_level2.evt | modeM0/AS1A03_135T01_9000001226_08802cztM0_level2_quad_clean.evt |
| Size (bytes) | 585,990,720 | 89,640,000 |
| Size | 558.8 MB | 85.5 MB |
| Events in quadrant A | 3,908,454 | 584,534 |
| Events in quadrant B | 3,372,175 | 587,576 |
| Events in quadrant C | 3,113,877 | 573,539 |
| Events in quadrant D | 6,900,099 | 503,245 |
| Mode SS | |||
|---|---|---|---|
| Quadrant | BADHDUFLAG | Total packets | Discarded packets |
| A | 0 | 136 | 0 |
| B | 0 | 136 | 0 |
| C | 0 | 136 | 0 |
| D | 0 | 136 | 0 |
| Mode M0 | |||
|---|---|---|---|
| Quadrant | BADHDUFLAG | Total packets | Discarded packets |
| A | 0 | 15961 | 3 |
| B | 0 | 14370 | 2 |
| C | 0 | 13837 | 2 |
| D | 0 | 25187 | 2 |
| Mode M9 | |||
|---|---|---|---|
| Quadrant | BADHDUFLAG | Total packets | Discarded packets |
| A | 0 | 11 | 0 |
| B | 0 | 11 | 0 |
| C | 0 | 11 | 0 |
| D | 0 | 12 | 0 |
| Quadrant | Total seconds | Saturated seconds | Saturation percentage |
|---|---|---|---|
| A | 6672 | 131 | 1.963429% |
| B | 6672 | 88 | 1.318945% |
| C | 6672 | 34 | 0.509592% |
| D | 6672 | 1013 | 15.182854% |
Noise dominated data is calculated using 1-second bins in cleaned event files. If a bin has >2000 counts, and if more than 50% of those come from <1% of pixels, then it is considered to be noise-dominated and hence unusable.
| Quadrant | # 1 sec bins | Bins with >0 counts | Bins with >2000 counts | High rate bins dominated by noise | Noise dominated (total time) | Noise dominated (detector-on time) | Marked lightcurve |
|---|---|---|---|---|---|---|---|
| A | 7732 | 6672 | 58 | 58 | 0.75% | 0.87% | 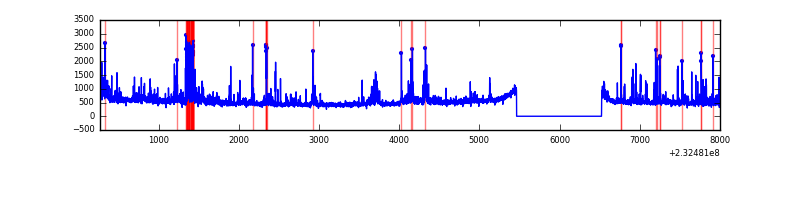 |
| B | 7732 | 6672 | 13 | 13 | 0.17% | 0.19% | 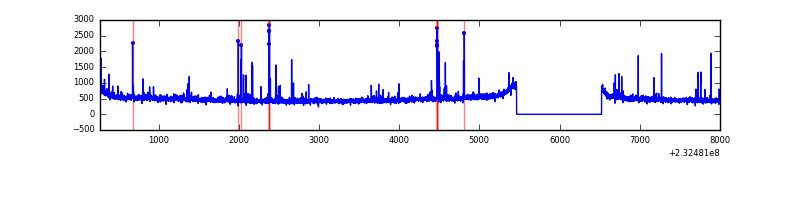 |
| C | 7732 | 6672 | 0 | 0 | 0.00% | 0.00% |  |
| D | 7732 | 6672 | 1006 | 1006 | 13.01% | 15.08% | 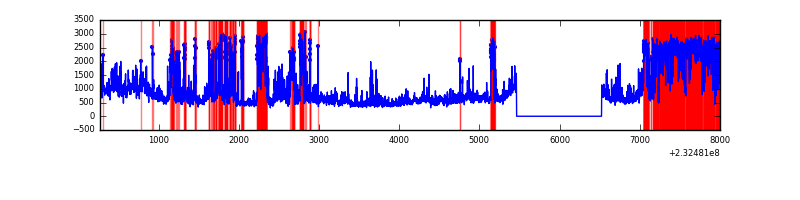 |
Top three noisy pixels from each quadrant. If the there are fewer than three noisy pixels in the level2.evt file, extra rows are filled as -1
| Pixel properties | Quadrant properties | ||||||
|---|---|---|---|---|---|---|---|
| Quadrant | DetID | PixID | Counts | Sigma | Mean | Median | Sigma |
| A | 8 | 5 | 651756 | 3873.24 | 827 | 810 | 168.1 |
| A | 15 | 174 | 26914 | 155.32 | 827 | 810 | 168.1 |
| A | 5 | 16 | 22391 | 128.41 | 827 | 810 | 168.1 |
| B | 10 | 16 | 118223 | 741.88 | 825 | 808 | 158.3 |
| B | 10 | 245 | 25085 | 153.39 | 825 | 808 | 158.3 |
| B | 12 | 111 | 16856 | 101.4 | 825 | 808 | 158.3 |
| C | 9 | 68 | 17418 | 89.92 | 792 | 798 | 184.8 |
| C | 13 | 61 | 5994 | 28.11 | 792 | 798 | 184.8 |
| C | 1 | 16 | 3036 | 12.11 | 792 | 798 | 184.8 |
| D | 2 | 16 | 2888593 | 15316.0 | 752 | 735 | 188.6 |
| D | 1 | 52 | 731653 | 3876.49 | 752 | 735 | 188.6 |
| D | 10 | 253 | 176900 | 934.31 | 752 | 735 | 188.6 |
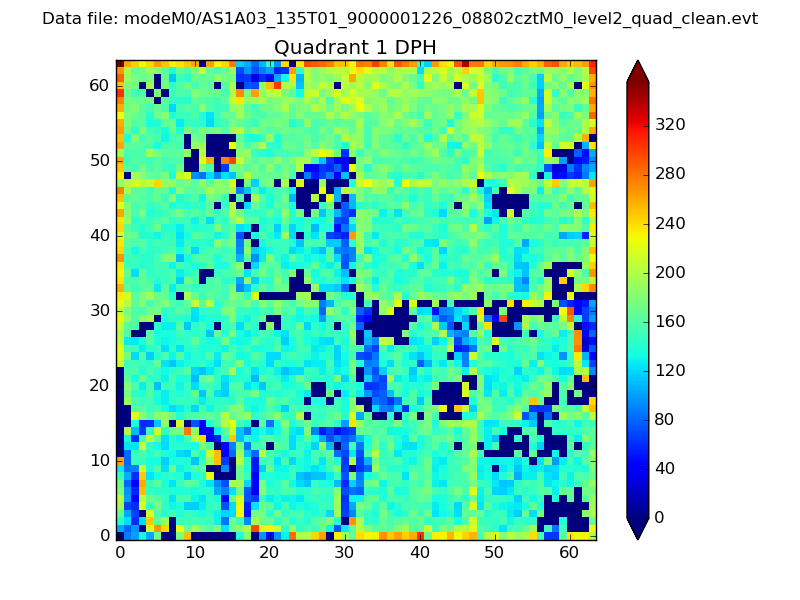
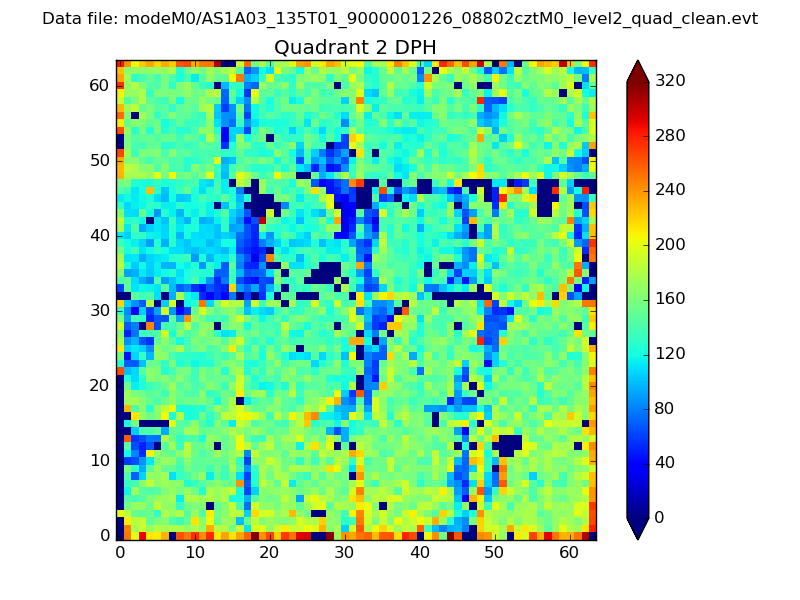
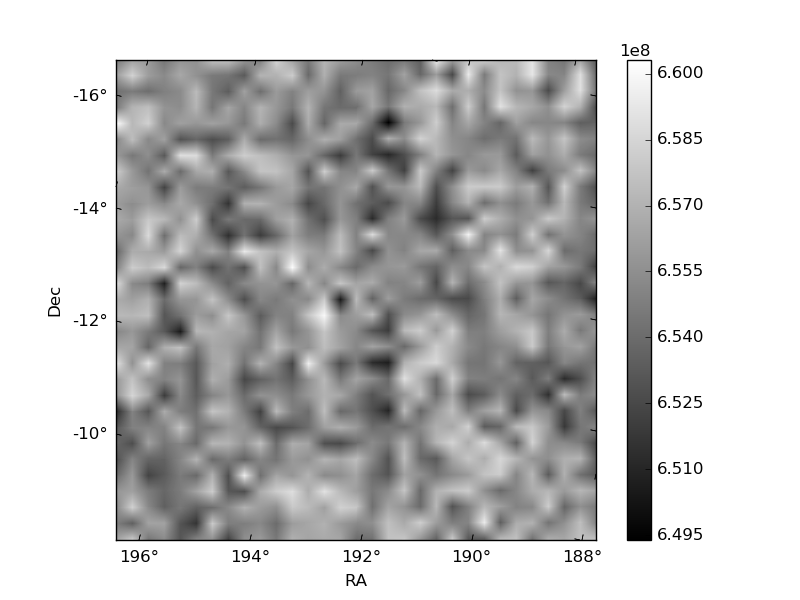
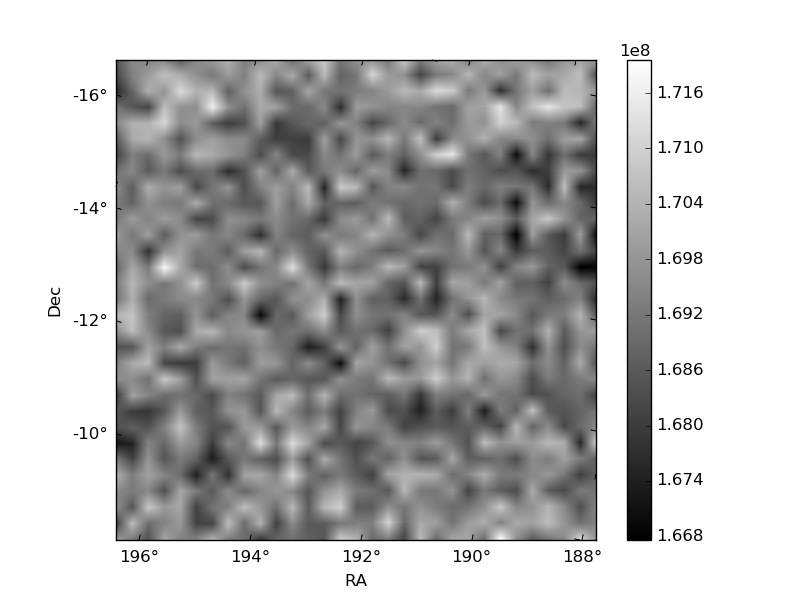
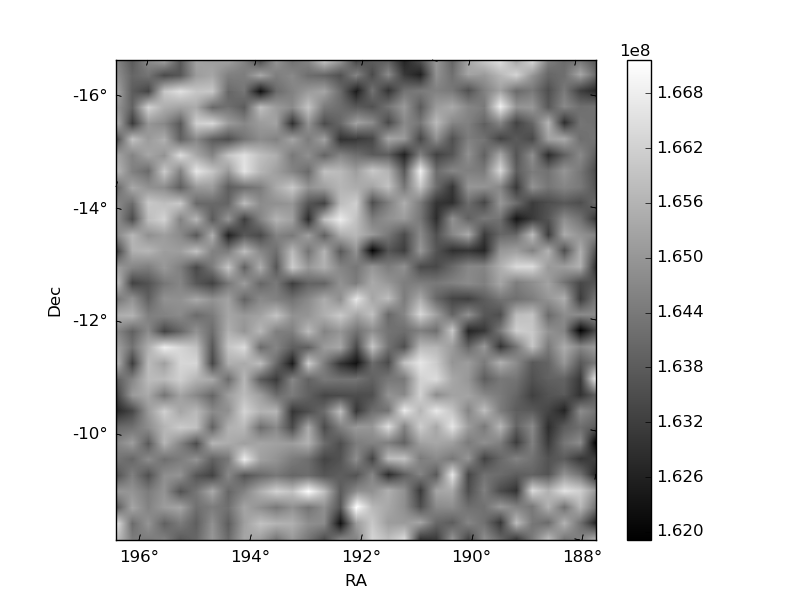
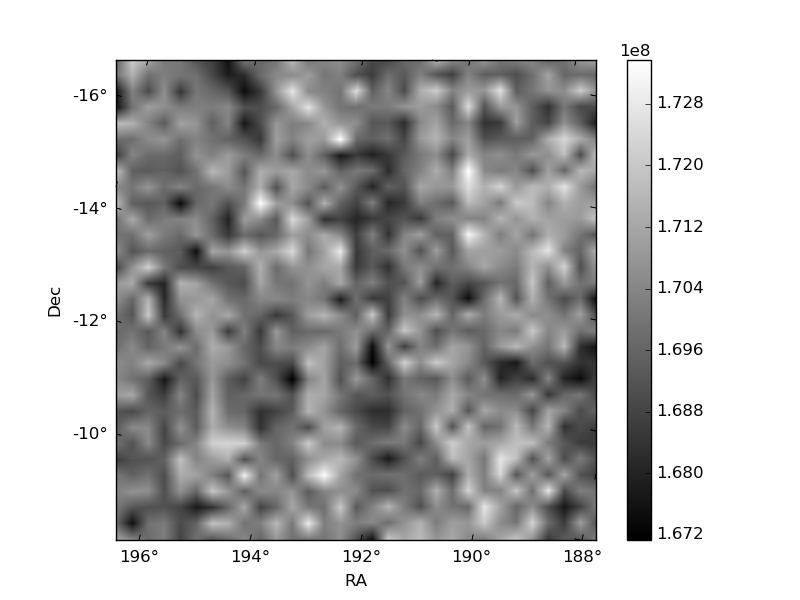
Histogram calculated using DETX and DETY for each event in the final _common_clean file
| Quadrant A | 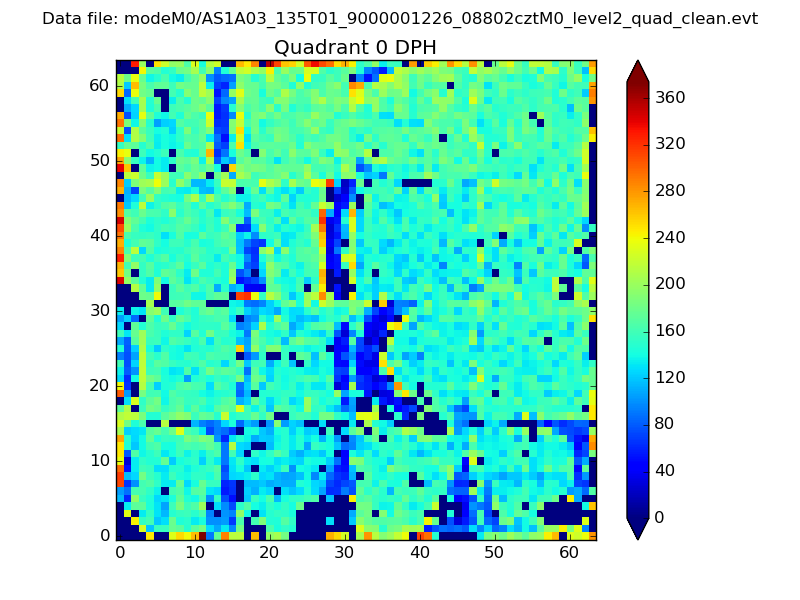 |
 |
Quadrant B |
|---|---|---|---|
| Quadrant D | 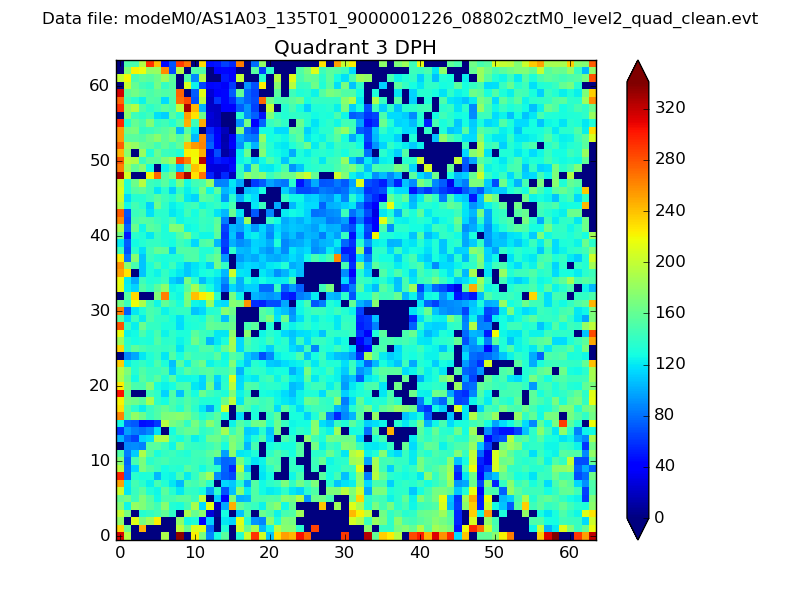 |
 |
Quadrant C |
| Plot type | Count rate plots | Images |
|---|---|---|
| Comparison with Poisson distribution Blue bars denote a histogram of data divided into 1 sec bins. Red curve is a Poisson curve with rate = median count rate of data. |
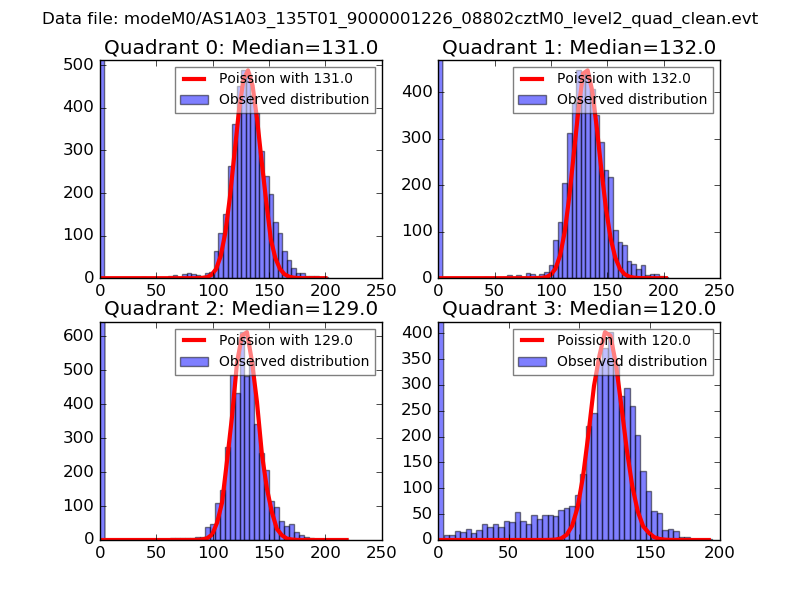 |
 |
| Quadrant-wise count rates Data is divided into 100 sec bins |
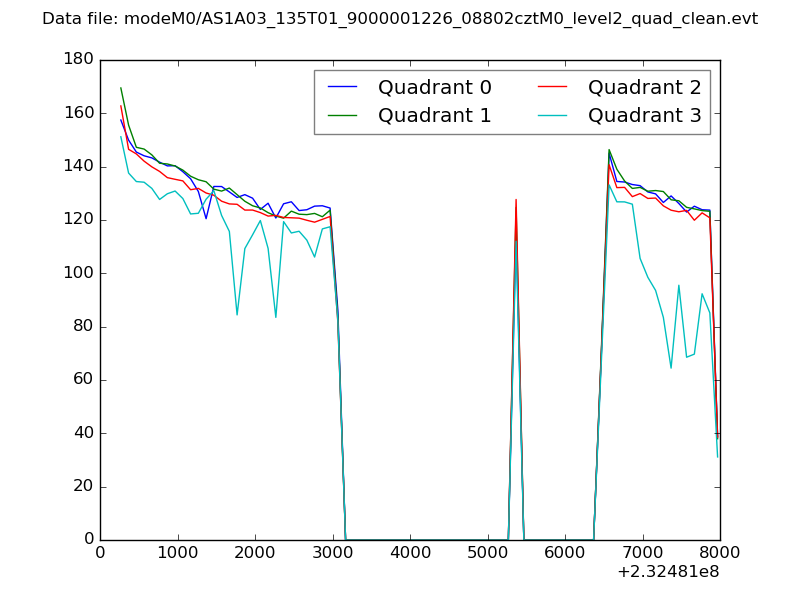 |
|
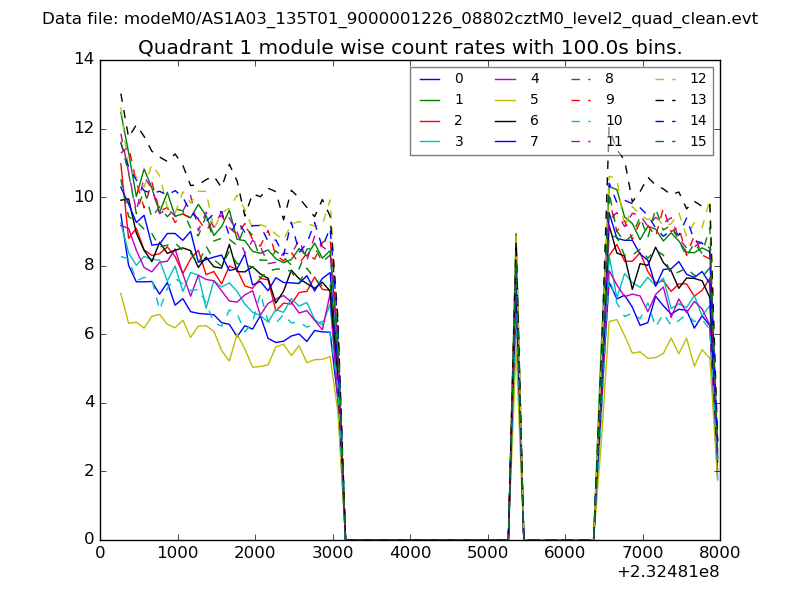
| Module-wise count rates for Quadrant A Data is divided into 100 sec bins |
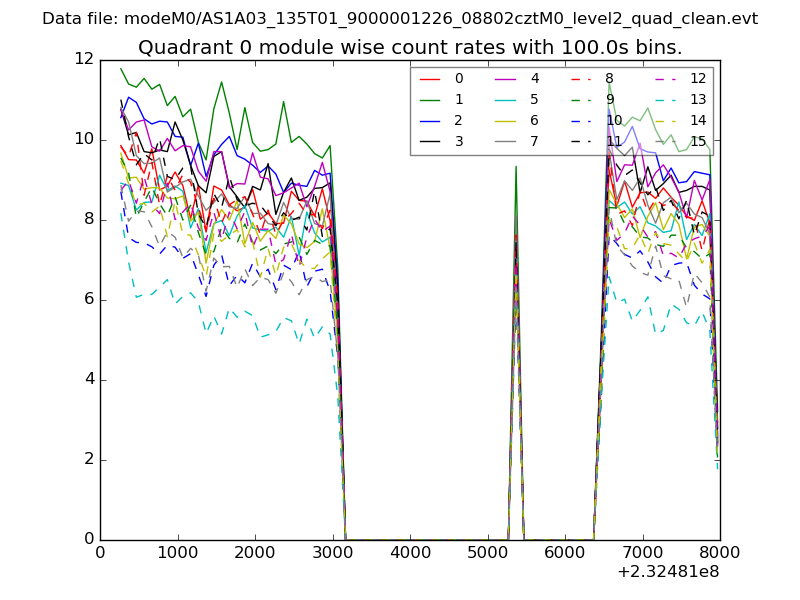 |
 |
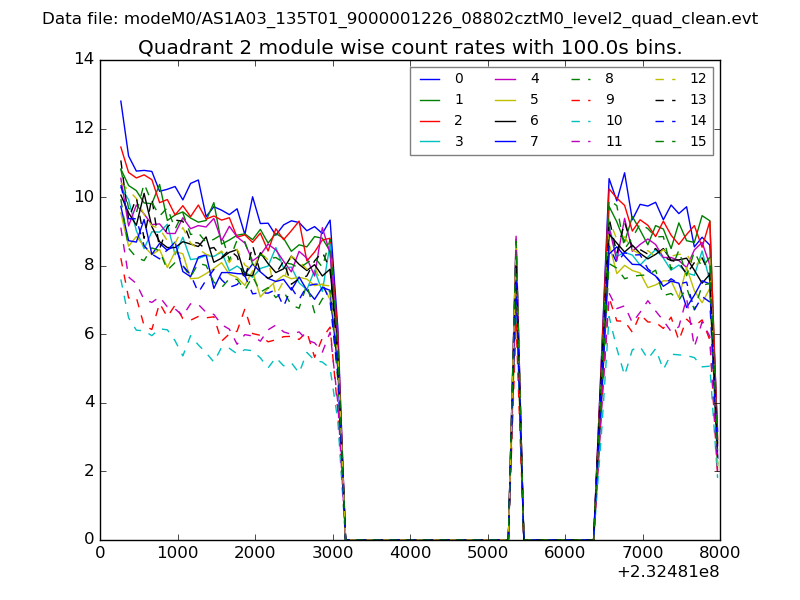
| Module-wise count rates for Quadrant B Data is divided into 100 sec bins |
 |
 |
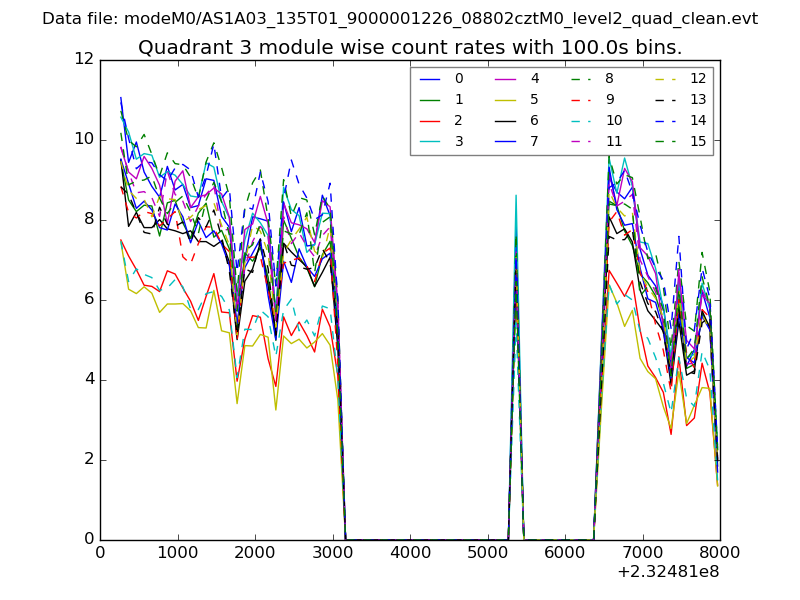
| Module-wise count rates for Quadrant C Data is divided into 100 sec bins |
 |
 |
| Module-wise count rates for Quadrant D Data is divided into 100 sec bins |
 |
 |
| Parameter | Plot |
|---|---|
| CZT HV Monitor | 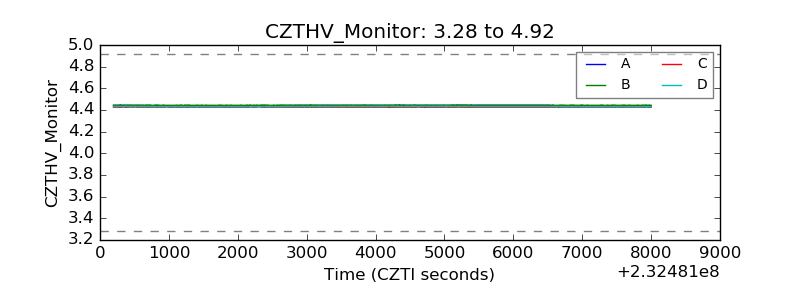 |
| D_VDD | 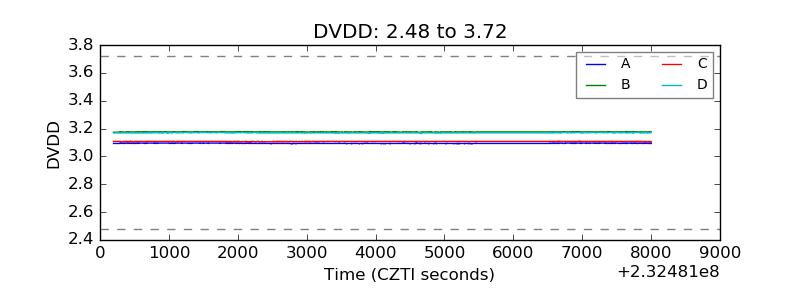 |
| Temperature 1 | 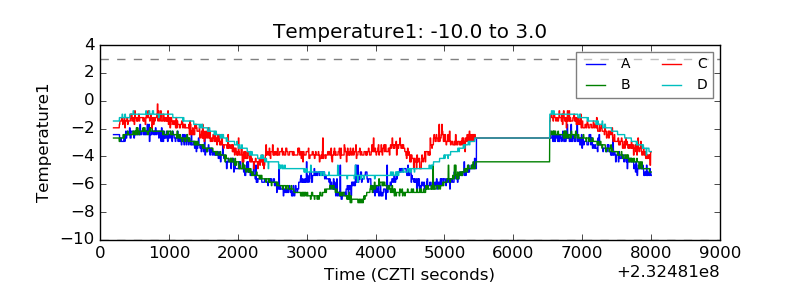 |
| Veto HV Monitor | 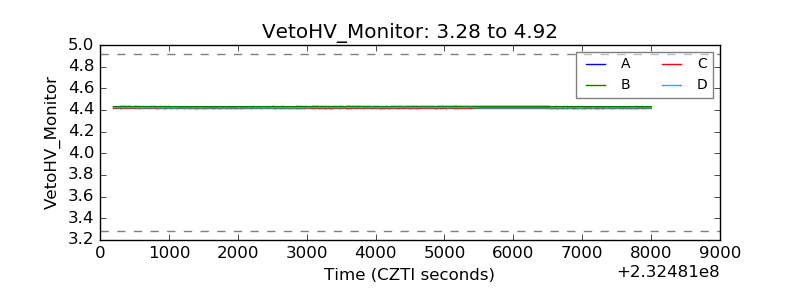 |
| Veto LLD | 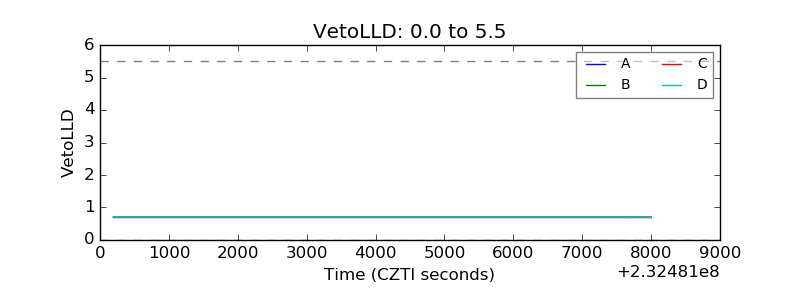 |
| Alpha Counter | 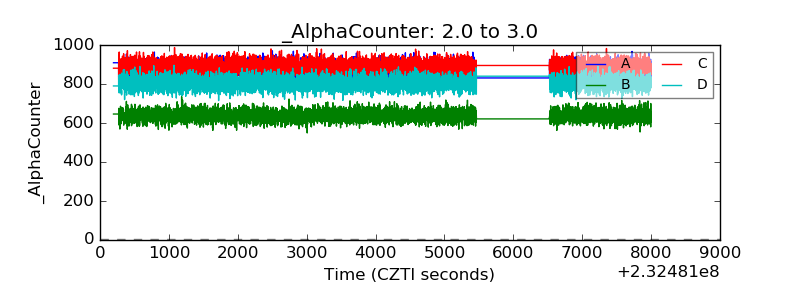 |
| _CPM_Rate | 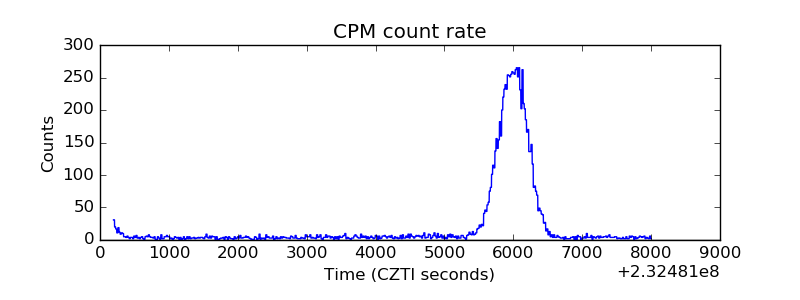 |
| CZT Counter | 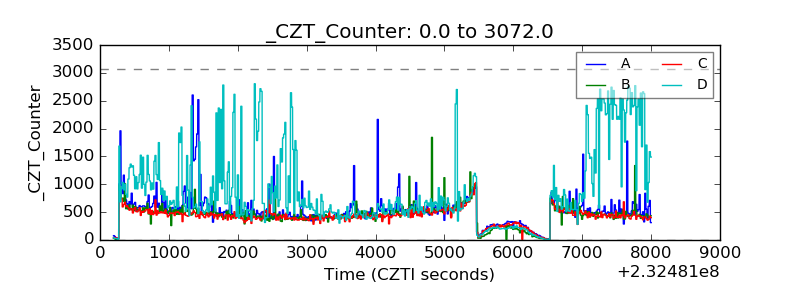 |
| +2.5 Volts monitor |  |
| +5 Volts monitor | 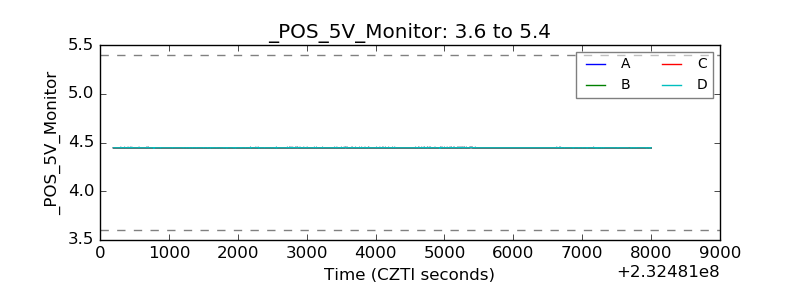 |
| _ROLL_ROT | 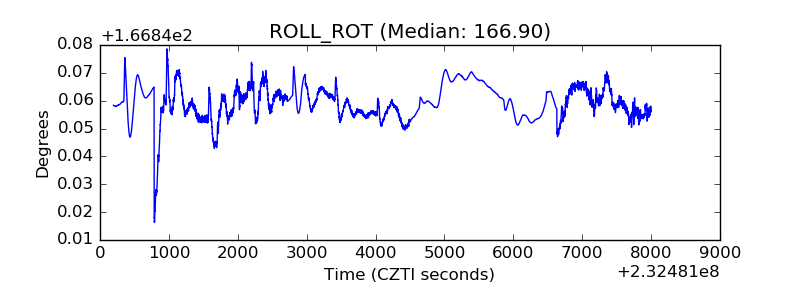 |
| _Roll_DEC | 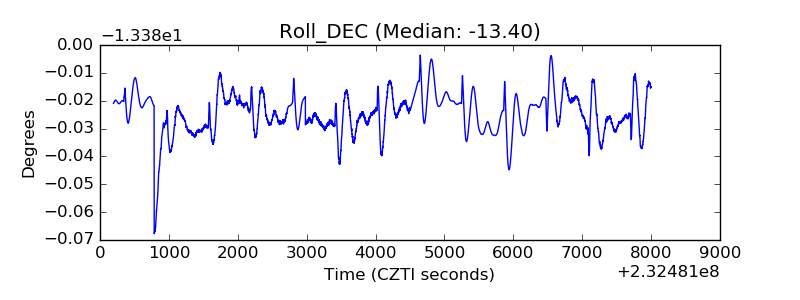 |
| _Roll_RA | 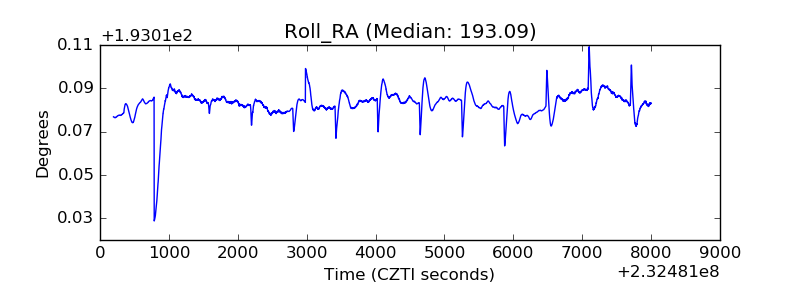 |
| Veto Counter | 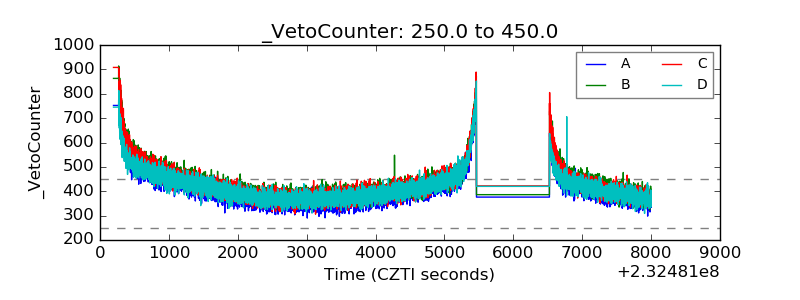 |