| Param | Original file | Final file |
|---|---|---|
| Filename | modeM0/AS1A03_135T01_9000001226_08803cztM0_level2.evt | modeM0/AS1A03_135T01_9000001226_08803cztM0_level2_quad_clean.evt |
| Size (bytes) | 644,068,800 | 91,514,880 |
| Size | 614.2 MB | 87.3 MB |
| Events in quadrant A | 3,788,709 | 602,792 |
| Events in quadrant B | 3,392,772 | 604,097 |
| Events in quadrant C | 3,162,006 | 590,851 |
| Events in quadrant D | 8,691,317 | 489,083 |
| Mode SS | |||
|---|---|---|---|
| Quadrant | BADHDUFLAG | Total packets | Discarded packets |
| A | 0 | 140 | 0 |
| B | 0 | 140 | 0 |
| C | 0 | 140 | 0 |
| D | 0 | 140 | 0 |
| Mode M0 | |||
|---|---|---|---|
| Quadrant | BADHDUFLAG | Total packets | Discarded packets |
| A | 0 | 15739 | 3 |
| B | 0 | 14663 | 2 |
| C | 0 | 14278 | 2 |
| D | 0 | 30632 | 2 |
| Mode M9 | |||
|---|---|---|---|
| Quadrant | BADHDUFLAG | Total packets | Discarded packets |
| A | 0 | 16 | 0 |
| B | 0 | 16 | 0 |
| C | 0 | 16 | 0 |
| D | 0 | 17 | 0 |
| Quadrant | Total seconds | Saturated seconds | Saturation percentage |
|---|---|---|---|
| A | 6951 | 81 | 1.165300% |
| B | 6951 | 68 | 0.978277% |
| C | 6951 | 16 | 0.230183% |
| D | 6951 | 1991 | 28.643361% |
Noise dominated data is calculated using 1-second bins in cleaned event files. If a bin has >2000 counts, and if more than 50% of those come from <1% of pixels, then it is considered to be noise-dominated and hence unusable.
| Quadrant | # 1 sec bins | Bins with >0 counts | Bins with >2000 counts | High rate bins dominated by noise | Noise dominated (total time) | Noise dominated (detector-on time) | Marked lightcurve |
|---|---|---|---|---|---|---|---|
| A | 7606 | 6951 | 26 | 26 | 0.34% | 0.37% | 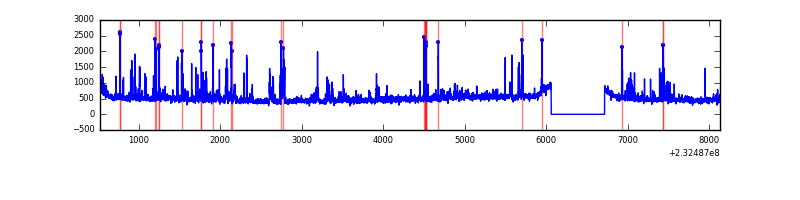 |
| B | 7606 | 6951 | 6 | 6 | 0.08% | 0.09% | 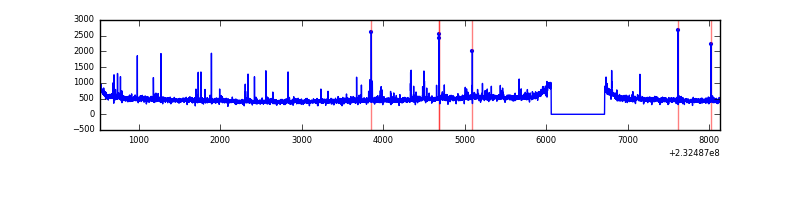 |
| C | 7606 | 6952 | 0 | 0 | 0.00% | 0.00% | 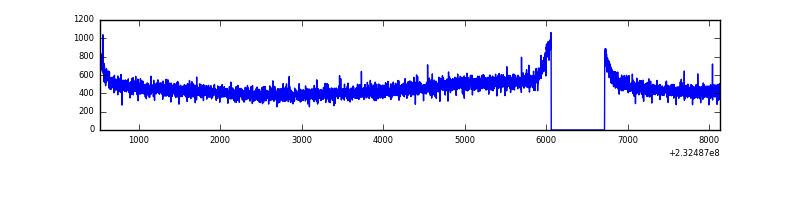 |
| D | 7606 | 6951 | 1910 | 1910 | 25.11% | 27.48% | 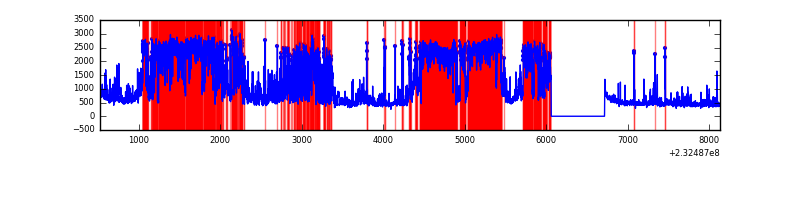 |
Top three noisy pixels from each quadrant. If the there are fewer than three noisy pixels in the level2.evt file, extra rows are filled as -1
| Pixel properties | Quadrant properties | ||||||
|---|---|---|---|---|---|---|---|
| Quadrant | DetID | PixID | Counts | Sigma | Mean | Median | Sigma |
| A | 8 | 5 | 496672 | 2906.26 | 838 | 822 | 170.6 |
| A | 13 | 248 | 38162 | 218.86 | 838 | 822 | 170.6 |
| A | 13 | 251 | 11379 | 61.88 | 838 | 822 | 170.6 |
| B | 10 | 16 | 62121 | 381.12 | 840 | 820 | 160.8 |
| B | 5 | 255 | 35018 | 212.62 | 840 | 820 | 160.8 |
| B | 12 | 111 | 17375 | 102.93 | 840 | 820 | 160.8 |
| C | 13 | 61 | 6095 | 28.06 | 807 | 812 | 188.3 |
| C | 8 | 128 | 4384 | 18.97 | 807 | 812 | 188.3 |
| C | 1 | 16 | 3613 | 14.88 | 807 | 812 | 188.3 |
| D | 2 | 16 | 5439483 | 31547.68 | 674 | 657 | 172.4 |
| D | 1 | 52 | 384775 | 2228.06 | 674 | 657 | 172.4 |
| D | 7 | 71 | 100872 | 581.29 | 674 | 657 | 172.4 |
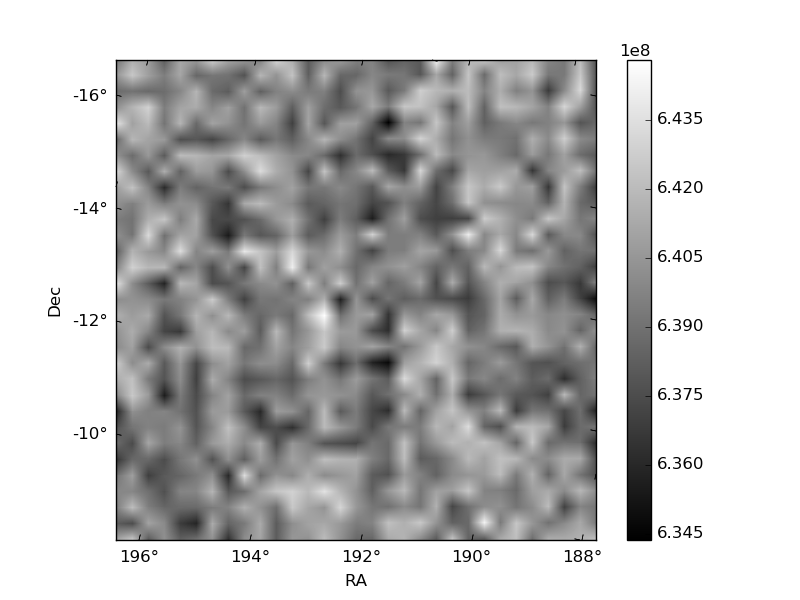
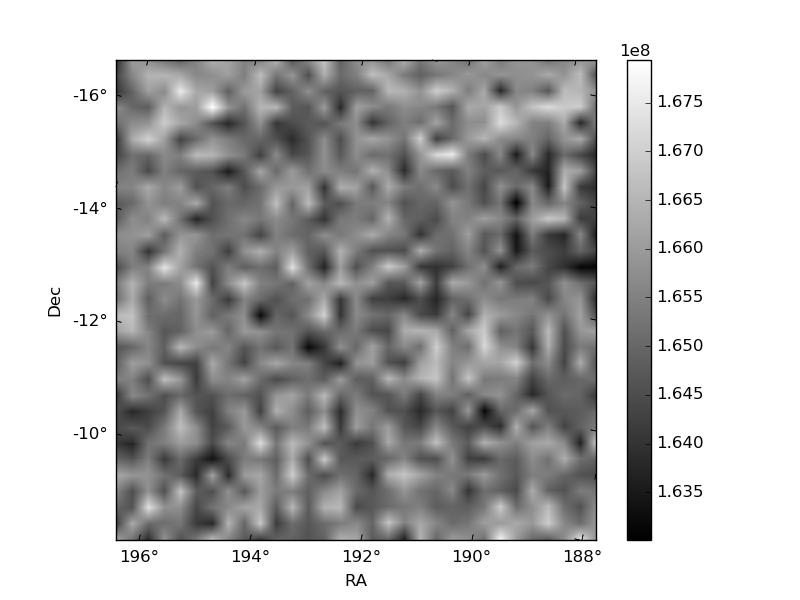
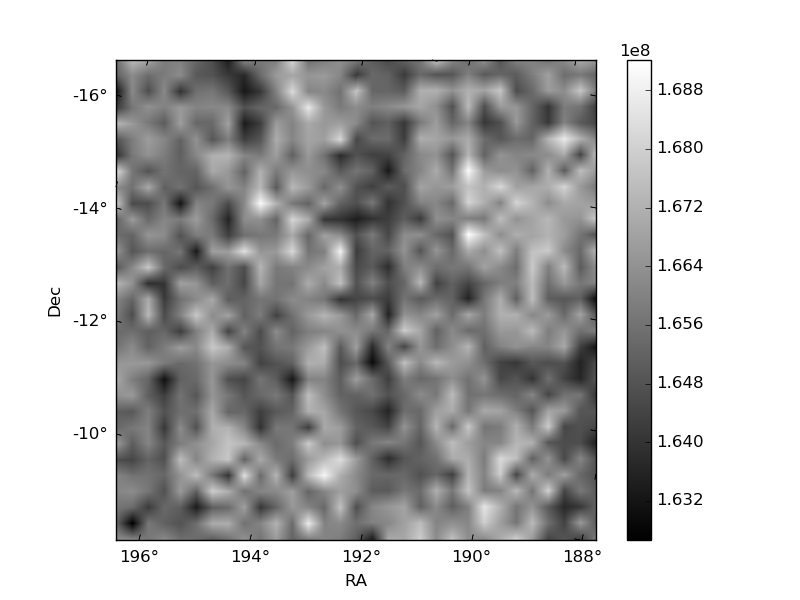
Histogram calculated using DETX and DETY for each event in the final _common_clean file
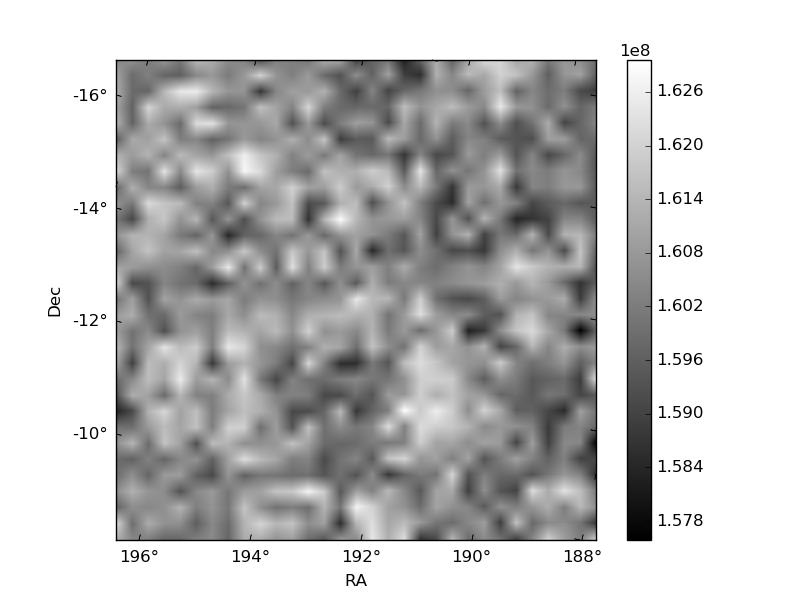
| Quadrant A | 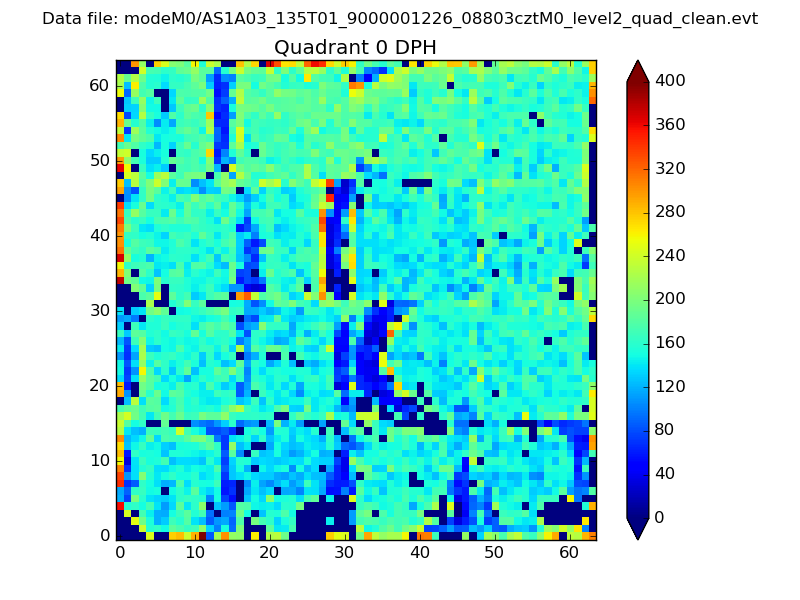 |
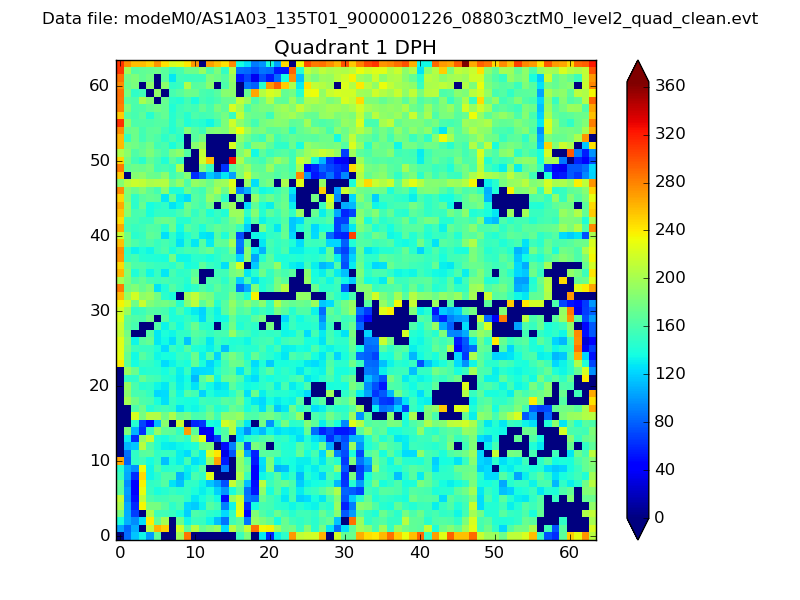 |
Quadrant B |
|---|---|---|---|
| Quadrant D | 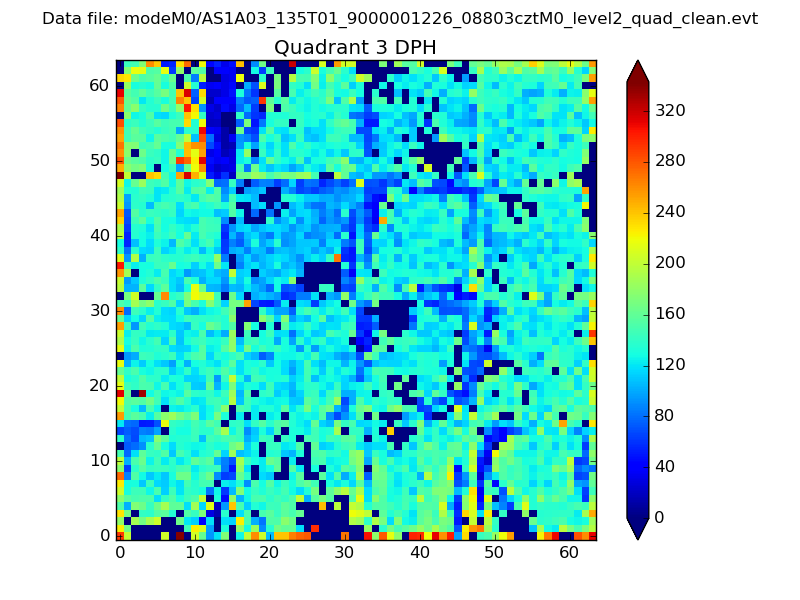 |
 |
Quadrant C |
| Plot type | Count rate plots | Images |
|---|---|---|
| Comparison with Poisson distribution Blue bars denote a histogram of data divided into 1 sec bins. Red curve is a Poisson curve with rate = median count rate of data. |
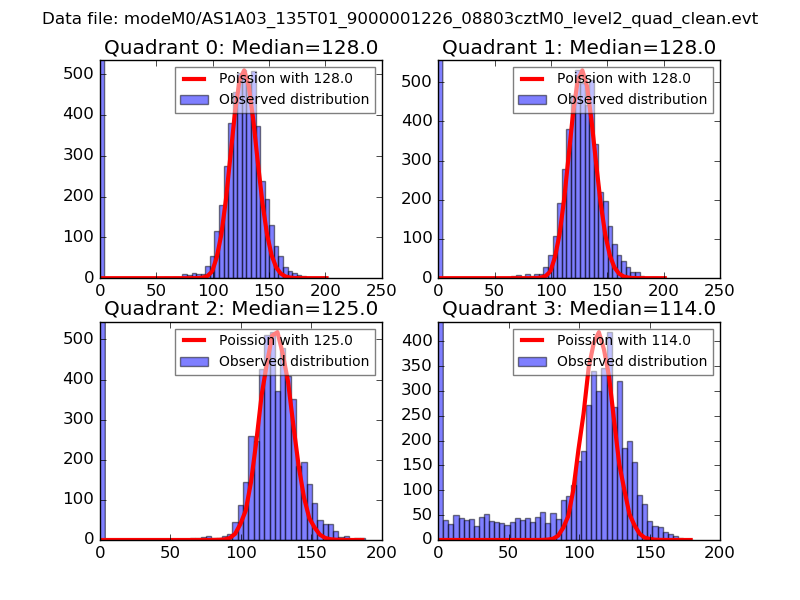 |
 |
| Quadrant-wise count rates Data is divided into 100 sec bins |
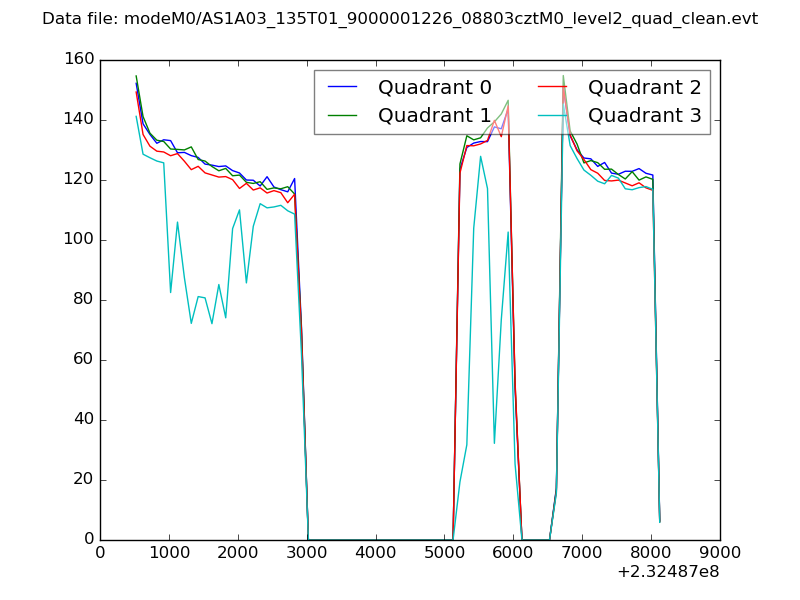 |
|
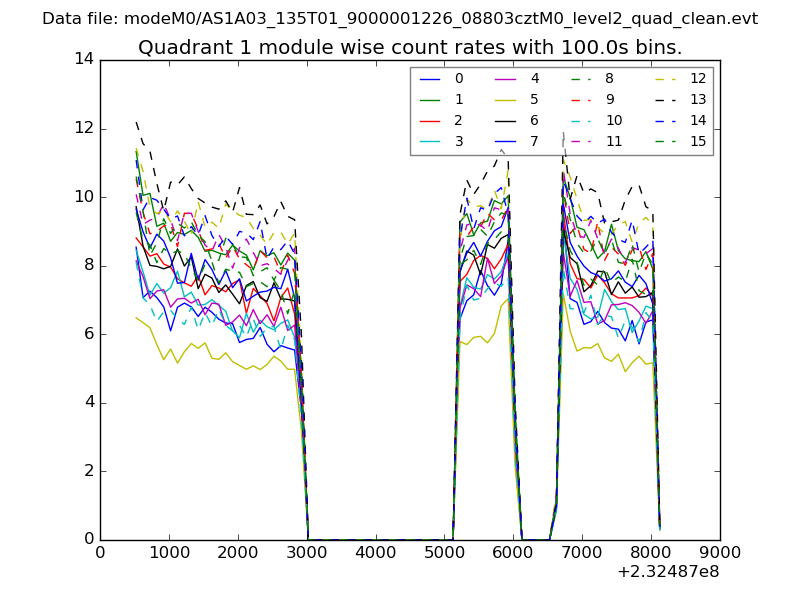
| Module-wise count rates for Quadrant A Data is divided into 100 sec bins |
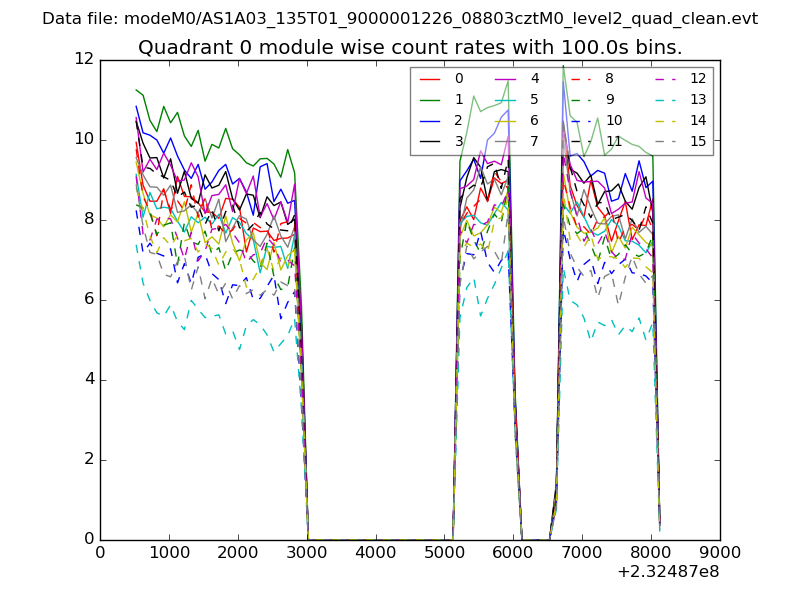 |
 |
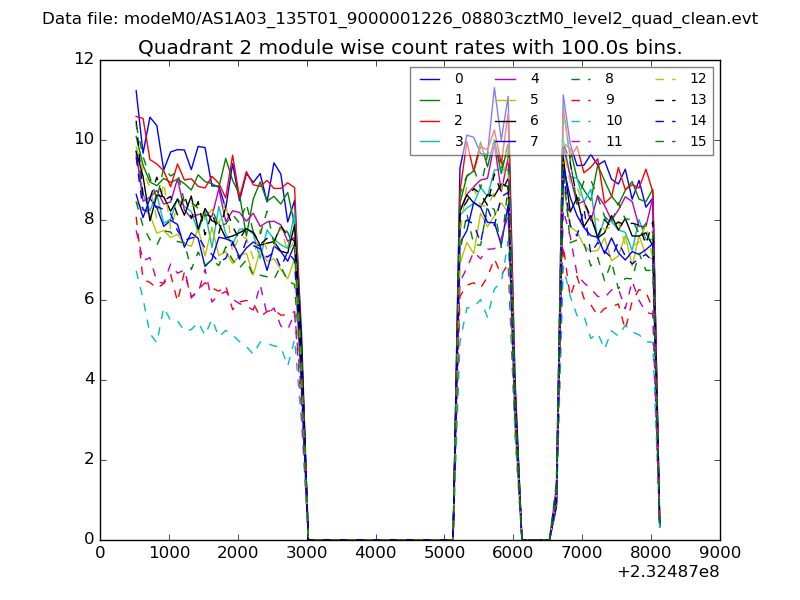
| Module-wise count rates for Quadrant B Data is divided into 100 sec bins |
 |
 |
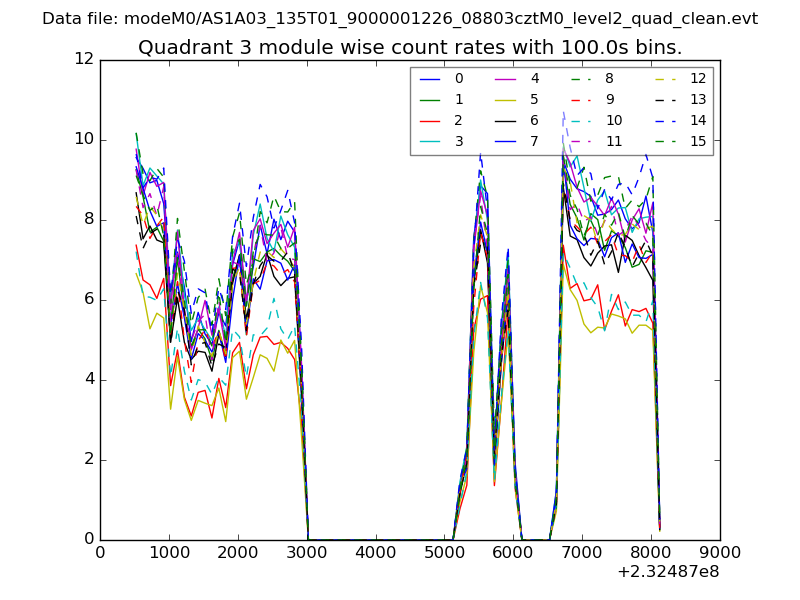
| Module-wise count rates for Quadrant C Data is divided into 100 sec bins |
 |
 |
| Module-wise count rates for Quadrant D Data is divided into 100 sec bins |
 |
 |
| Parameter | Plot |
|---|---|
| CZT HV Monitor | 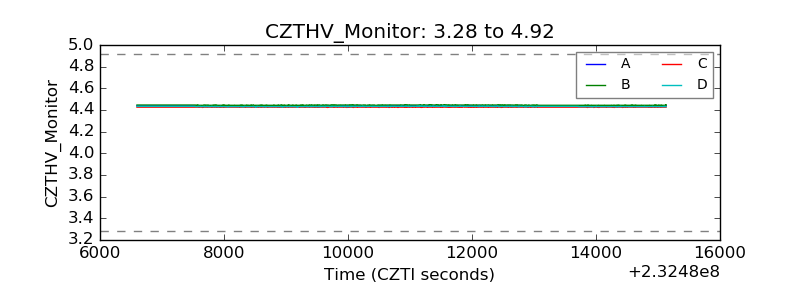 |
| D_VDD | 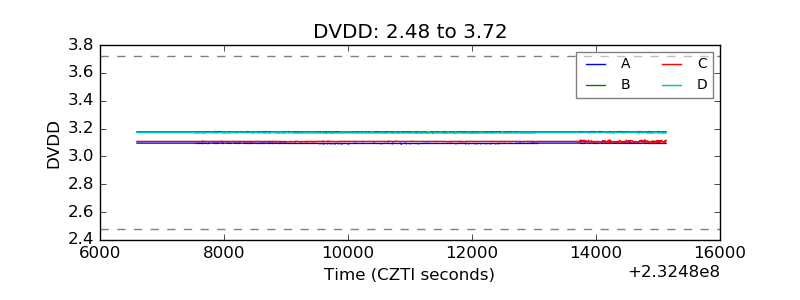 |
| Temperature 1 | 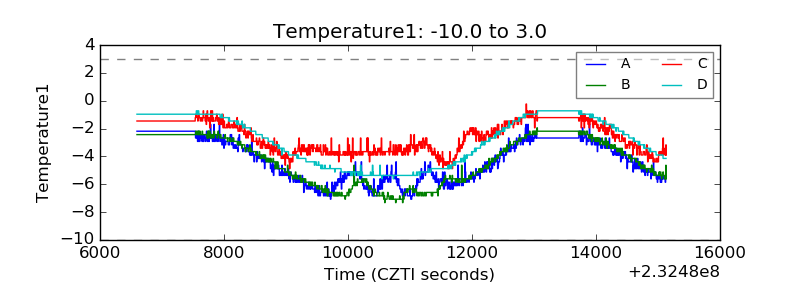 |
| Veto HV Monitor | 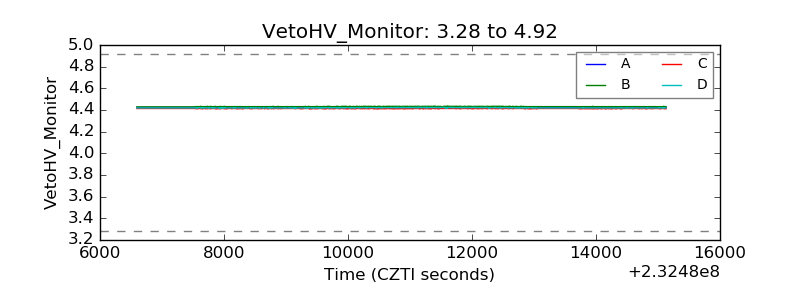 |
| Veto LLD | 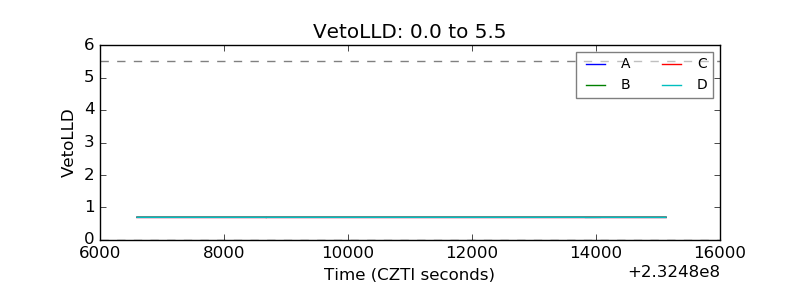 |
| Alpha Counter | 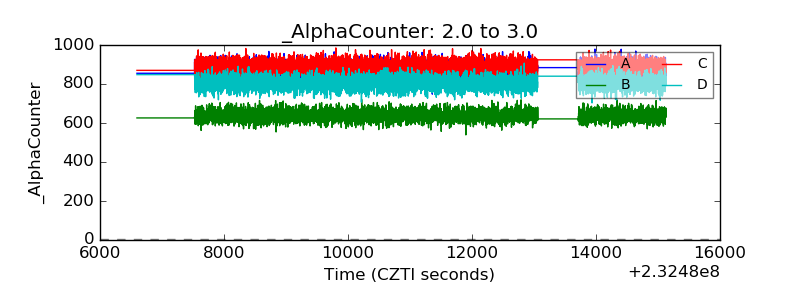 |
| _CPM_Rate | 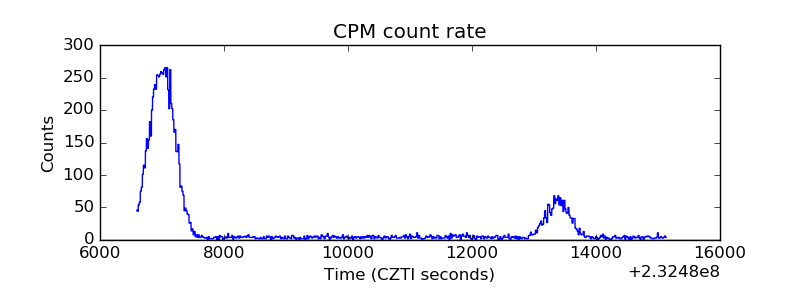 |
| CZT Counter |  |
| +2.5 Volts monitor |  |
| +5 Volts monitor |  |
| _ROLL_ROT | 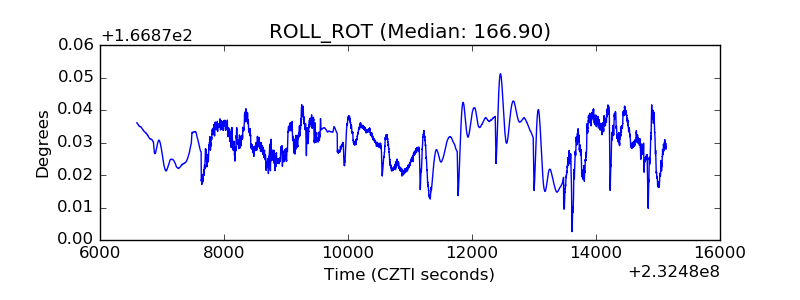 |
| _Roll_DEC | 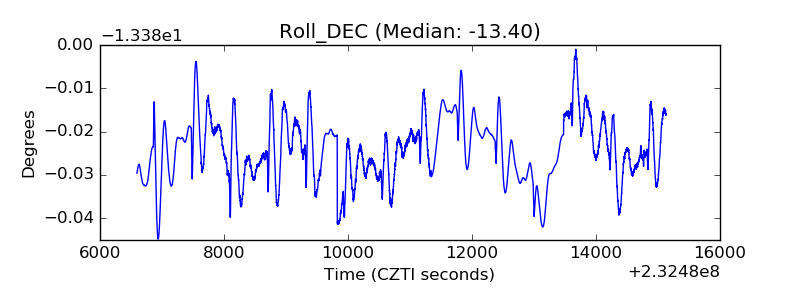 |
| _Roll_RA | 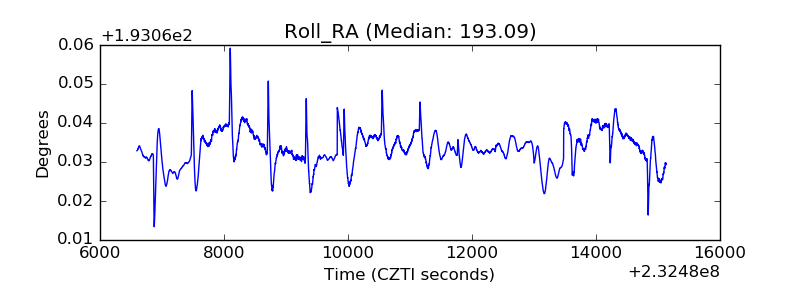 |
| Veto Counter | 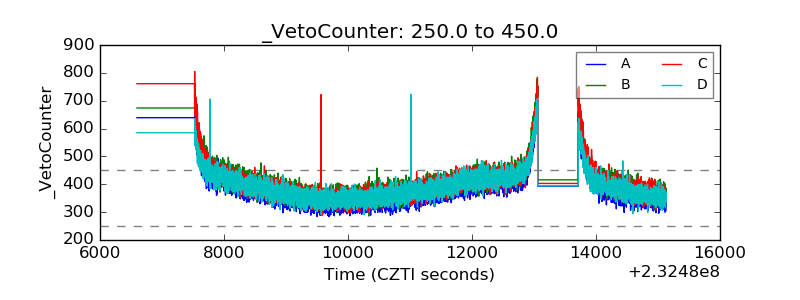 |