| Param | Original file | Final file |
|---|---|---|
| Filename | modeM0/AS1A03_135T01_9000001226_08804cztM0_level2.evt | modeM0/AS1A03_135T01_9000001226_08804cztM0_level2_quad_clean.evt |
| Size (bytes) | 568,975,680 | 105,865,920 |
| Size | 542.6 MB | 101.0 MB |
| Events in quadrant A | 3,955,692 | 690,139 |
| Events in quadrant B | 4,008,414 | 683,033 |
| Events in quadrant C | 3,536,222 | 675,971 |
| Events in quadrant D | 5,211,561 | 624,175 |
| Mode SS | |||
|---|---|---|---|
| Quadrant | BADHDUFLAG | Total packets | Discarded packets |
| A | 0 | 158 | 0 |
| B | 0 | 158 | 0 |
| C | 0 | 158 | 0 |
| D | 0 | 158 | 0 |
| Mode M0 | |||
|---|---|---|---|
| Quadrant | BADHDUFLAG | Total packets | Discarded packets |
| A | 0 | 16726 | 3 |
| B | 0 | 17045 | 5 |
| C | 0 | 15860 | 4 |
| D | 0 | 20763 | 2 |
| Mode M9 | |||
|---|---|---|---|
| Quadrant | BADHDUFLAG | Total packets | Discarded packets |
| A | 0 | 11 | 0 |
| B | 0 | 11 | 0 |
| C | 0 | 11 | 0 |
| D | 0 | 11 | 0 |
| Quadrant | Total seconds | Saturated seconds | Saturation percentage |
|---|---|---|---|
| A | 7667 | 103 | 1.343420% |
| B | 7666 | 182 | 2.374119% |
| C | 7666 | 34 | 0.443517% |
| D | 7667 | 670 | 8.738750% |
Noise dominated data is calculated using 1-second bins in cleaned event files. If a bin has >2000 counts, and if more than 50% of those come from <1% of pixels, then it is considered to be noise-dominated and hence unusable.
| Quadrant | # 1 sec bins | Bins with >0 counts | Bins with >2000 counts | High rate bins dominated by noise | Noise dominated (total time) | Noise dominated (detector-on time) | Marked lightcurve |
|---|---|---|---|---|---|---|---|
| A | 8587 | 7669 | 9 | 9 | 0.10% | 0.12% | 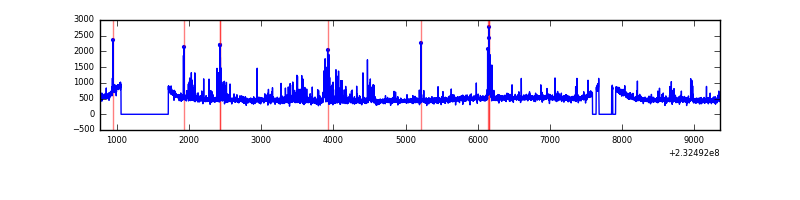 |
| B | 8587 | 7670 | 55 | 55 | 0.64% | 0.72% | 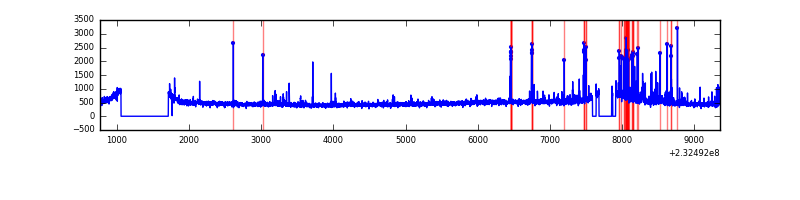 |
| C | 8587 | 7670 | 0 | 0 | 0.00% | 0.00% |  |
| D | 8587 | 7670 | 447 | 447 | 5.21% | 5.83% | 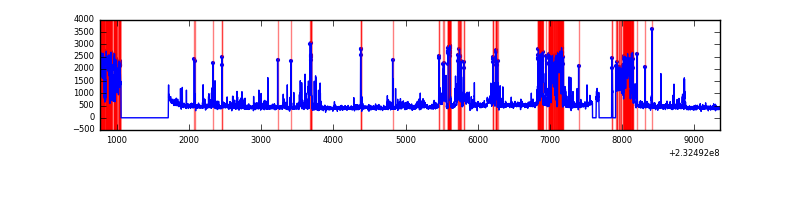 |
Top three noisy pixels from each quadrant. If the there are fewer than three noisy pixels in the level2.evt file, extra rows are filled as -1
| Pixel properties | Quadrant properties | ||||||
|---|---|---|---|---|---|---|---|
| Quadrant | DetID | PixID | Counts | Sigma | Mean | Median | Sigma |
| A | 8 | 5 | 345494 | 1803.22 | 931 | 909 | 191.1 |
| A | 13 | 251 | 14433 | 70.77 | 931 | 909 | 191.1 |
| A | 5 | 16 | 12230 | 59.24 | 931 | 909 | 191.1 |
| B | 10 | 16 | 204475 | 1138.83 | 928 | 905 | 178.8 |
| B | 5 | 255 | 84971 | 470.29 | 928 | 905 | 178.8 |
| B | 0 | 231 | 56281 | 309.79 | 928 | 905 | 178.8 |
| C | 8 | 128 | 13315 | 59.25 | 898 | 899 | 209.5 |
| C | 8 | 112 | 7184 | 29.99 | 898 | 899 | 209.5 |
| C | 13 | 61 | 6847 | 28.39 | 898 | 899 | 209.5 |
| D | 2 | 16 | 758192 | 3494.66 | 854 | 831 | 216.7 |
| D | 1 | 52 | 614208 | 2830.28 | 854 | 831 | 216.7 |
| D | 2 | 14 | 359844 | 1656.58 | 854 | 831 | 216.7 |
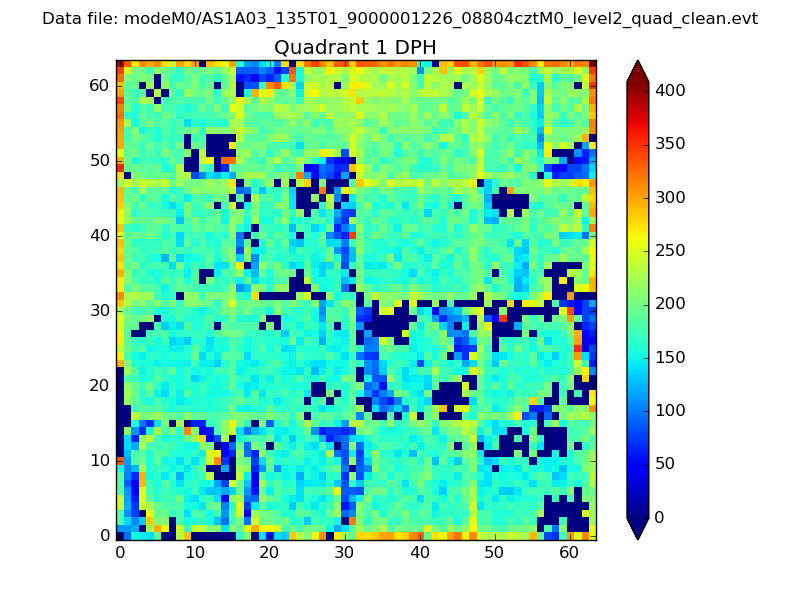
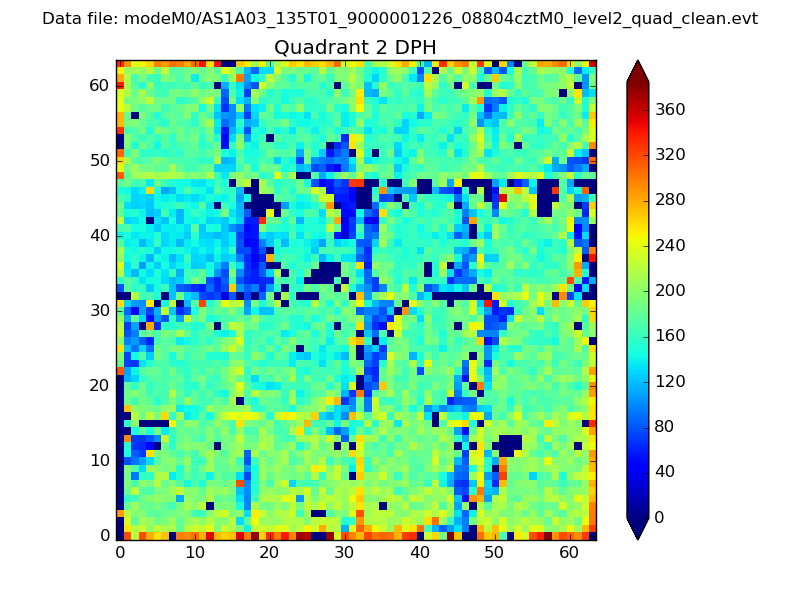
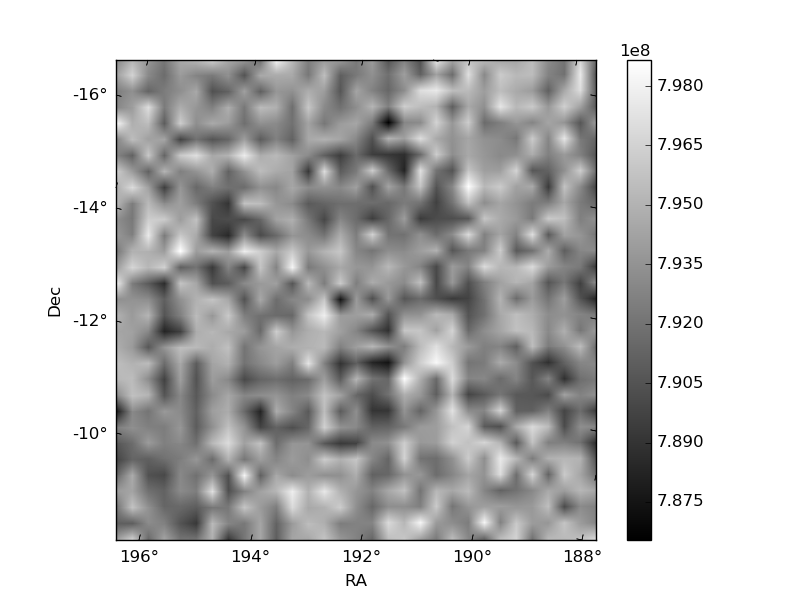
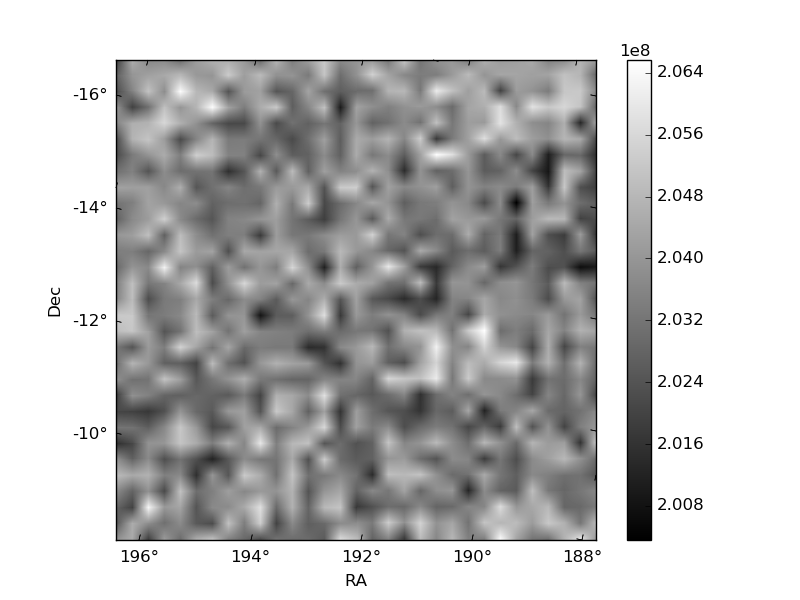
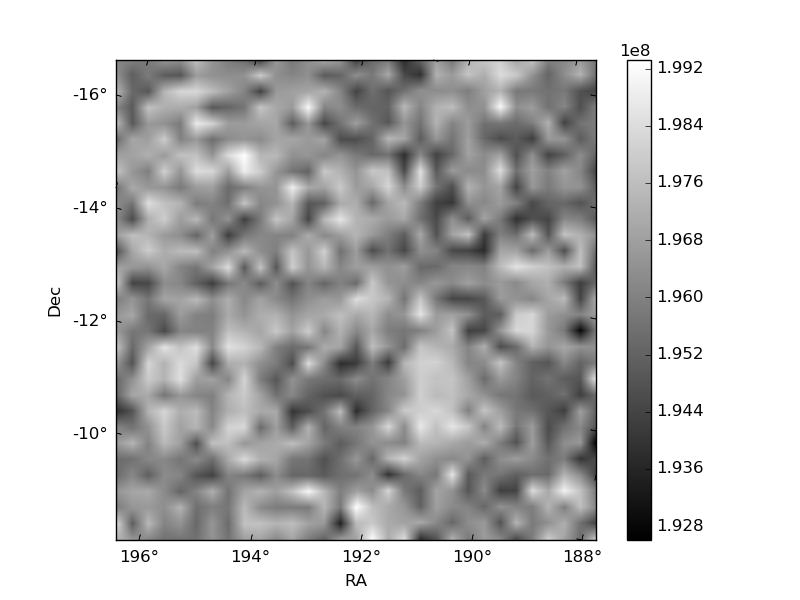
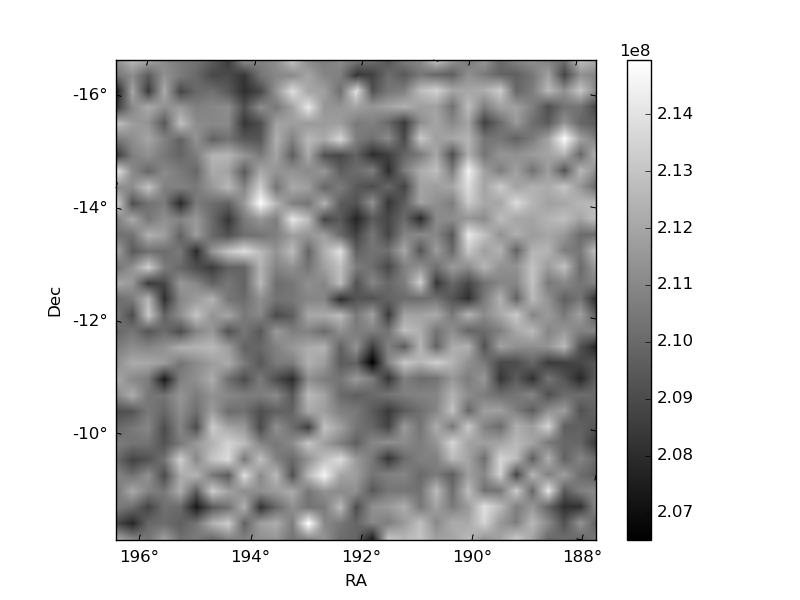
Histogram calculated using DETX and DETY for each event in the final _common_clean file
| Quadrant A | 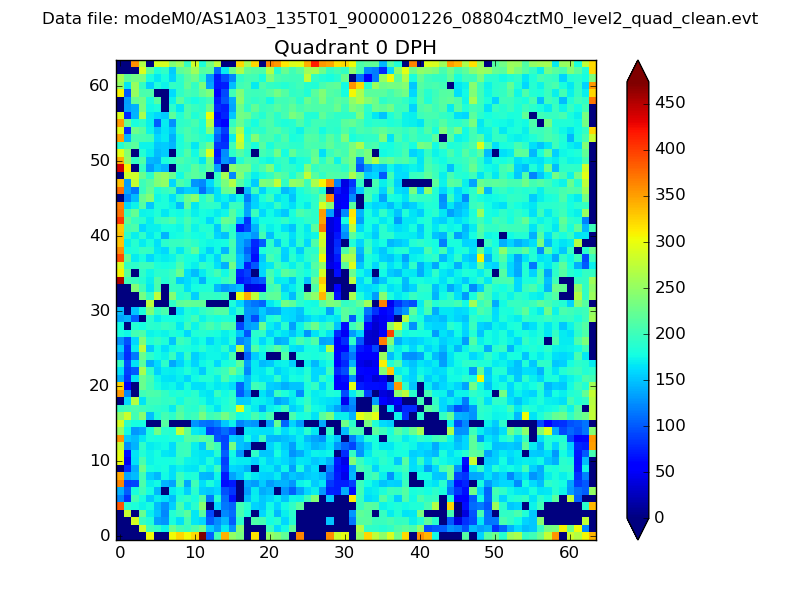 |
 |
Quadrant B |
|---|---|---|---|
| Quadrant D | 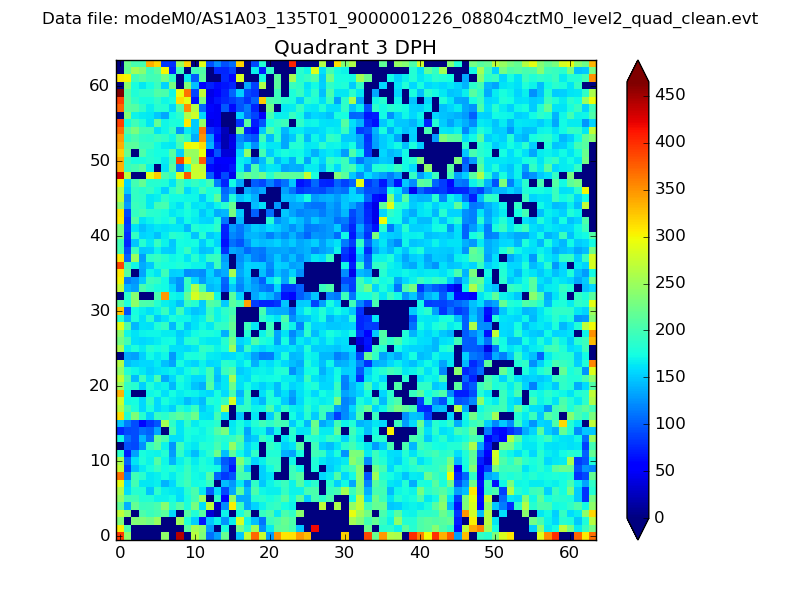 |
 |
Quadrant C |
| Plot type | Count rate plots | Images |
|---|---|---|
| Comparison with Poisson distribution Blue bars denote a histogram of data divided into 1 sec bins. Red curve is a Poisson curve with rate = median count rate of data. |
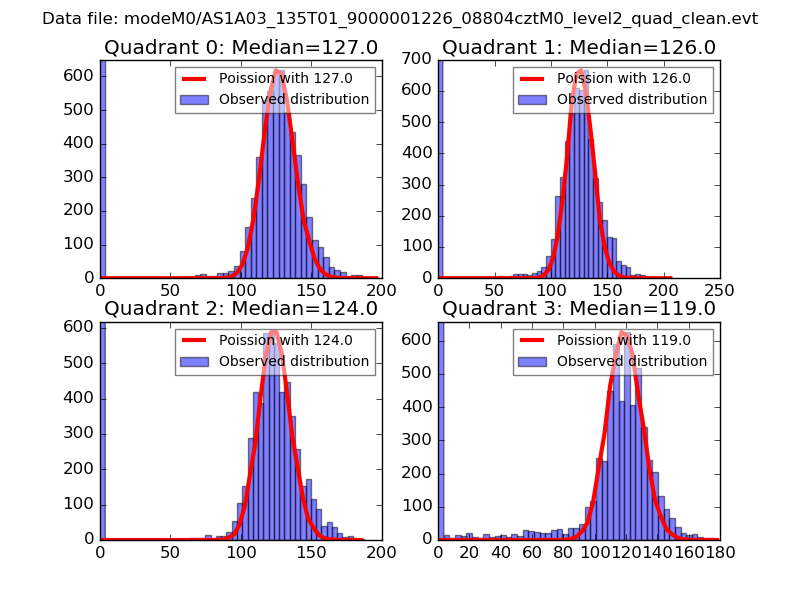 |
 |
| Quadrant-wise count rates Data is divided into 100 sec bins |
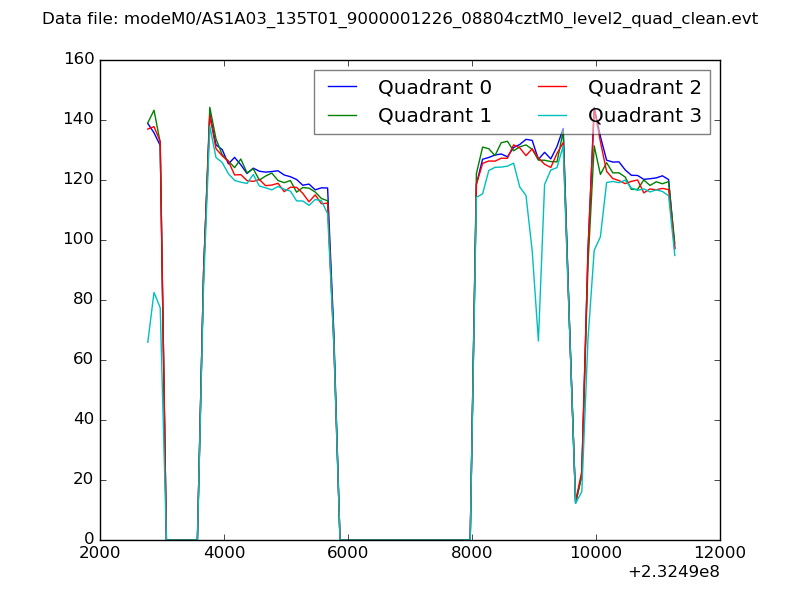 |
|
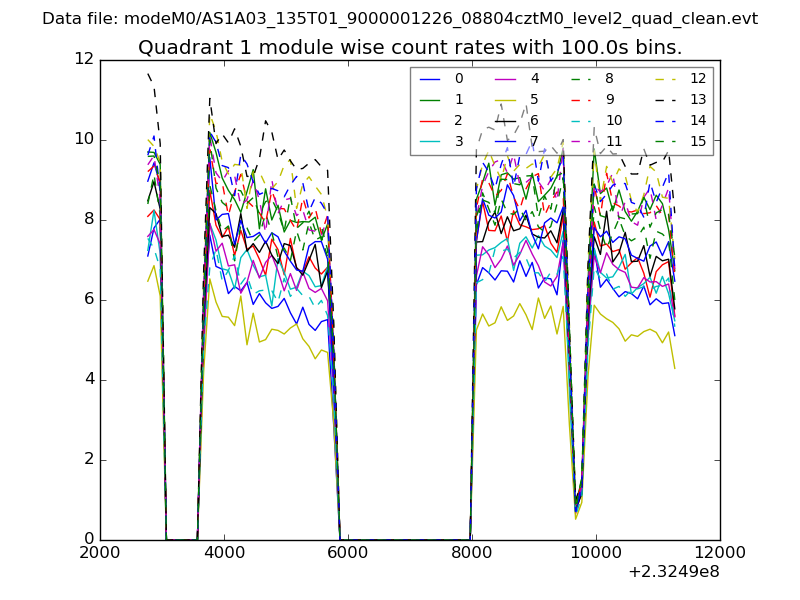
| Module-wise count rates for Quadrant A Data is divided into 100 sec bins |
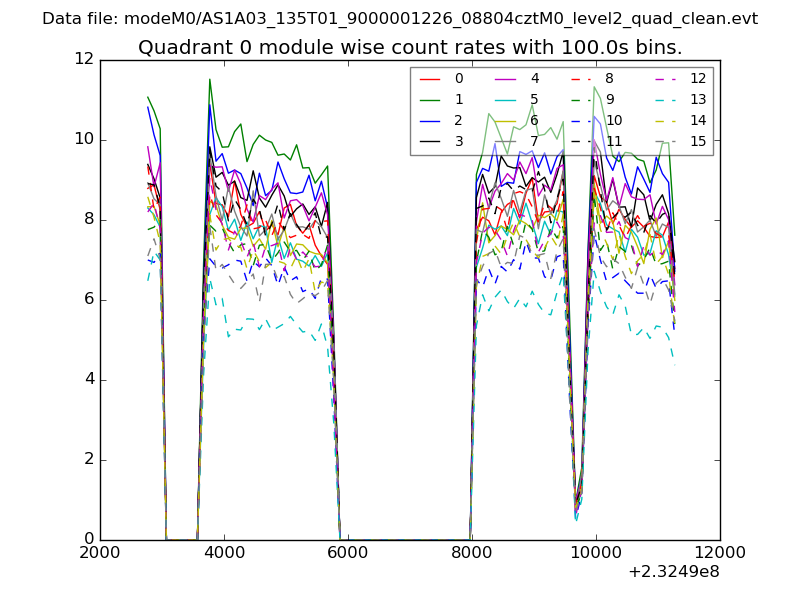 |
 |
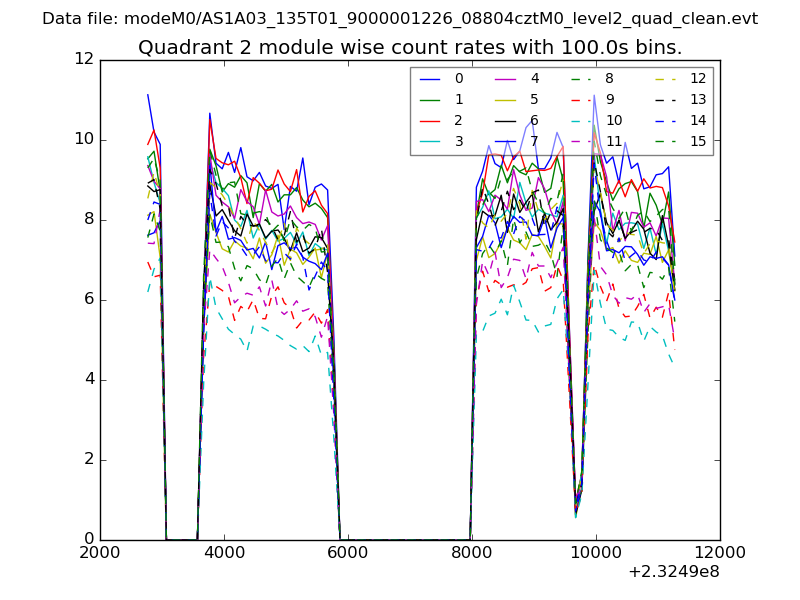
| Module-wise count rates for Quadrant B Data is divided into 100 sec bins |
 |
 |
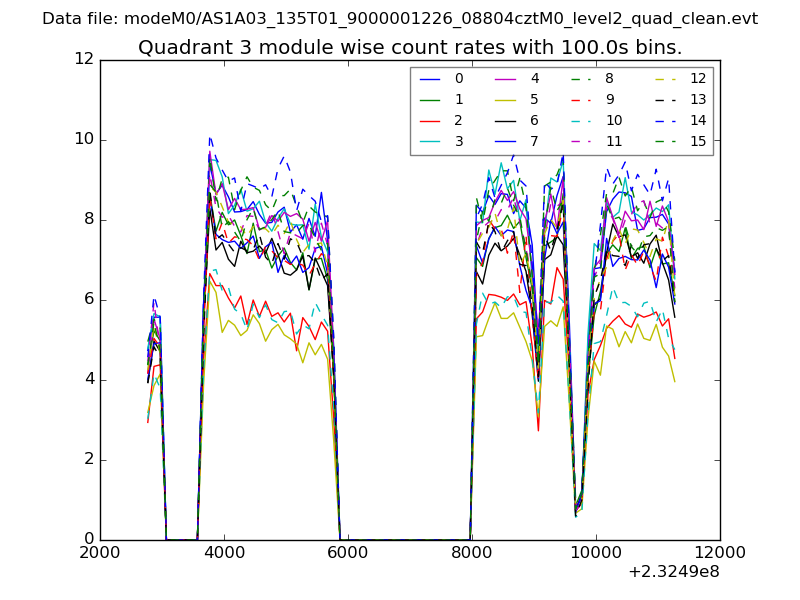
| Module-wise count rates for Quadrant C Data is divided into 100 sec bins |
 |
 |
| Module-wise count rates for Quadrant D Data is divided into 100 sec bins |
 |
 |
| Parameter | Plot |
|---|---|
| CZT HV Monitor | 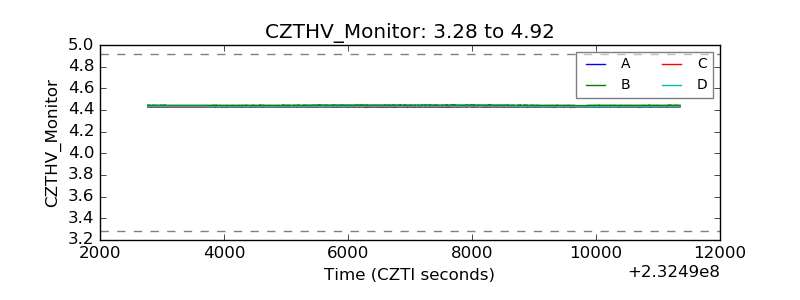 |
| D_VDD | 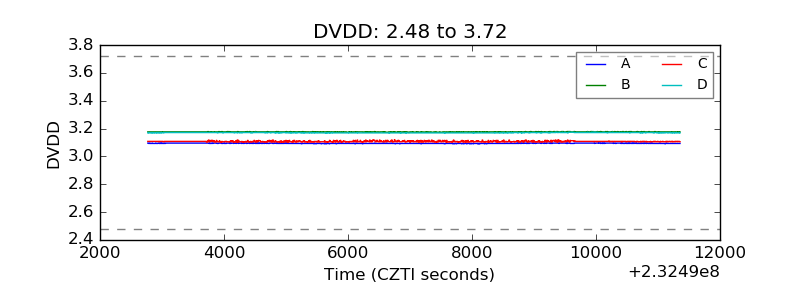 |
| Temperature 1 | 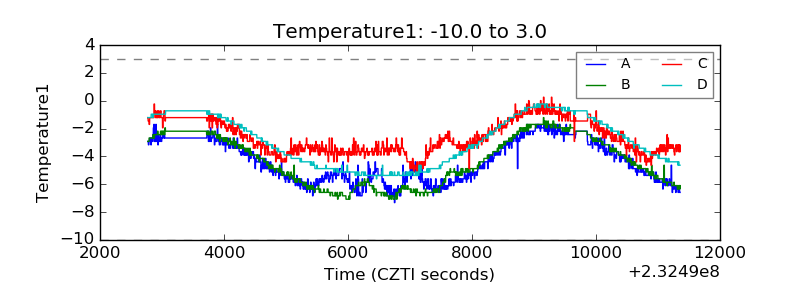 |
| Veto HV Monitor | 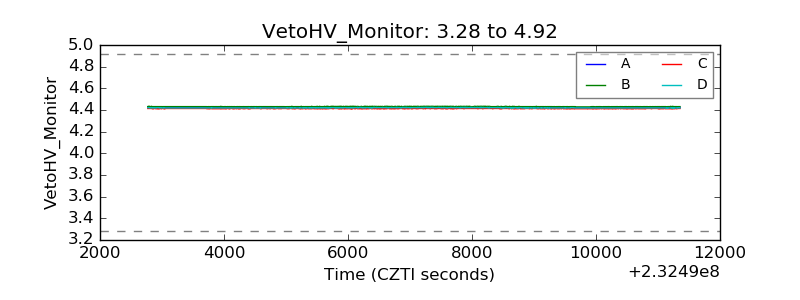 |
| Veto LLD | 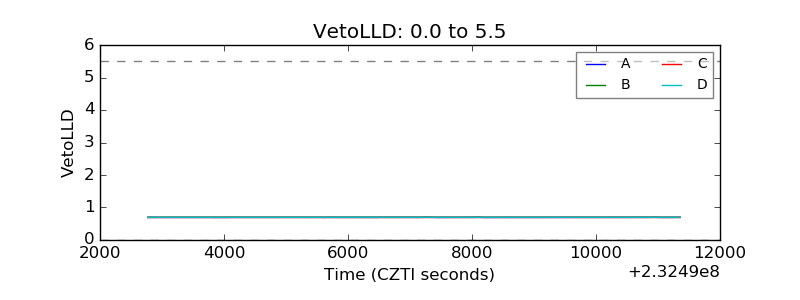 |
| Alpha Counter | 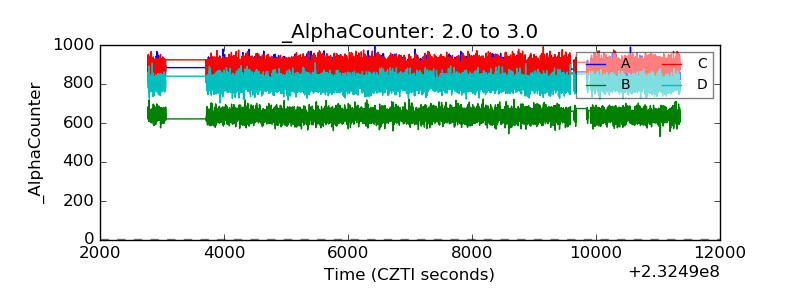 |
| _CPM_Rate | 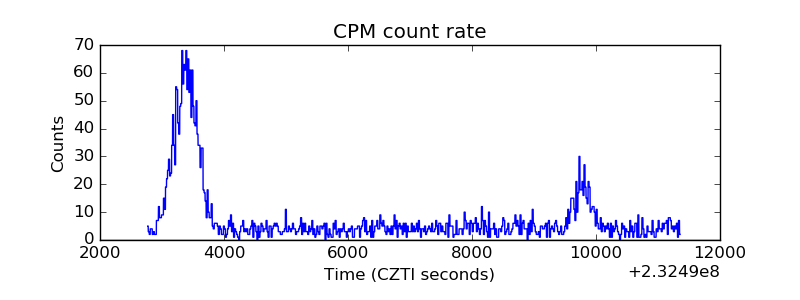 |
| CZT Counter | 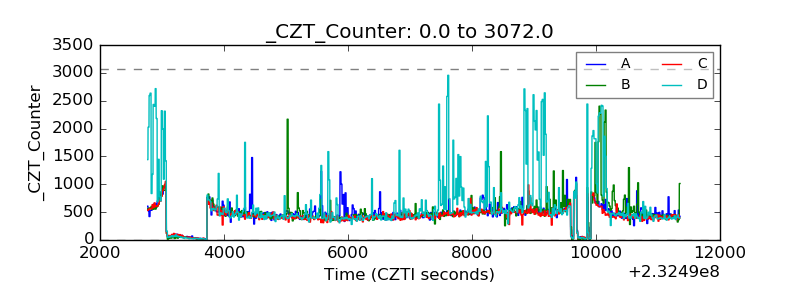 |
| +2.5 Volts monitor | 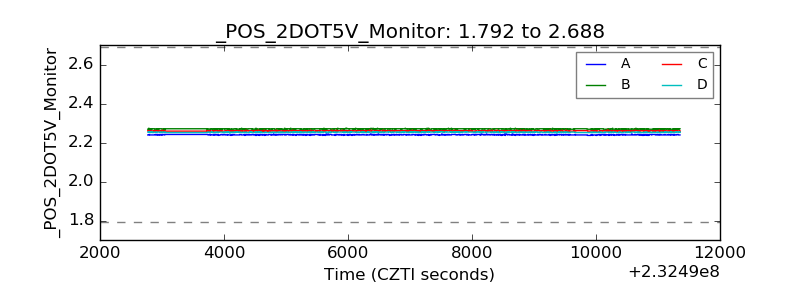 |
| +5 Volts monitor |  |
| _ROLL_ROT | 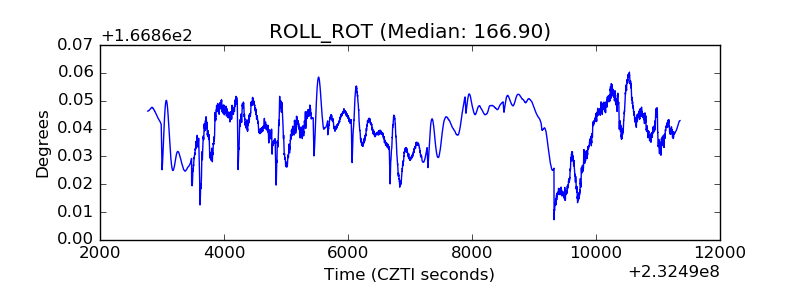 |
| _Roll_DEC | 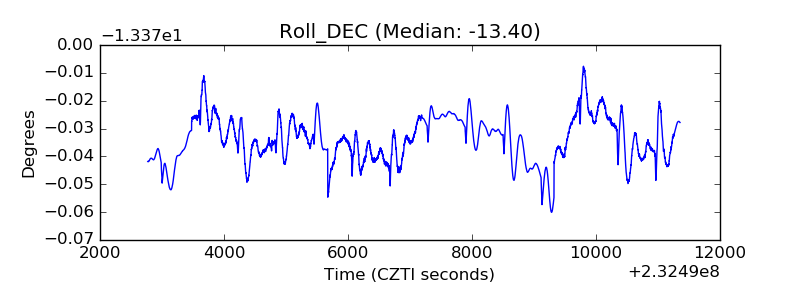 |
| _Roll_RA | 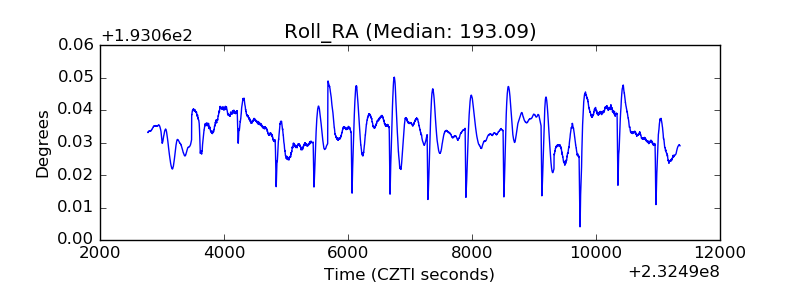 |
| Veto Counter | 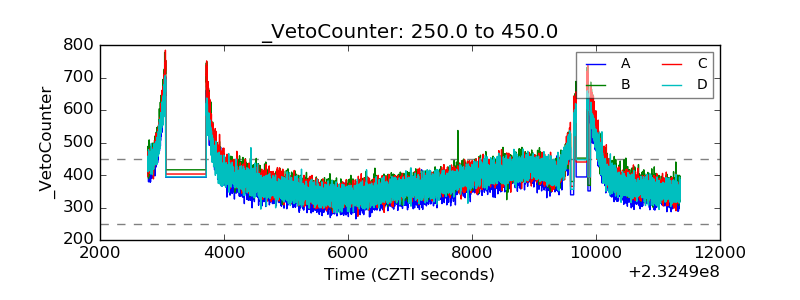 |