| Param | Original file | Final file |
|---|---|---|
| Filename | modeM0/AS1A03_135T01_9000001226_08806cztM0_level2.evt | modeM0/AS1A03_135T01_9000001226_08806cztM0_level2_quad_clean.evt |
| Size (bytes) | 530,009,280 | 85,835,520 |
| Size | 505.5 MB | 81.9 MB |
| Events in quadrant A | 3,889,248 | 530,824 |
| Events in quadrant B | 3,722,728 | 526,653 |
| Events in quadrant C | 3,234,630 | 521,789 |
| Events in quadrant D | 4,707,128 | 509,649 |
| Mode SS | |||
|---|---|---|---|
| Quadrant | BADHDUFLAG | Total packets | Discarded packets |
| A | 0 | 148 | 0 |
| B | 0 | 148 | 0 |
| C | 0 | 148 | 0 |
| D | 0 | 148 | 0 |
| Mode M0 | |||
|---|---|---|---|
| Quadrant | BADHDUFLAG | Total packets | Discarded packets |
| A | 0 | 16171 | 2 |
| B | 0 | 16017 | 8 |
| C | 0 | 14885 | 5 |
| D | 0 | 19047 | 20 |
| Mode M9 | |||
|---|---|---|---|
| Quadrant | BADHDUFLAG | Total packets | Discarded packets |
| A | 0 | 4 | 0 |
| B | 0 | 4 | 0 |
| C | 0 | 4 | 0 |
| D | 0 | 4 | 0 |
| Quadrant | Total seconds | Saturated seconds | Saturation percentage |
|---|---|---|---|
| A | 7336 | 50 | 0.681570% |
| B | 7334 | 143 | 1.949823% |
| C | 7334 | 30 | 0.409054% |
| D | 7331 | 273 | 3.723912% |
Noise dominated data is calculated using 1-second bins in cleaned event files. If a bin has >2000 counts, and if more than 50% of those come from <1% of pixels, then it is considered to be noise-dominated and hence unusable.
| Quadrant | # 1 sec bins | Bins with >0 counts | Bins with >2000 counts | High rate bins dominated by noise | Noise dominated (total time) | Noise dominated (detector-on time) | Marked lightcurve |
|---|---|---|---|---|---|---|---|
| A | 7721 | 7336 | 3 | 3 | 0.04% | 0.04% | 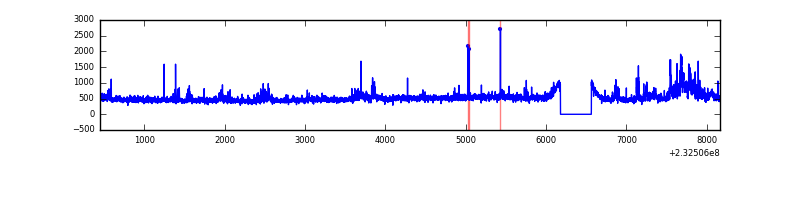 |
| B | 7721 | 7336 | 72 | 72 | 0.93% | 0.98% | 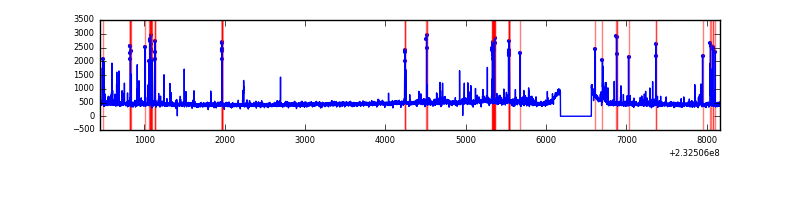 |
| C | 7721 | 7336 | 0 | 0 | 0.00% | 0.00% | 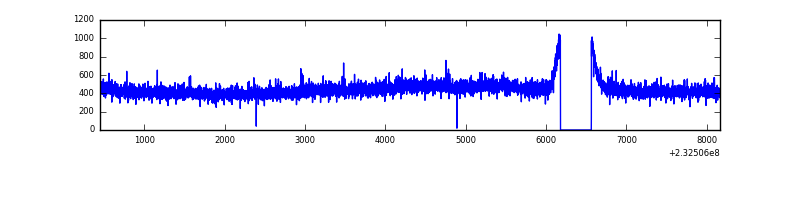 |
| D | 7721 | 7336 | 261 | 261 | 3.38% | 3.56% |  |
Top three noisy pixels from each quadrant. If the there are fewer than three noisy pixels in the level2.evt file, extra rows are filled as -1
| Pixel properties | Quadrant properties | ||||||
|---|---|---|---|---|---|---|---|
| Quadrant | DetID | PixID | Counts | Sigma | Mean | Median | Sigma |
| A | 8 | 5 | 529486 | 3028.91 | 854 | 836 | 174.5 |
| A | 13 | 251 | 33564 | 187.52 | 854 | 836 | 174.5 |
| A | 13 | 248 | 28390 | 157.87 | 854 | 836 | 174.5 |
| B | 10 | 16 | 330142 | 1985.9 | 854 | 834 | 165.8 |
| B | 0 | 214 | 32250 | 189.45 | 854 | 834 | 165.8 |
| B | 12 | 111 | 17828 | 102.48 | 854 | 834 | 165.8 |
| C | 1 | 16 | 7573 | 35.17 | 823 | 828 | 191.8 |
| C | 13 | 61 | 6295 | 28.51 | 823 | 828 | 191.8 |
| C | 8 | 128 | 5104 | 22.3 | 823 | 828 | 191.8 |
| D | 2 | 14 | 769895 | 3615.87 | 808 | 787 | 212.7 |
| D | 2 | 16 | 550609 | 2584.92 | 808 | 787 | 212.7 |
| D | 2 | 152 | 133462 | 623.76 | 808 | 787 | 212.7 |
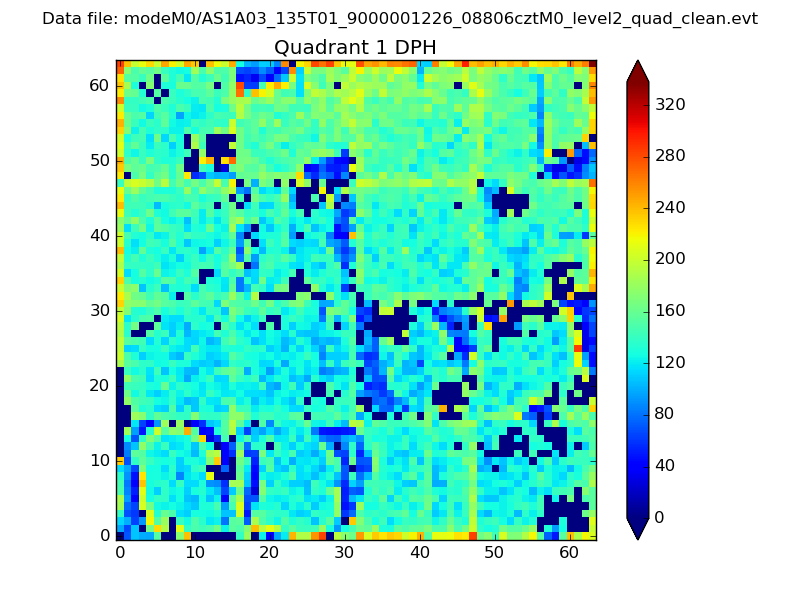
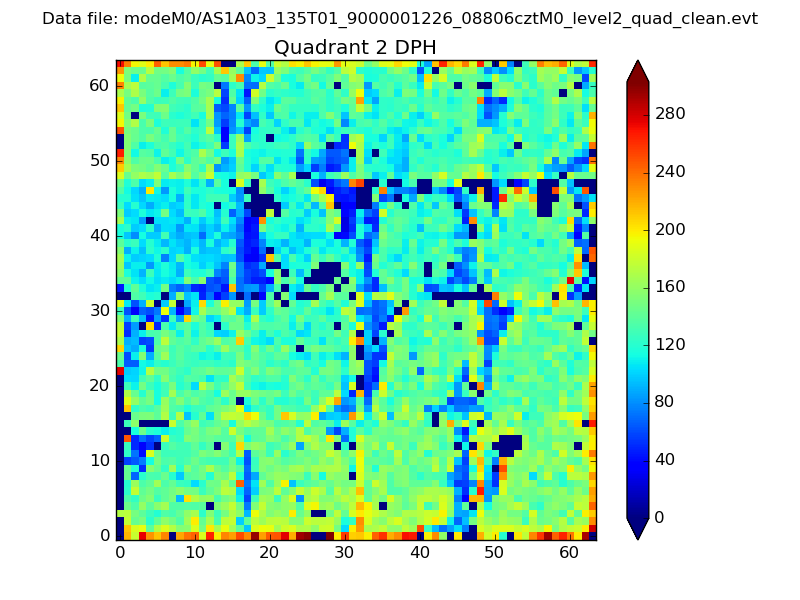
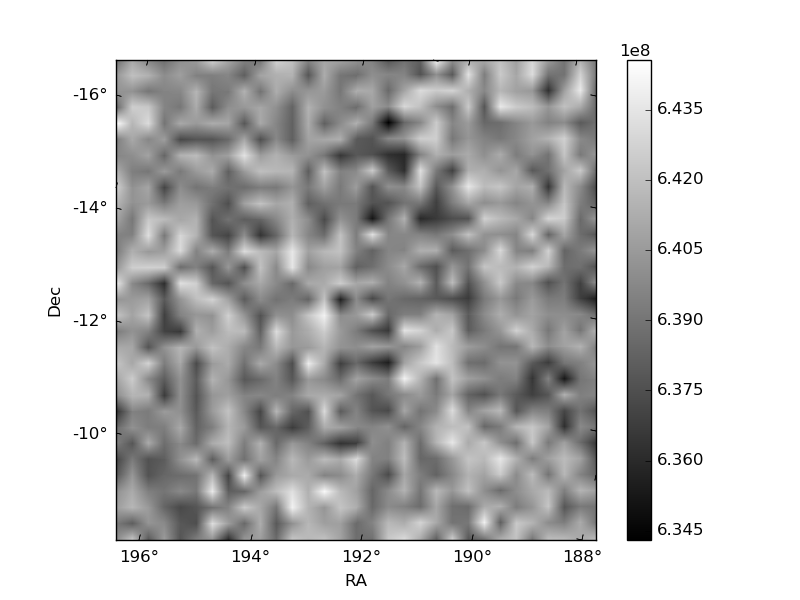
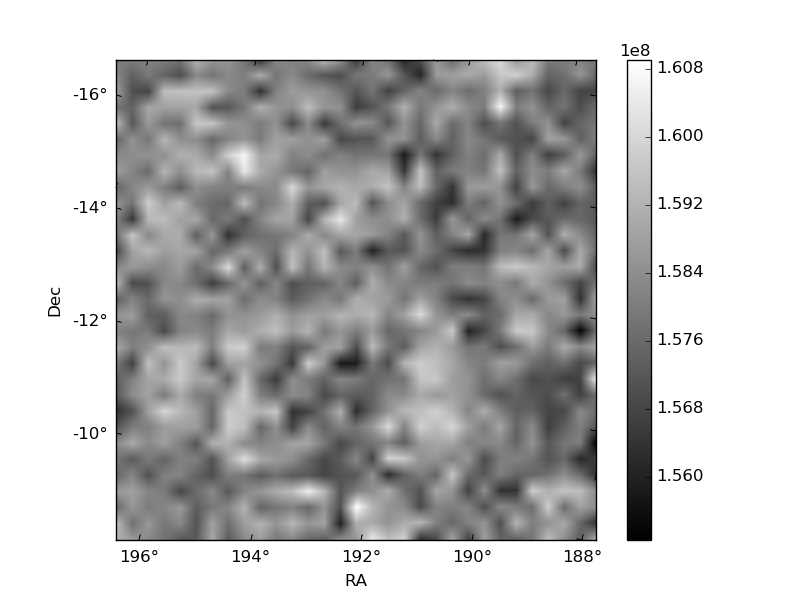
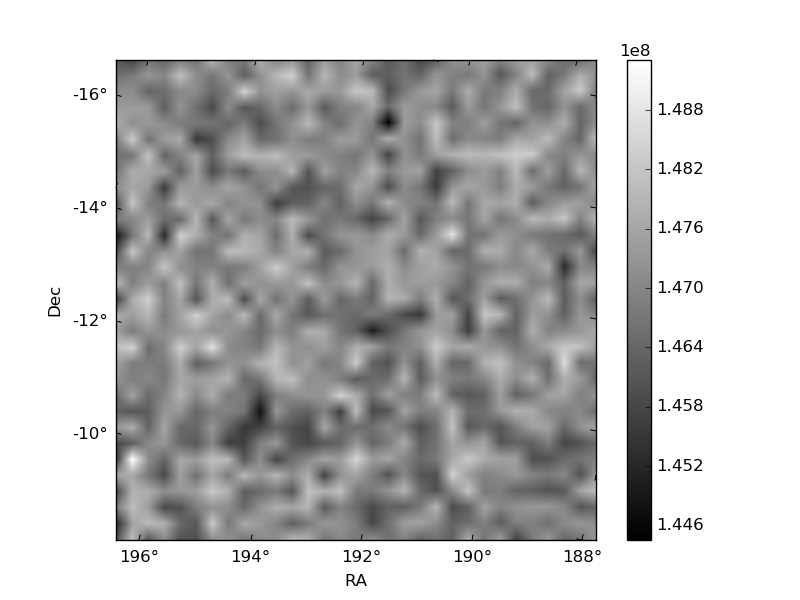
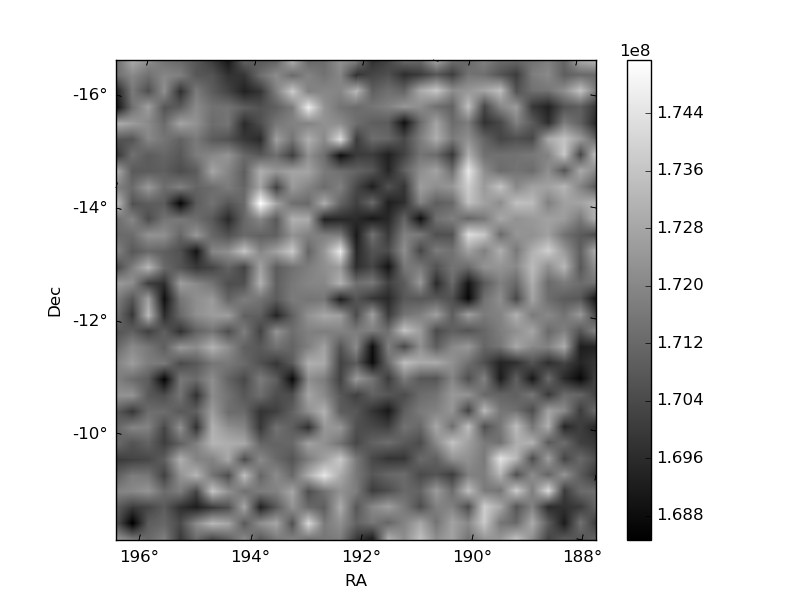
Histogram calculated using DETX and DETY for each event in the final _common_clean file
| Quadrant A | 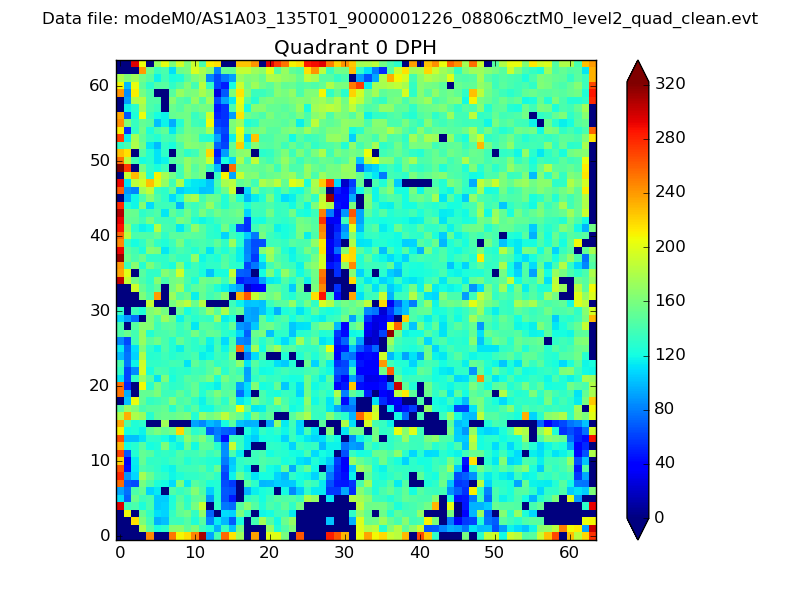 |
 |
Quadrant B |
|---|---|---|---|
| Quadrant D | 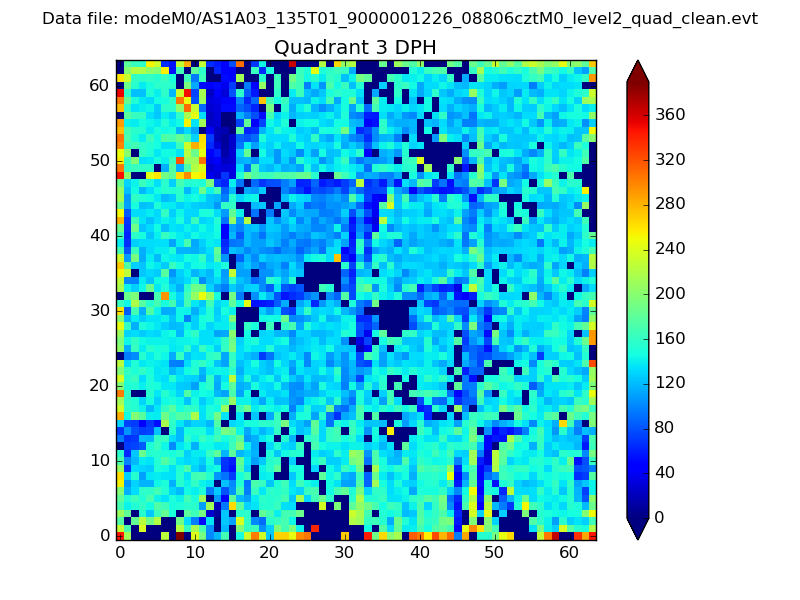 |
 |
Quadrant C |
| Plot type | Count rate plots | Images |
|---|---|---|
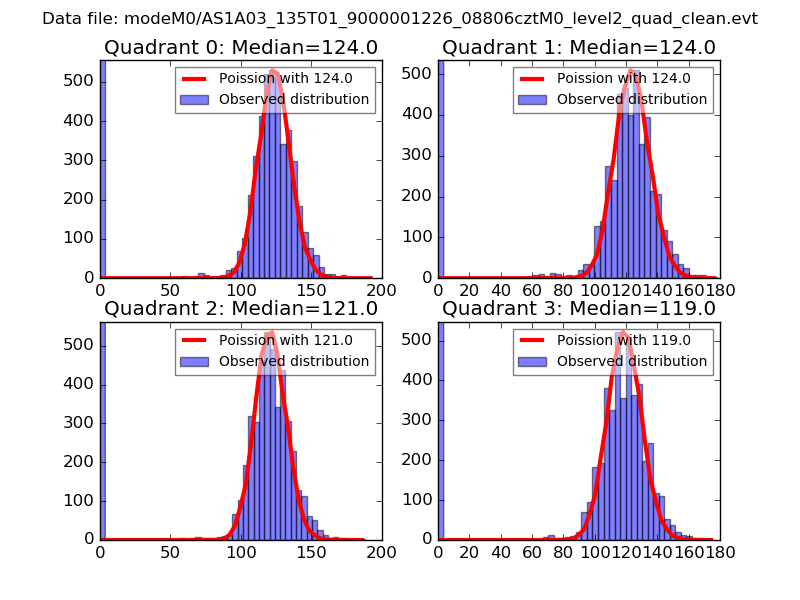
| Comparison with Poisson distribution Blue bars denote a histogram of data divided into 1 sec bins. Red curve is a Poisson curve with rate = median count rate of data. |
 |
 |
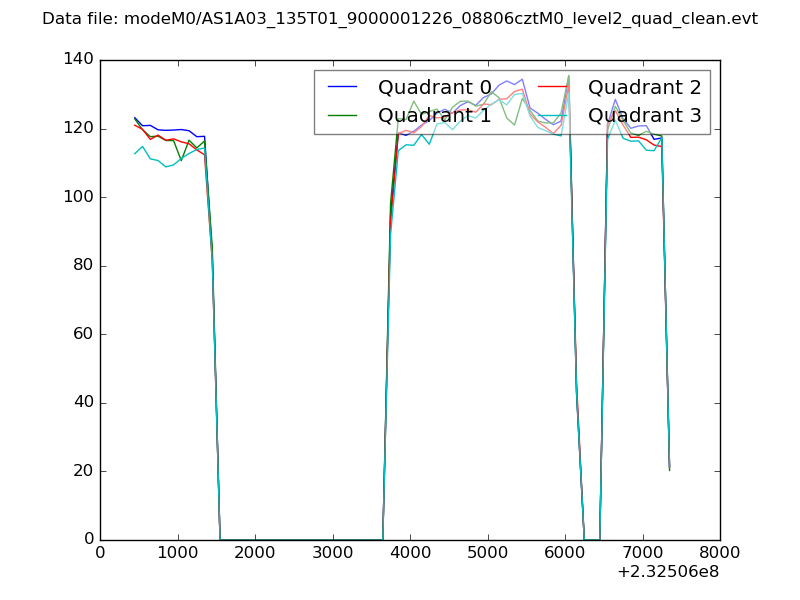
| Quadrant-wise count rates Data is divided into 100 sec bins |
 |
|
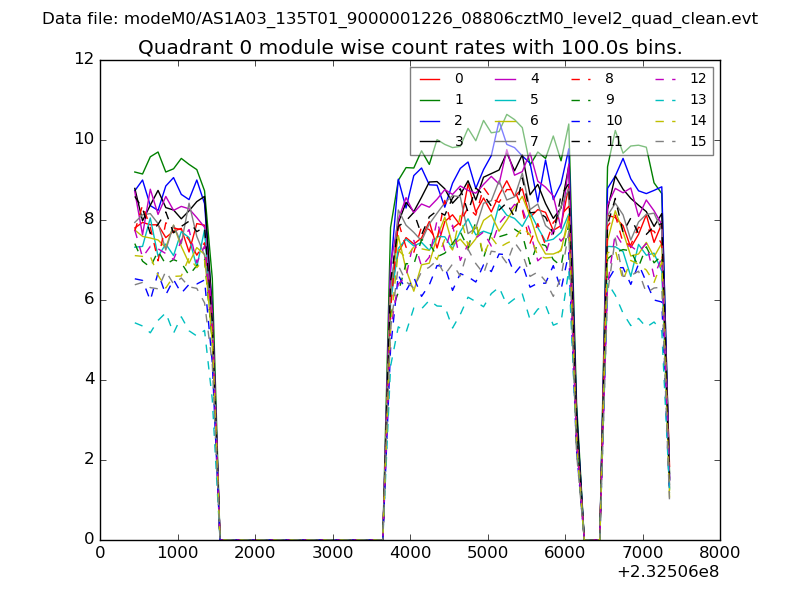
| Module-wise count rates for Quadrant A Data is divided into 100 sec bins |
 |
 |
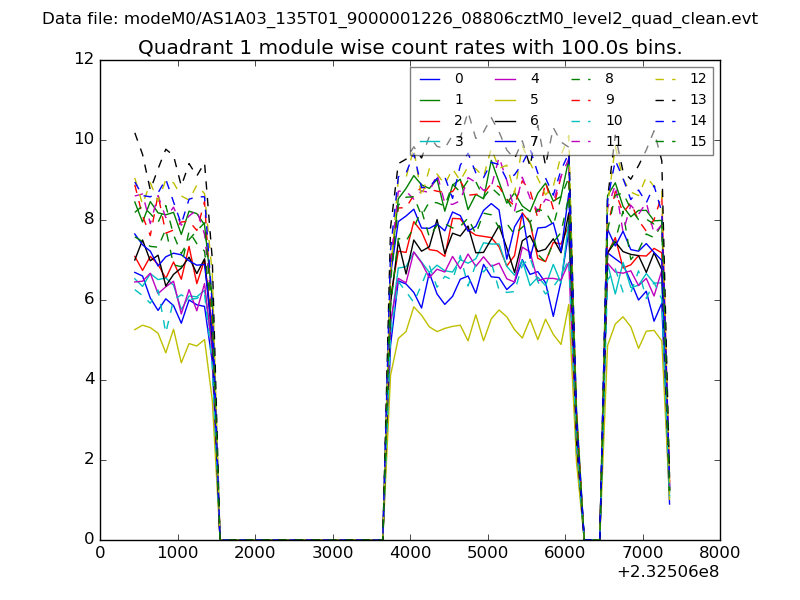
| Module-wise count rates for Quadrant B Data is divided into 100 sec bins |
 |
 |
| Module-wise count rates for Quadrant C Data is divided into 100 sec bins |
 |
 |
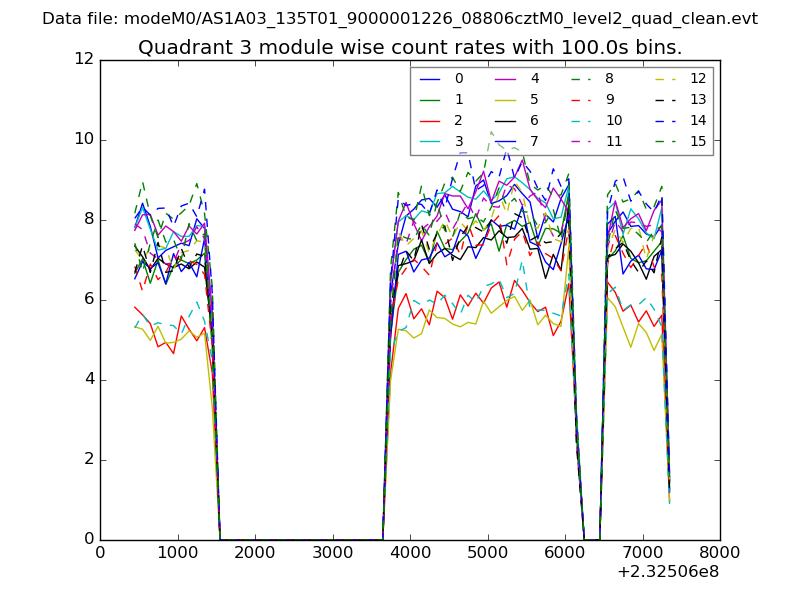
| Module-wise count rates for Quadrant D Data is divided into 100 sec bins |
 |
 |
| Parameter | Plot |
|---|---|
| CZT HV Monitor | 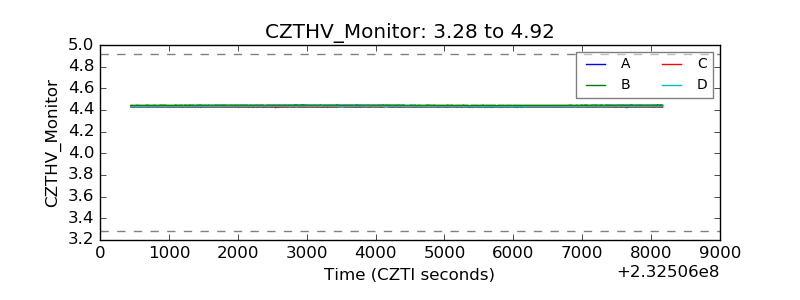 |
| D_VDD | 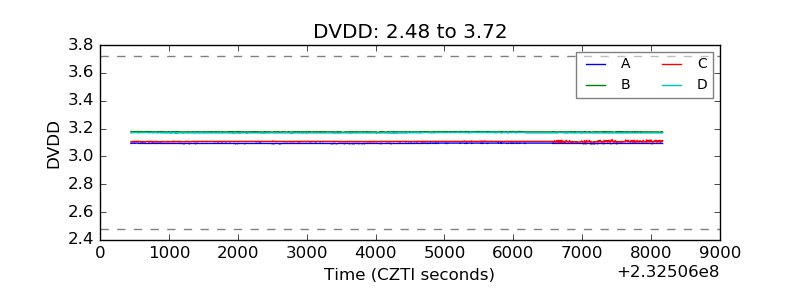 |
| Temperature 1 | 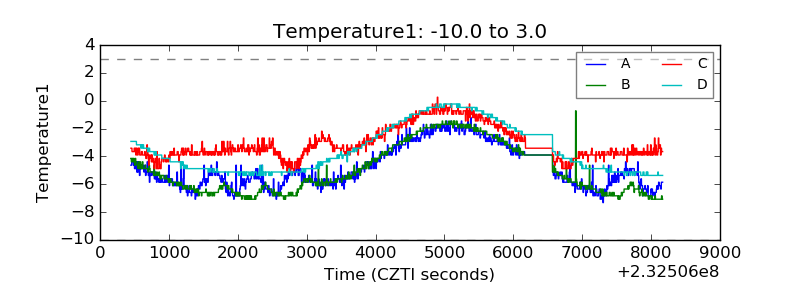 |
| Veto HV Monitor | 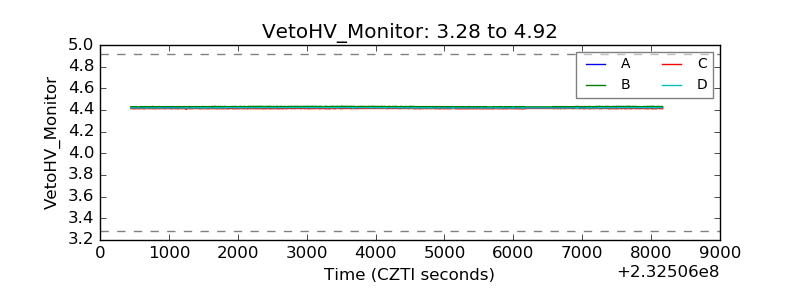 |
| Veto LLD | 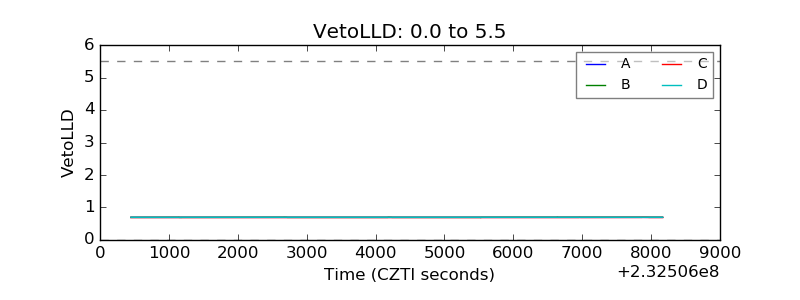 |
| Alpha Counter | 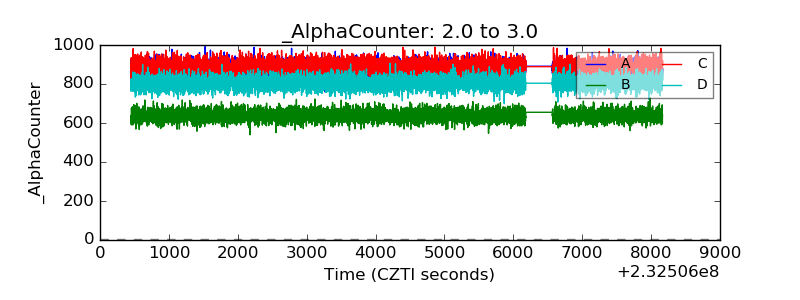 |
| _CPM_Rate | 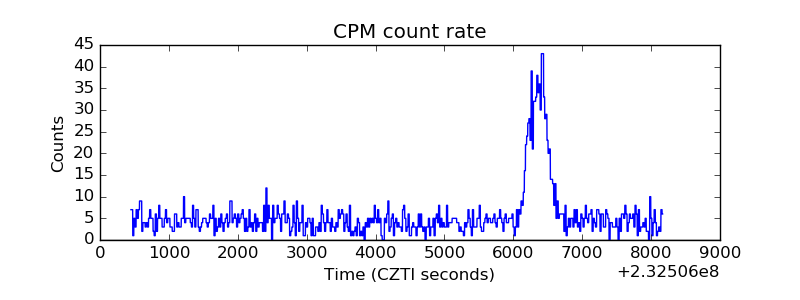 |
| CZT Counter | 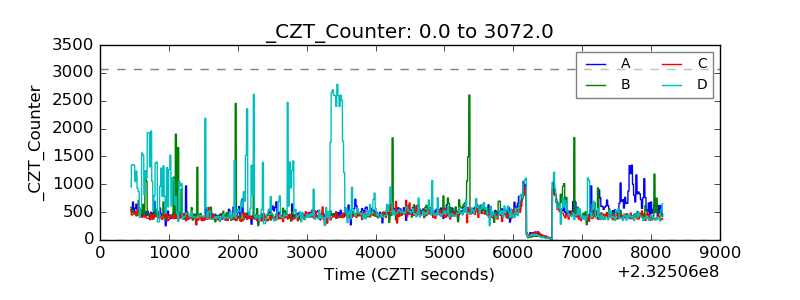 |
| +2.5 Volts monitor |  |
| +5 Volts monitor |  |
| _ROLL_ROT | 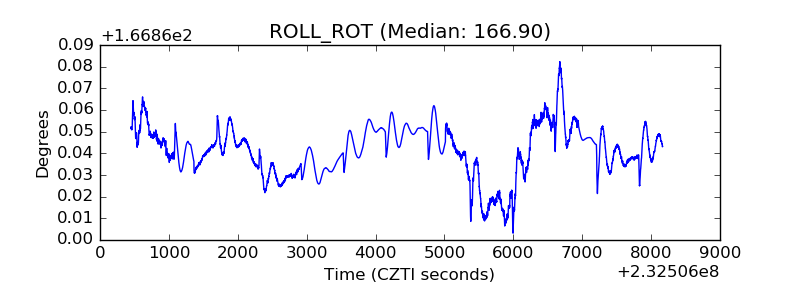 |
| _Roll_DEC | 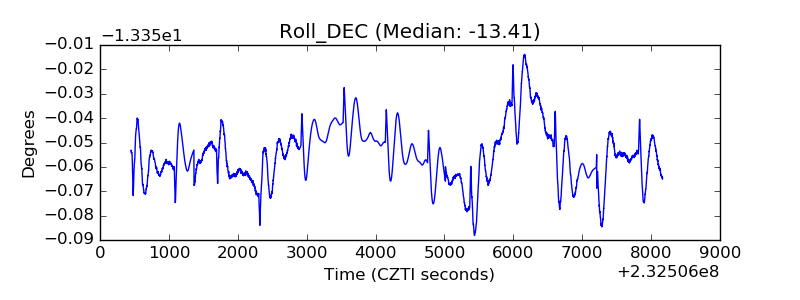 |
| _Roll_RA | 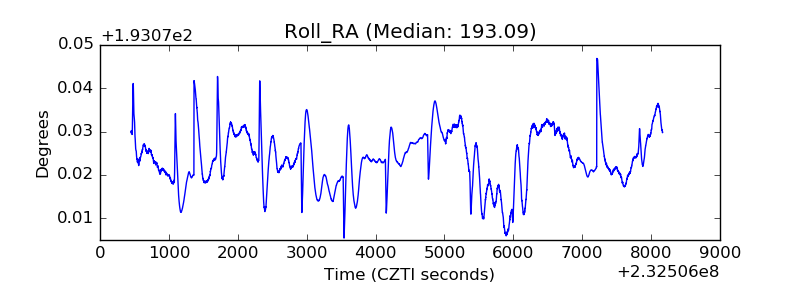 |
| Veto Counter | 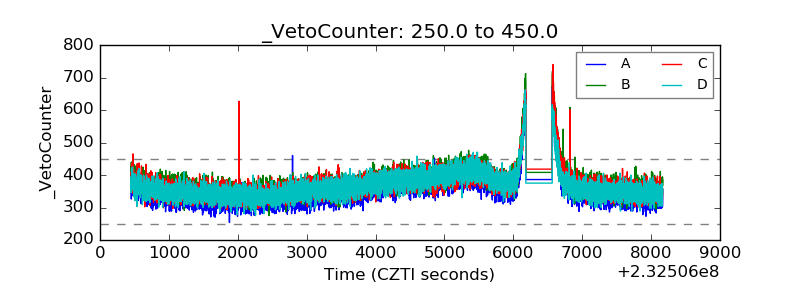 |