| Param | Original file | Final file |
|---|---|---|
| Filename | modeM0/AS1A03_135T01_9000001226_08808cztM0_level2.evt | modeM0/AS1A03_135T01_9000001226_08808cztM0_level2_quad_clean.evt |
| Size (bytes) | 893,324,160 | 141,635,520 |
| Size | 851.9 MB | 135.1 MB |
| Events in quadrant A | 7,787,117 | 854,627 |
| Events in quadrant B | 6,505,436 | 864,767 |
| Events in quadrant C | 5,699,554 | 853,775 |
| Events in quadrant D | 6,201,473 | 838,089 |
| Mode SS | |||
|---|---|---|---|
| Quadrant | BADHDUFLAG | Total packets | Discarded packets |
| A | 0 | 278 | 12 |
| B | 0 | 278 | 10 |
| C | 0 | 278 | 10 |
| D | 0 | 278 | 20 |
| Mode M0 | |||
|---|---|---|---|
| Quadrant | BADHDUFLAG | Total packets | Discarded packets |
| A | 0 | 33562 | 2100 |
| B | 0 | 29784 | 2058 |
| C | 0 | 27526 | 1647 |
| D | 0 | 29301 | 1893 |
| Mode M9 | |||
|---|---|---|---|
| Quadrant | BADHDUFLAG | Total packets | Discarded packets |
| A | 0 | 17 | 0 |
| B | 0 | 17 | 0 |
| C | 0 | 17 | 1 |
| D | 0 | 17 | 0 |
| Quadrant | Total seconds | Saturated seconds | Saturation percentage |
|---|---|---|---|
| A | 12641 | 152 | 1.202437% |
| B | 12699 | 267 | 2.102528% |
| C | 12695 | 73 | 0.575030% |
| D | 12676 | 120 | 0.946671% |
Noise dominated data is calculated using 1-second bins in cleaned event files. If a bin has >2000 counts, and if more than 50% of those come from <1% of pixels, then it is considered to be noise-dominated and hence unusable.
| Quadrant | # 1 sec bins | Bins with >0 counts | Bins with >2000 counts | High rate bins dominated by noise | Noise dominated (total time) | Noise dominated (detector-on time) | Marked lightcurve |
|---|---|---|---|---|---|---|---|
| A | 15227 | 13232 | 20 | 20 | 0.13% | 0.15% | 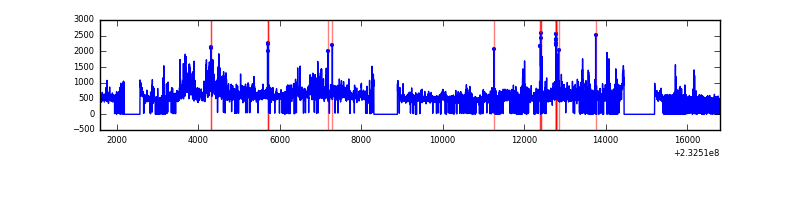 |
| B | 15228 | 13235 | 95 | 95 | 0.62% | 0.72% | 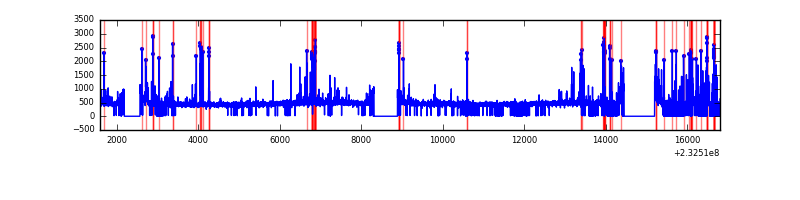 |
| C | 15225 | 13262 | 0 | 0 | 0.00% | 0.00% | 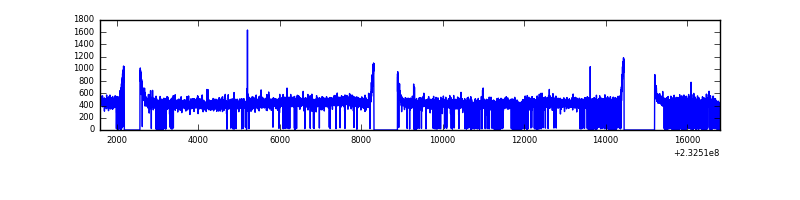 |
| D | 15227 | 13267 | 38 | 38 | 0.25% | 0.29% | 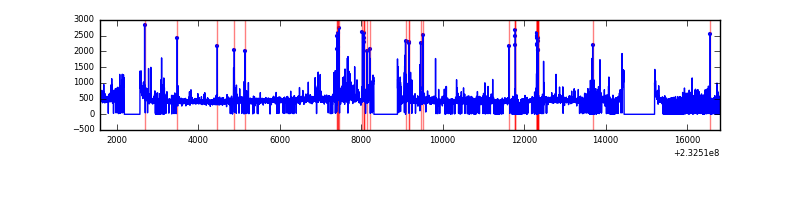 |
Top three noisy pixels from each quadrant. If the there are fewer than three noisy pixels in the level2.evt file, extra rows are filled as -1
| Pixel properties | Quadrant properties | ||||||
|---|---|---|---|---|---|---|---|
| Quadrant | DetID | PixID | Counts | Sigma | Mean | Median | Sigma |
| A | 8 | 5 | 1902829 | 6266.94 | 1494 | 1462 | 303.4 |
| A | 15 | 174 | 54060 | 173.36 | 1494 | 1462 | 303.4 |
| A | 5 | 16 | 39037 | 123.85 | 1494 | 1462 | 303.4 |
| B | 10 | 16 | 520630 | 1812.5 | 1501 | 1463 | 286.4 |
| B | 0 | 214 | 62587 | 213.39 | 1501 | 1463 | 286.4 |
| B | 5 | 255 | 50011 | 169.49 | 1501 | 1463 | 286.4 |
| C | 1 | 16 | 13394 | 35.28 | 1451 | 1460 | 338.3 |
| C | 13 | 61 | 11100 | 28.5 | 1451 | 1460 | 338.3 |
| C | 12 | 4 | 10068 | 25.45 | 1451 | 1460 | 338.3 |
| D | 2 | 152 | 299098 | 806.04 | 1441 | 1405 | 369.3 |
| D | 2 | 14 | 114734 | 306.85 | 1441 | 1405 | 369.3 |
| D | 7 | 71 | 109464 | 292.58 | 1441 | 1405 | 369.3 |
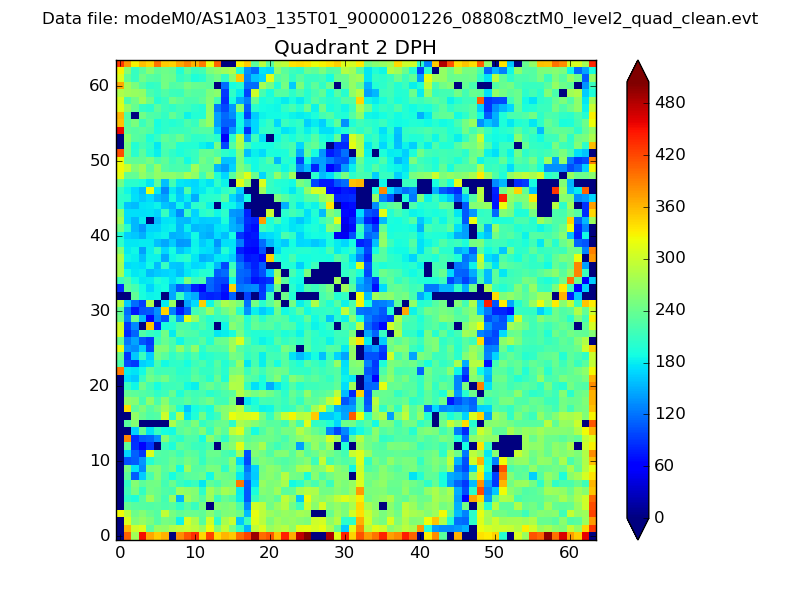
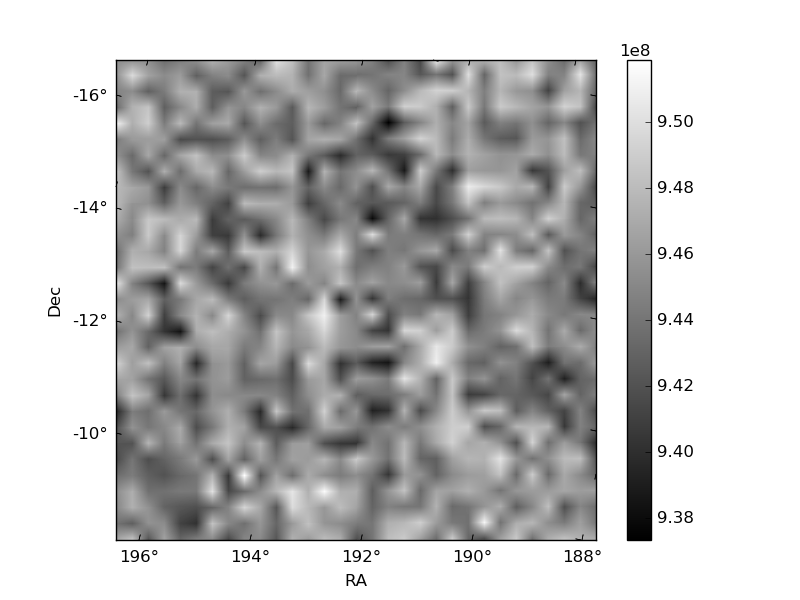
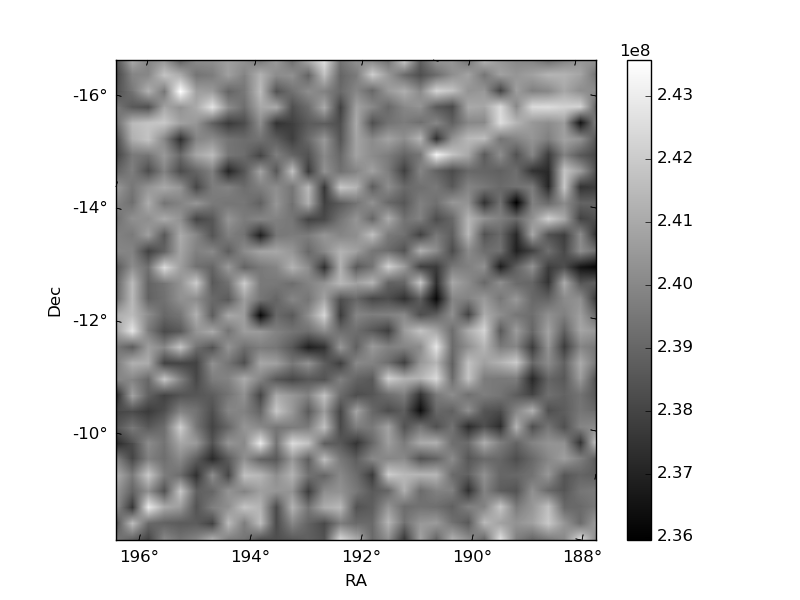
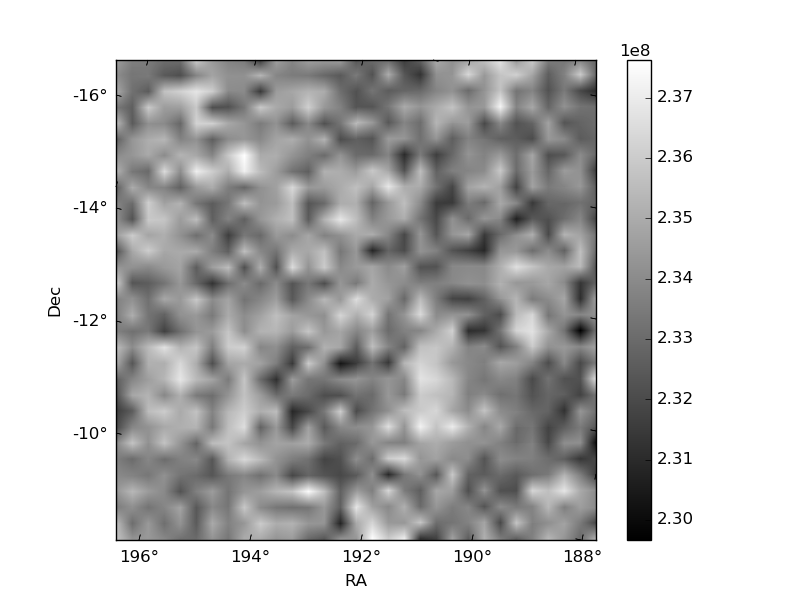
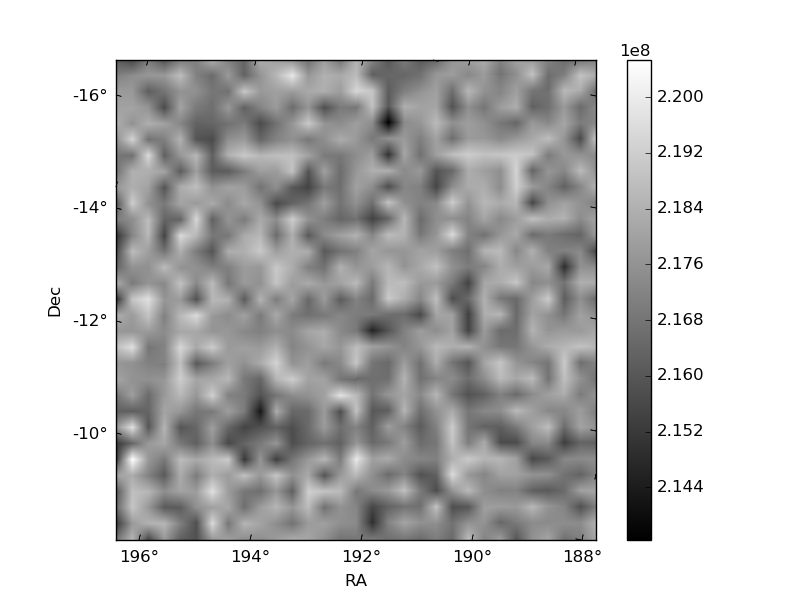
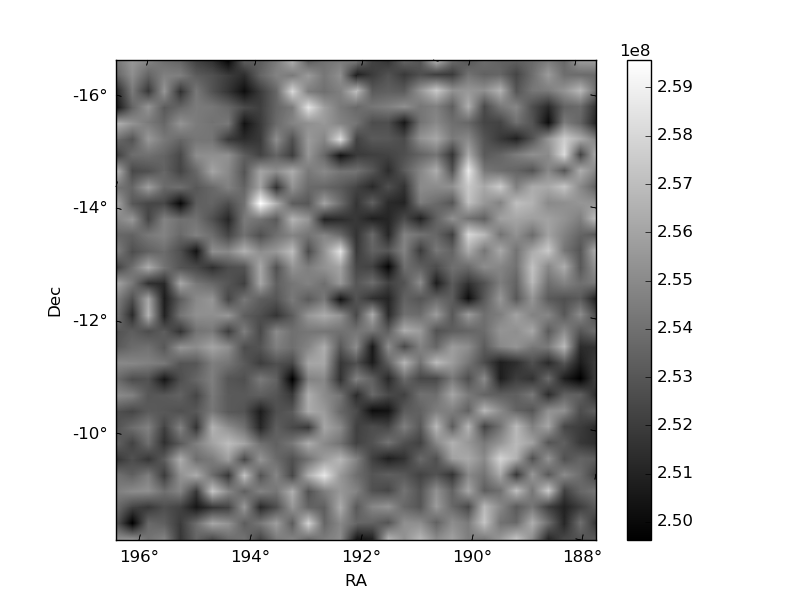
Histogram calculated using DETX and DETY for each event in the final _common_clean file
| Quadrant A | 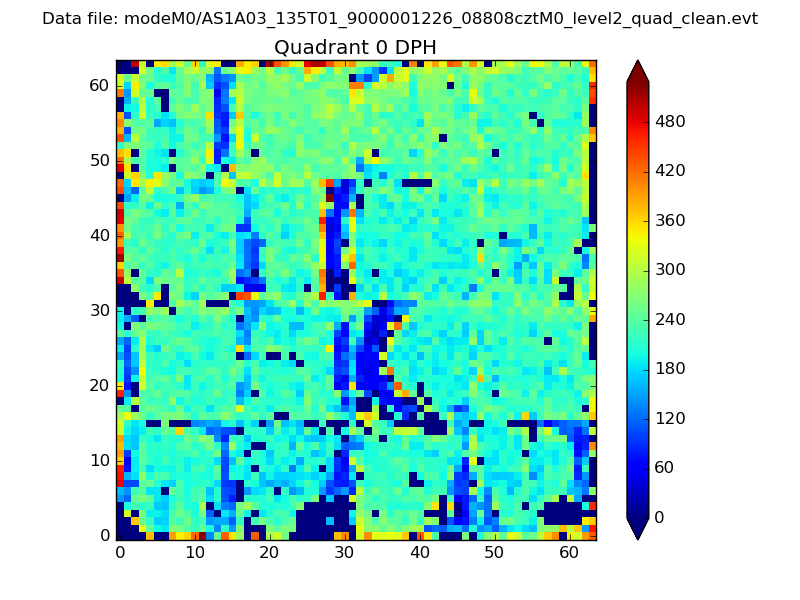 |
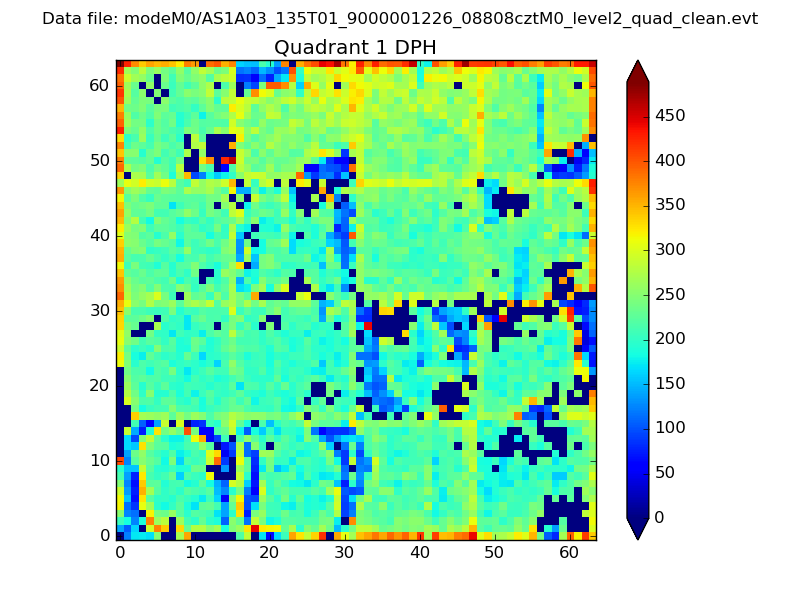 |
Quadrant B |
|---|---|---|---|
| Quadrant D | 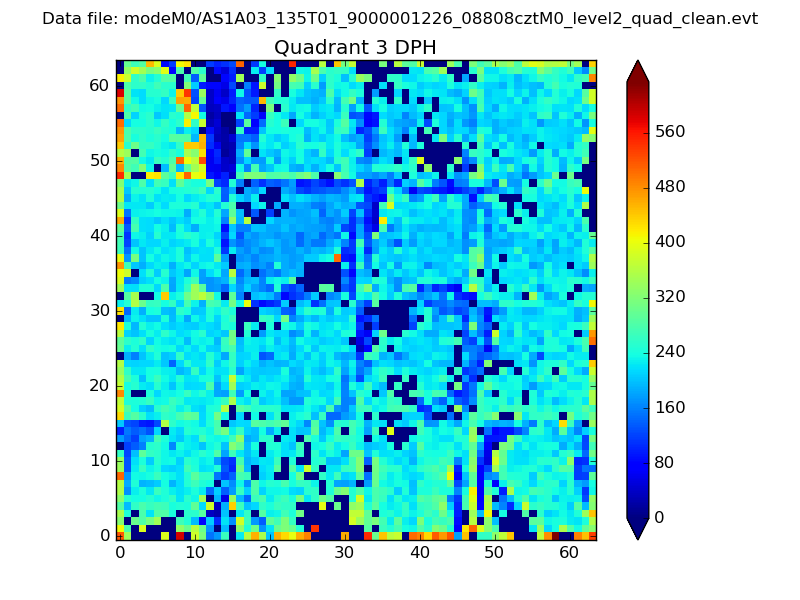 |
 |
Quadrant C |
| Plot type | Count rate plots | Images |
|---|---|---|
| Comparison with Poisson distribution Blue bars denote a histogram of data divided into 1 sec bins. Red curve is a Poisson curve with rate = median count rate of data. |
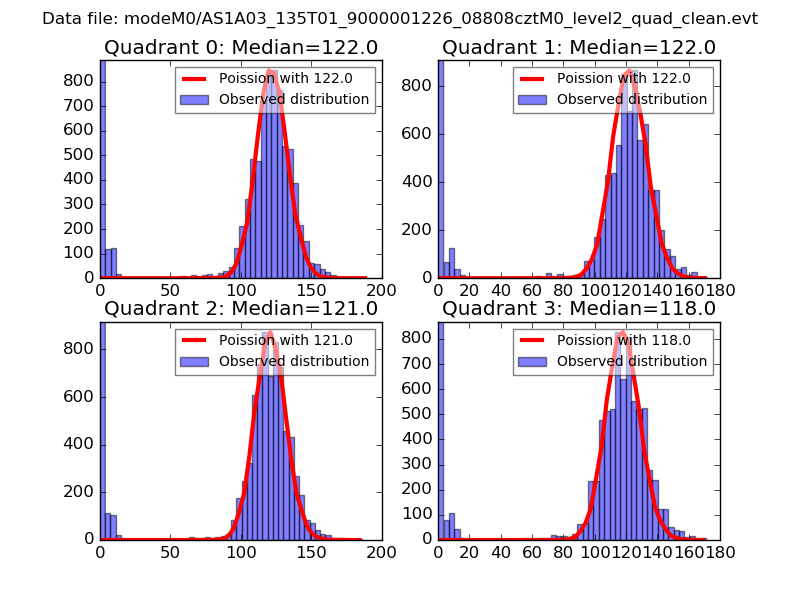 |
 |
| Quadrant-wise count rates Data is divided into 100 sec bins |
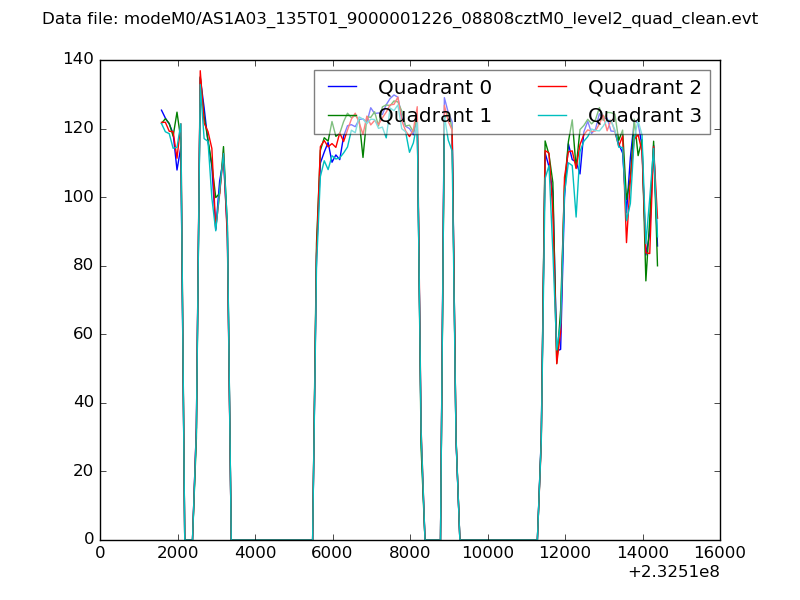 |
|
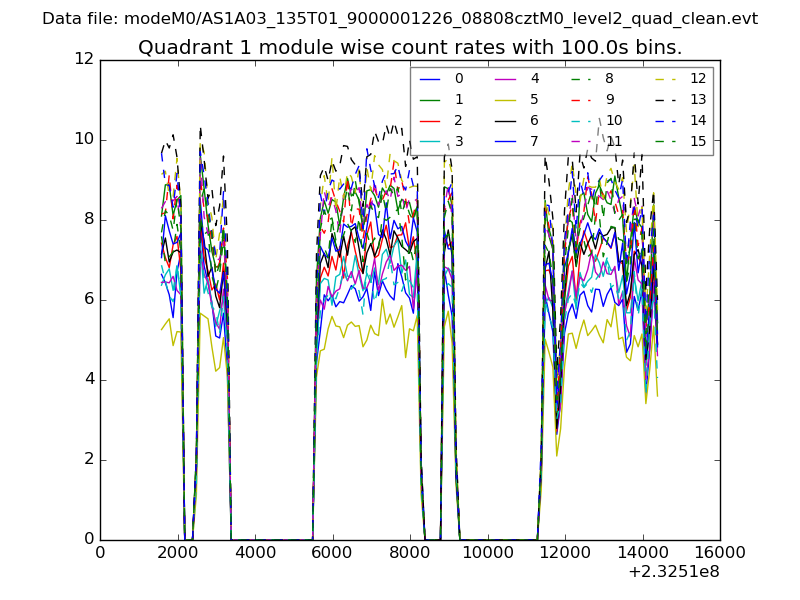
| Module-wise count rates for Quadrant A Data is divided into 100 sec bins |
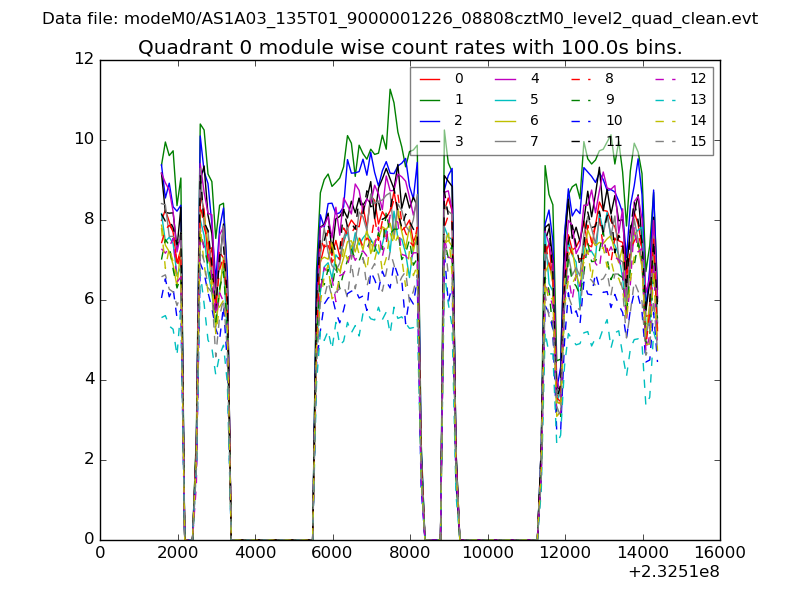 |
 |
| Module-wise count rates for Quadrant B Data is divided into 100 sec bins |
 |
 |
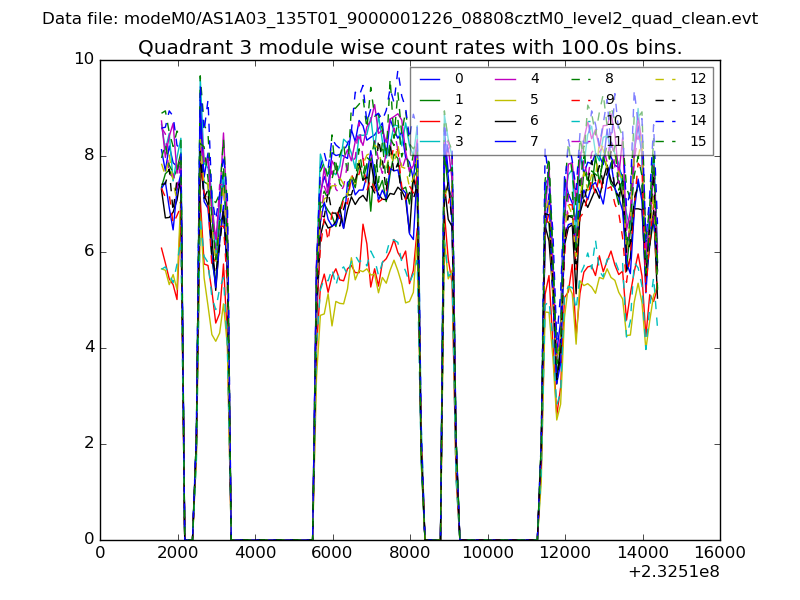
| Module-wise count rates for Quadrant C Data is divided into 100 sec bins |
 |
 |
| Module-wise count rates for Quadrant D Data is divided into 100 sec bins |
 |
 |
| Parameter | Plot |
|---|---|
| CZT HV Monitor |  |
| D_VDD | 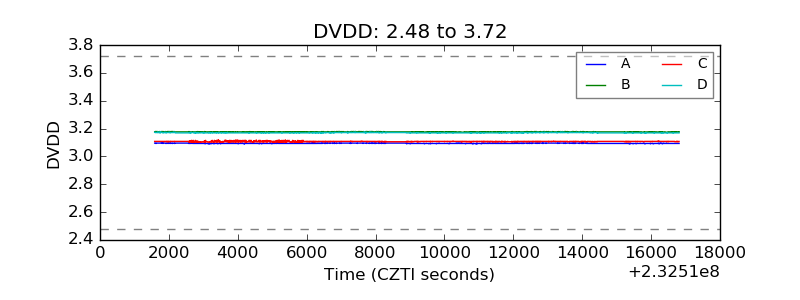 |
| Temperature 1 | 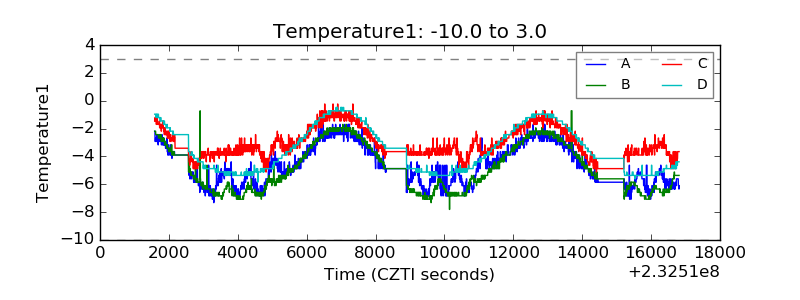 |
| Veto HV Monitor | 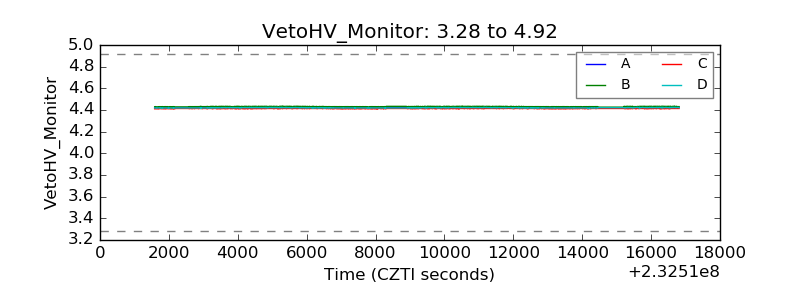 |
| Veto LLD |  |
| Alpha Counter | 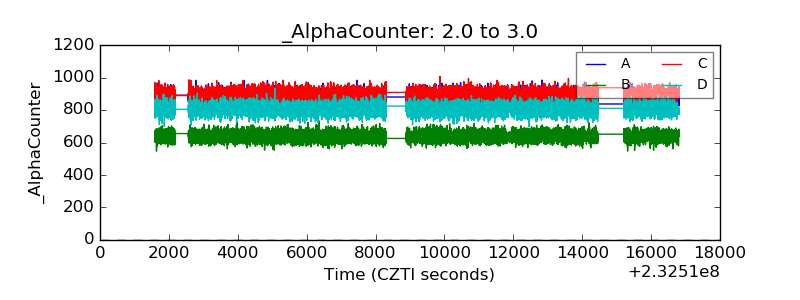 |
| _CPM_Rate |  |
| CZT Counter | 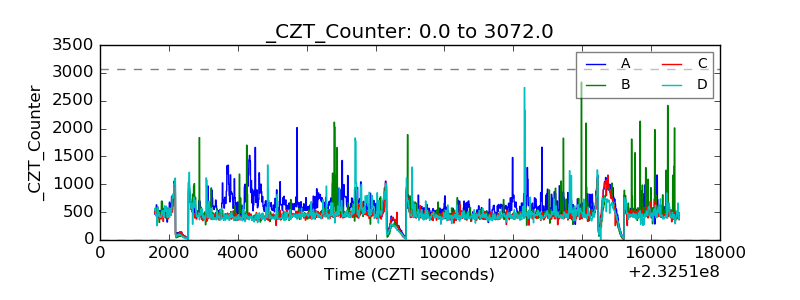 |
| +2.5 Volts monitor |  |
| +5 Volts monitor |  |
| _ROLL_ROT | 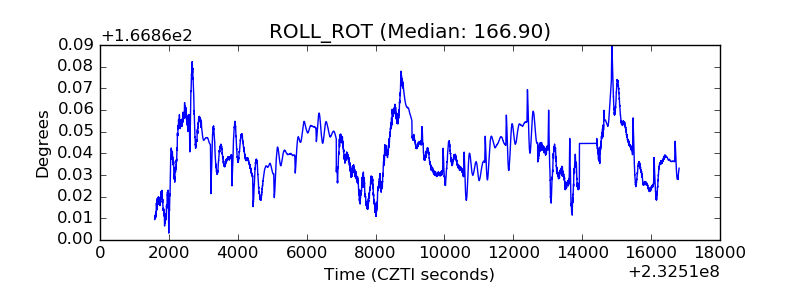 |
| _Roll_DEC | 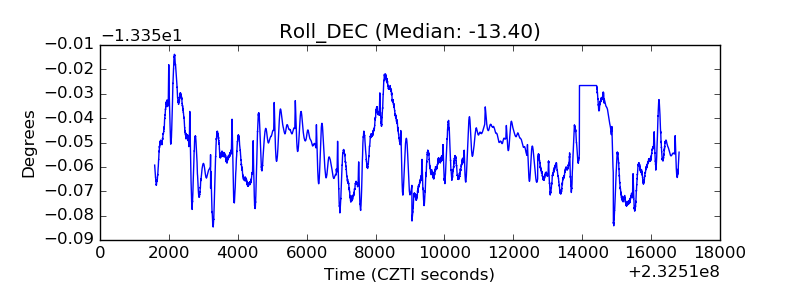 |
| _Roll_RA | 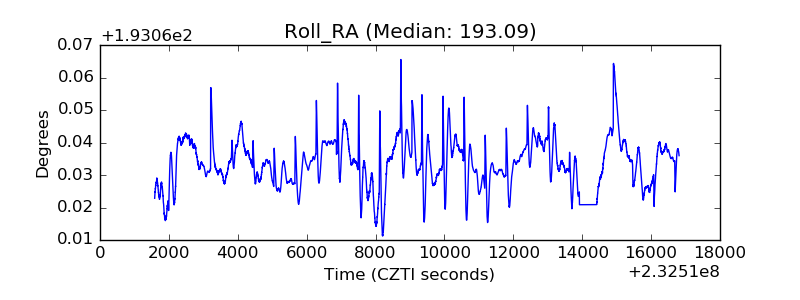 |
| Veto Counter | 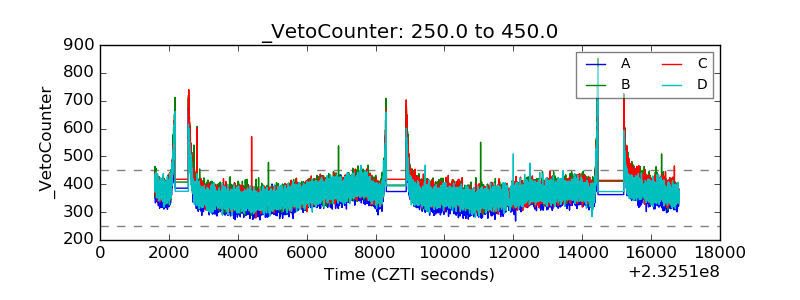 |