| Param | Original file | Final file |
|---|---|---|
| Filename | modeM0/AS1A03_135T01_9000001226_08809cztM0_level2.evt | modeM0/AS1A03_135T01_9000001226_08809cztM0_level2_quad_clean.evt |
| Size (bytes) | 520,318,080 | 75,876,480 |
| Size | 496.2 MB | 72.4 MB |
| Events in quadrant A | 3,796,662 | 454,135 |
| Events in quadrant B | 4,351,318 | 447,845 |
| Events in quadrant C | 3,351,660 | 448,519 |
| Events in quadrant D | 3,762,075 | 438,138 |
| Mode SS | |||
|---|---|---|---|
| Quadrant | BADHDUFLAG | Total packets | Discarded packets |
| A | 0 | 150 | 0 |
| B | 0 | 150 | 0 |
| C | 0 | 150 | 0 |
| D | 0 | 150 | 0 |
| Mode M0 | |||
|---|---|---|---|
| Quadrant | BADHDUFLAG | Total packets | Discarded packets |
| A | 0 | 15853 | 3 |
| B | 0 | 17651 | 2 |
| C | 0 | 14962 | 2 |
| D | 0 | 16188 | 2 |
| Mode M9 | |||
|---|---|---|---|
| Quadrant | BADHDUFLAG | Total packets | Discarded packets |
| A | 0 | 16 | 0 |
| B | 0 | 16 | 0 |
| C | 0 | 16 | 0 |
| D | 0 | 16 | 0 |
| Quadrant | Total seconds | Saturated seconds | Saturation percentage |
|---|---|---|---|
| A | 7308 | 107 | 1.464149% |
| B | 7308 | 327 | 4.474548% |
| C | 7308 | 72 | 0.985222% |
| D | 7308 | 93 | 1.272578% |
Noise dominated data is calculated using 1-second bins in cleaned event files. If a bin has >2000 counts, and if more than 50% of those come from <1% of pixels, then it is considered to be noise-dominated and hence unusable.
| Quadrant | # 1 sec bins | Bins with >0 counts | Bins with >2000 counts | High rate bins dominated by noise | Noise dominated (total time) | Noise dominated (detector-on time) | Marked lightcurve |
|---|---|---|---|---|---|---|---|
| A | 8953 | 7308 | 14 | 14 | 0.16% | 0.19% | 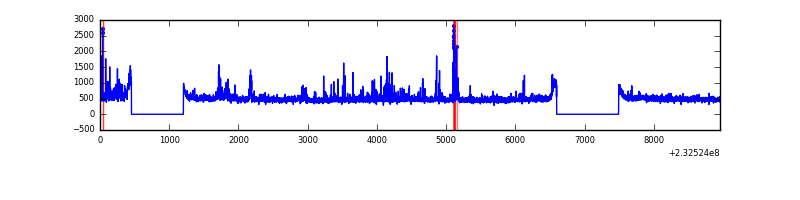 |
| B | 8953 | 7308 | 156 | 156 | 1.74% | 2.13% | 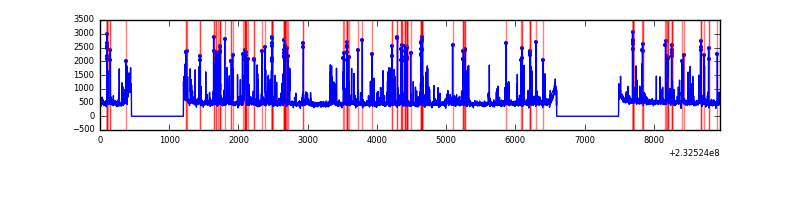 |
| C | 8953 | 7308 | 0 | 0 | 0.00% | 0.00% |  |
| D | 8953 | 7308 | 17 | 17 | 0.19% | 0.23% | 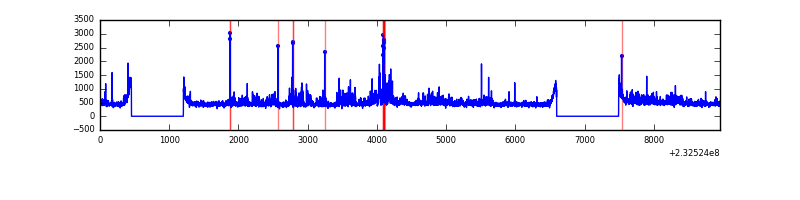 |
Top three noisy pixels from each quadrant. If the there are fewer than three noisy pixels in the level2.evt file, extra rows are filled as -1
| Pixel properties | Quadrant properties | ||||||
|---|---|---|---|---|---|---|---|
| Quadrant | DetID | PixID | Counts | Sigma | Mean | Median | Sigma |
| A | 8 | 5 | 310234 | 1712.34 | 884 | 864 | 180.7 |
| A | 15 | 174 | 68319 | 373.36 | 884 | 864 | 180.7 |
| A | 13 | 251 | 15287 | 79.83 | 884 | 864 | 180.7 |
| B | 10 | 16 | 918050 | 5436.88 | 874 | 851 | 168.7 |
| B | 12 | 111 | 18800 | 106.39 | 874 | 851 | 168.7 |
| B | 11 | 111 | 14901 | 83.28 | 874 | 851 | 168.7 |
| C | 1 | 16 | 6974 | 30.57 | 856 | 859 | 200.0 |
| C | 13 | 61 | 6533 | 28.36 | 856 | 859 | 200.0 |
| C | 8 | 222 | 3997 | 15.68 | 856 | 859 | 200.0 |
| D | 2 | 152 | 383395 | 1831.66 | 848 | 830 | 208.9 |
| D | 2 | 14 | 57182 | 269.8 | 848 | 830 | 208.9 |
| D | 5 | 233 | 38749 | 181.55 | 848 | 830 | 208.9 |
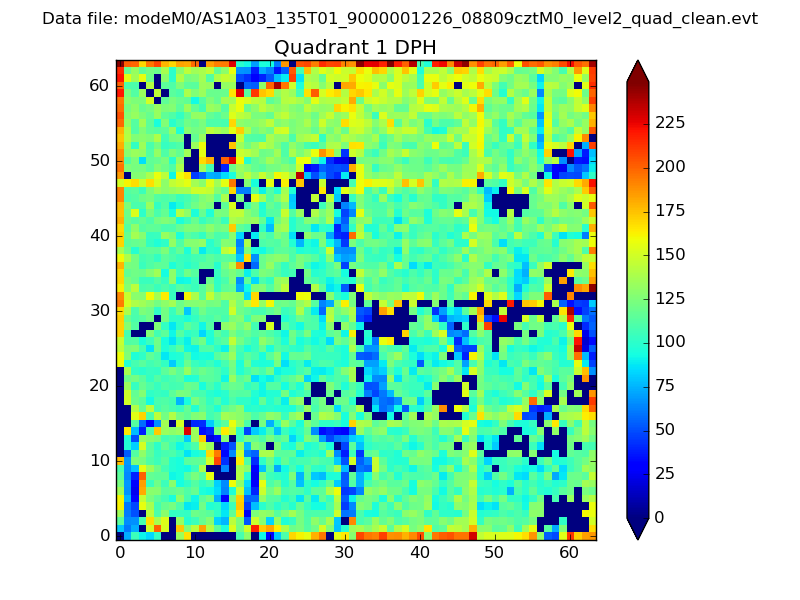
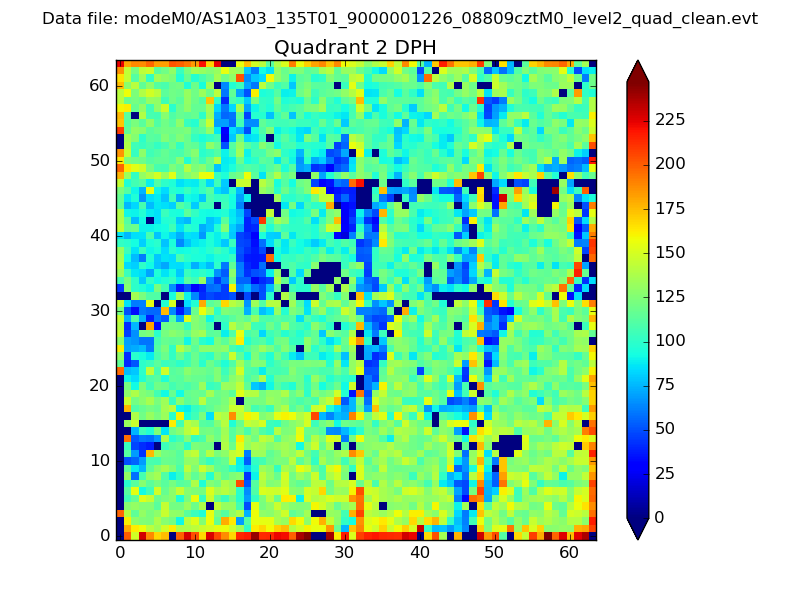
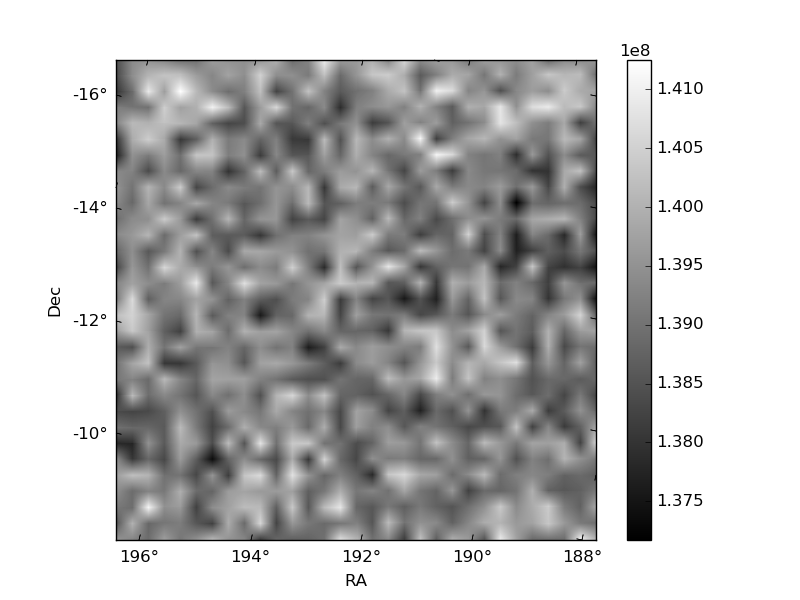
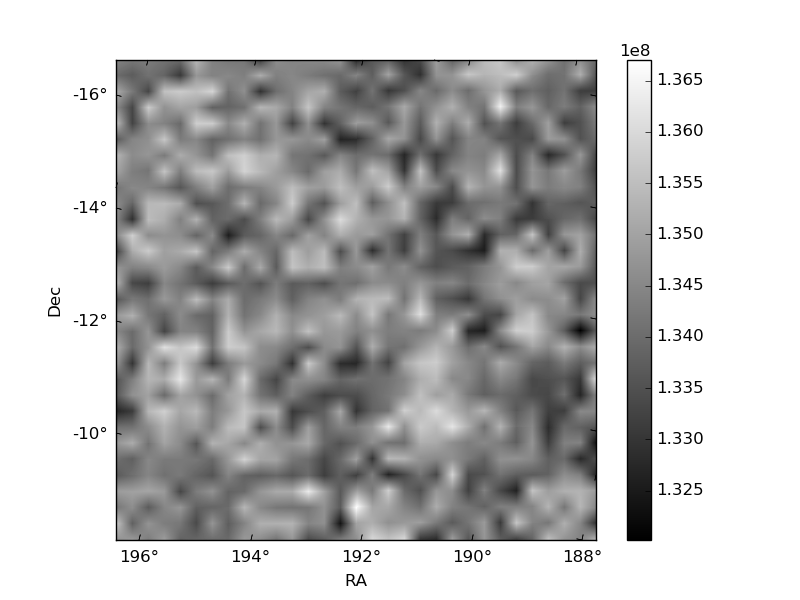
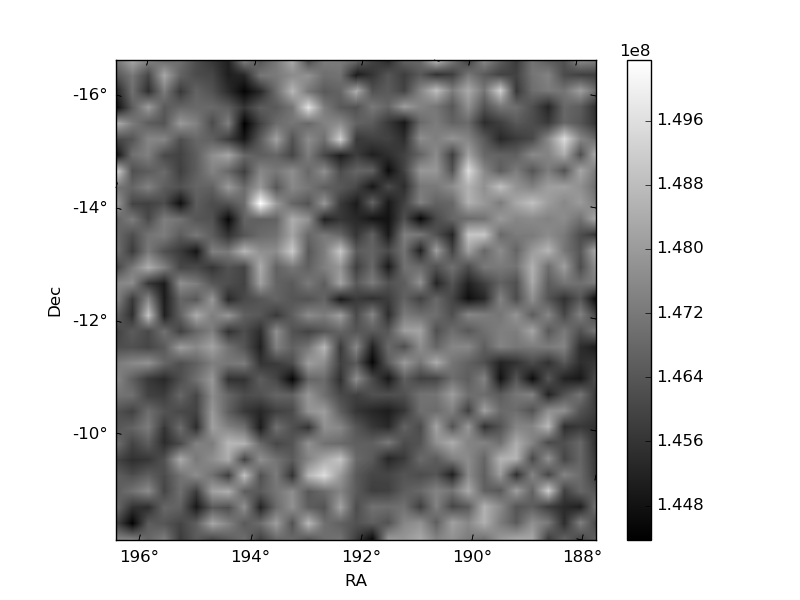
Histogram calculated using DETX and DETY for each event in the final _common_clean file
| Quadrant A | 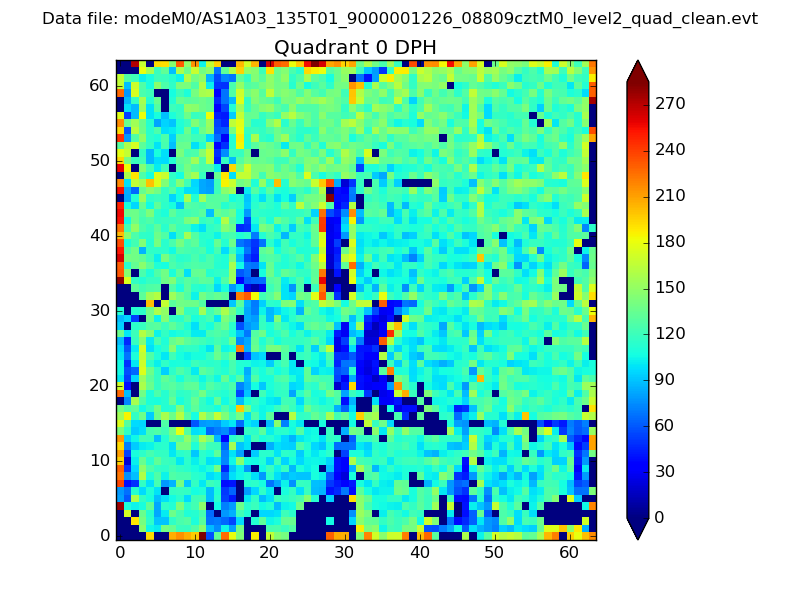 |
 |
Quadrant B |
|---|---|---|---|
| Quadrant D | 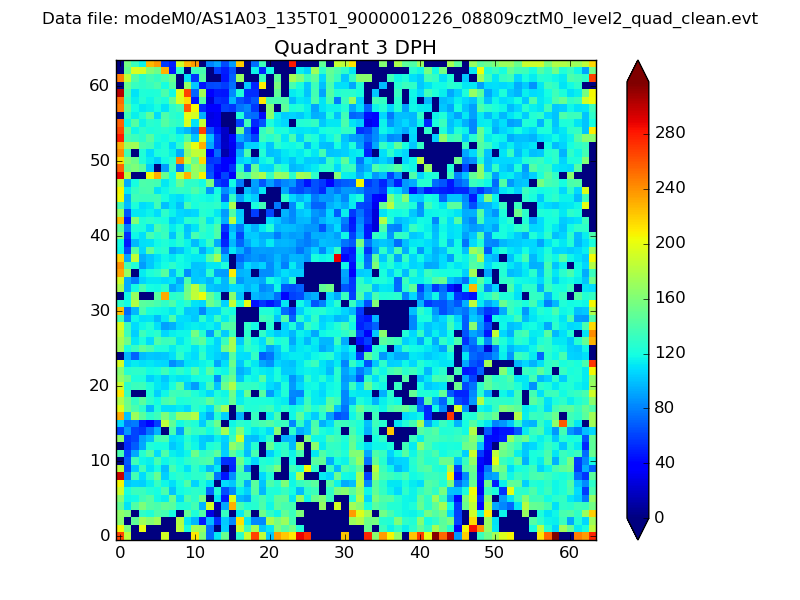 |
 |
Quadrant C |
| Plot type | Count rate plots | Images |
|---|---|---|
| Comparison with Poisson distribution Blue bars denote a histogram of data divided into 1 sec bins. Red curve is a Poisson curve with rate = median count rate of data. |
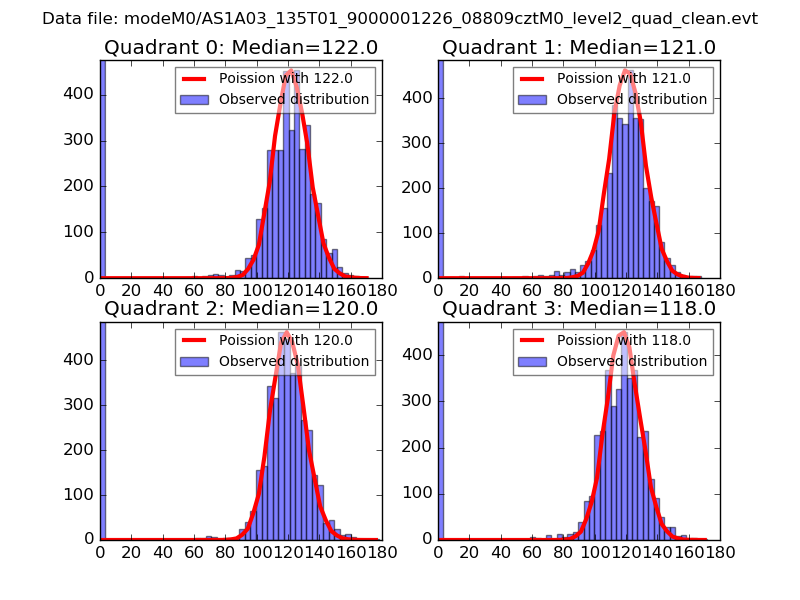 |
 |
| Quadrant-wise count rates Data is divided into 100 sec bins |
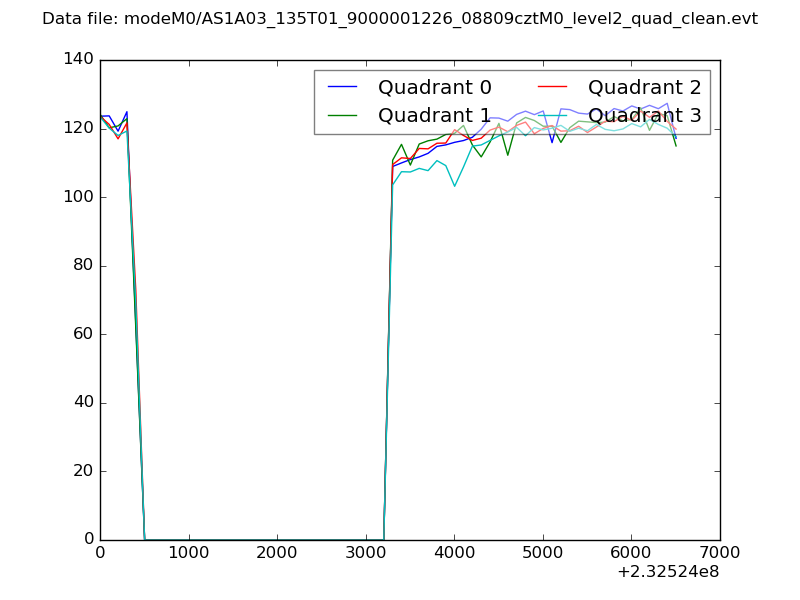 |
|
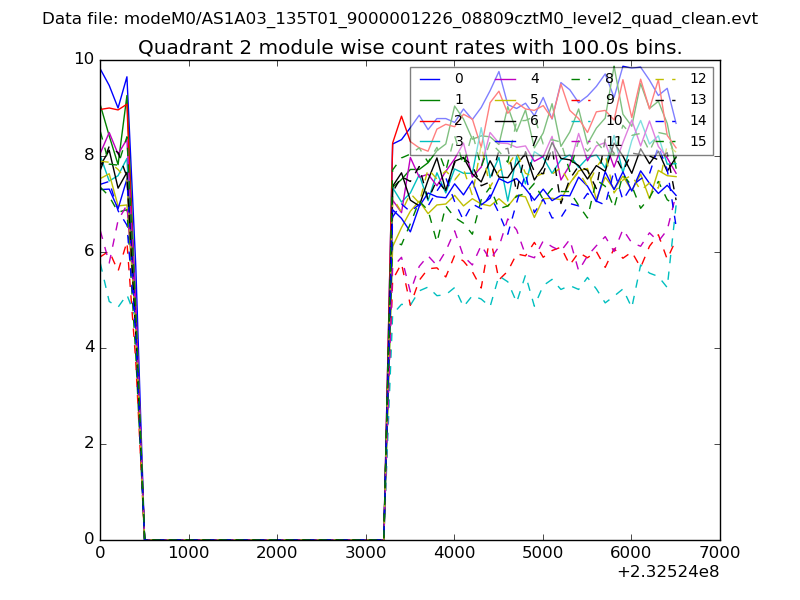
| Module-wise count rates for Quadrant A Data is divided into 100 sec bins |
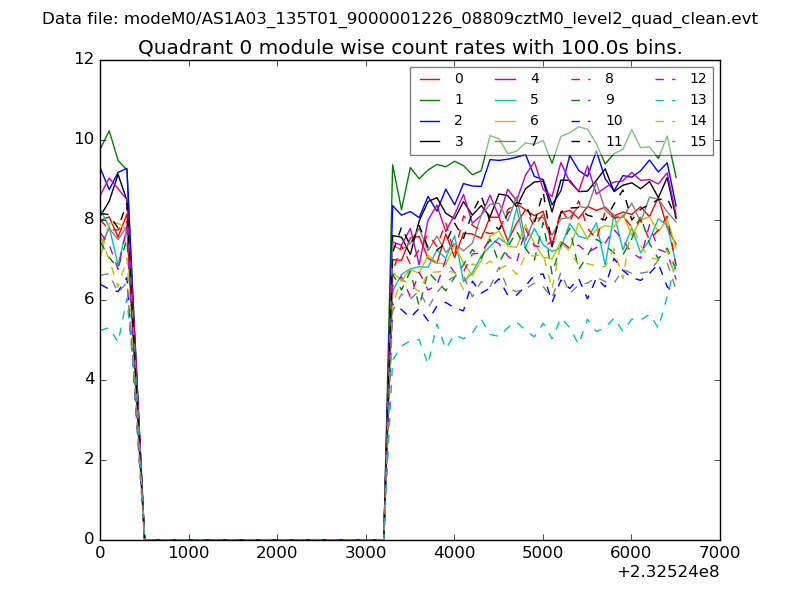 |
 |
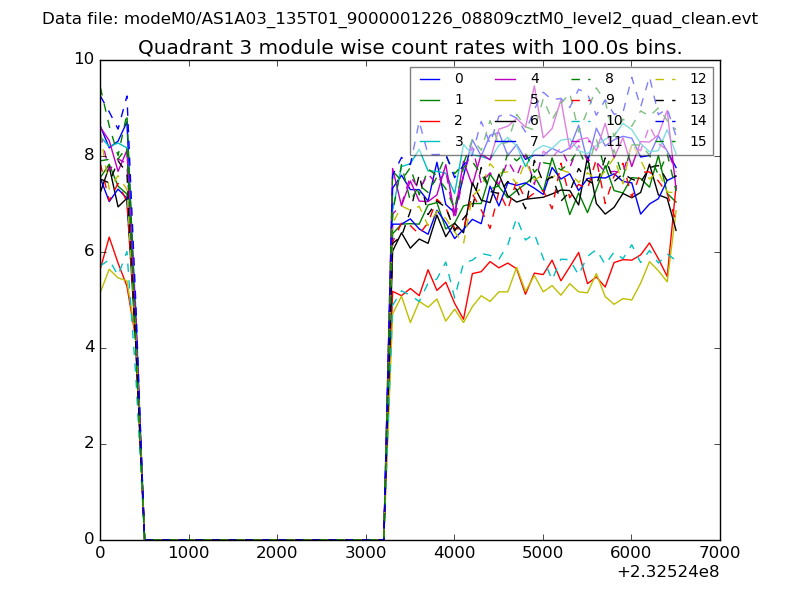
| Module-wise count rates for Quadrant B Data is divided into 100 sec bins |
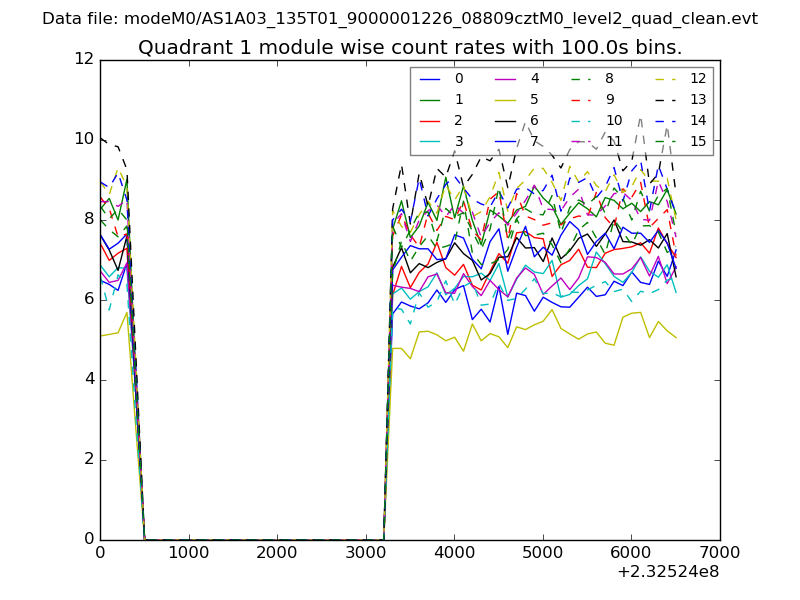 |
 |
| Module-wise count rates for Quadrant C Data is divided into 100 sec bins |
 |
 |
| Module-wise count rates for Quadrant D Data is divided into 100 sec bins |
 |
 |
| Parameter | Plot |
|---|---|
| CZT HV Monitor | 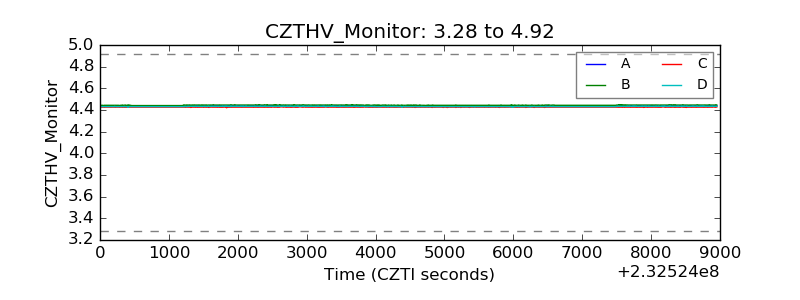 |
| D_VDD |  |
| Temperature 1 | 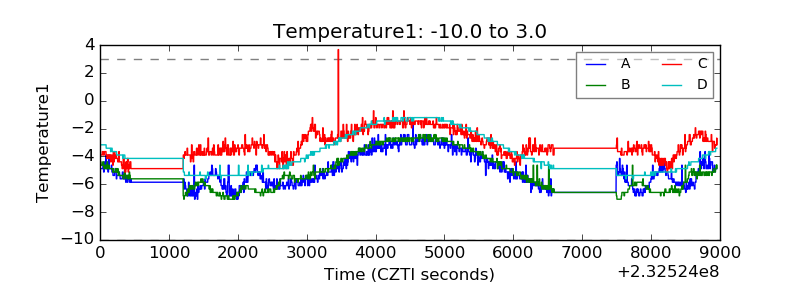 |
| Veto HV Monitor | 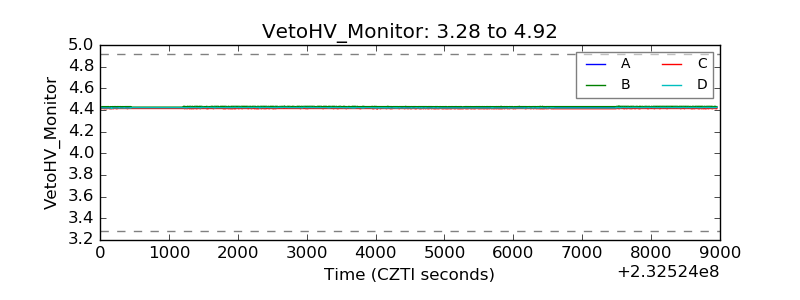 |
| Veto LLD | 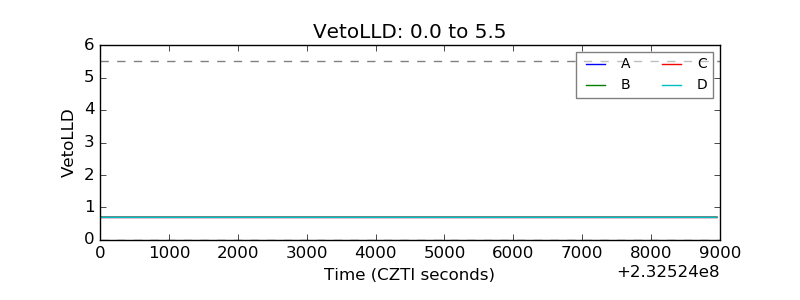 |
| Alpha Counter | 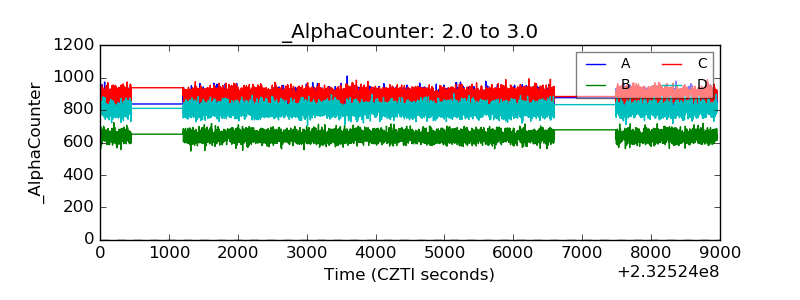 |
| _CPM_Rate | 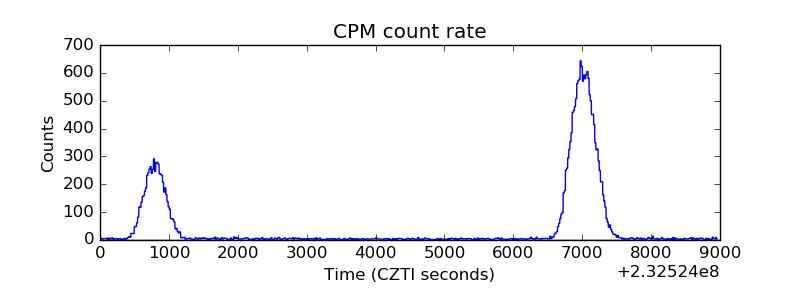 |
| CZT Counter | 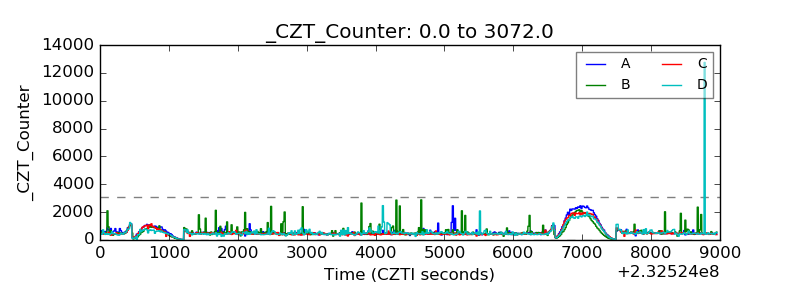 |
| +2.5 Volts monitor |  |
| +5 Volts monitor | 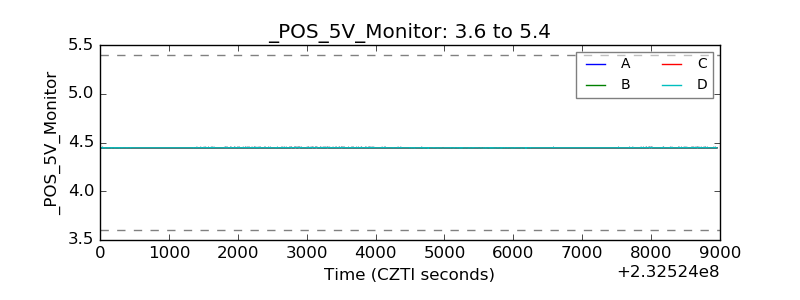 |
| _ROLL_ROT | 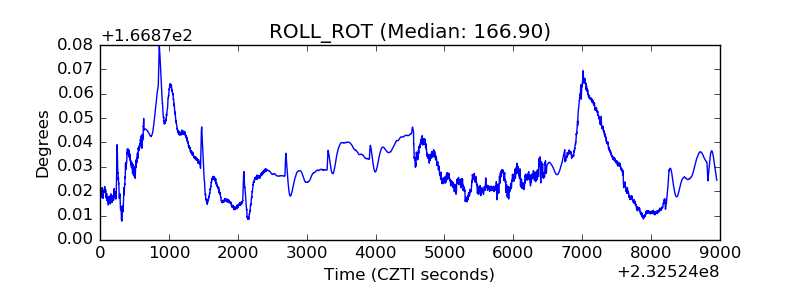 |
| _Roll_DEC | 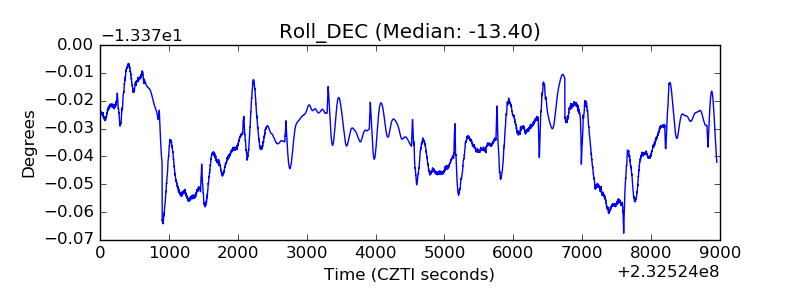 |
| _Roll_RA | 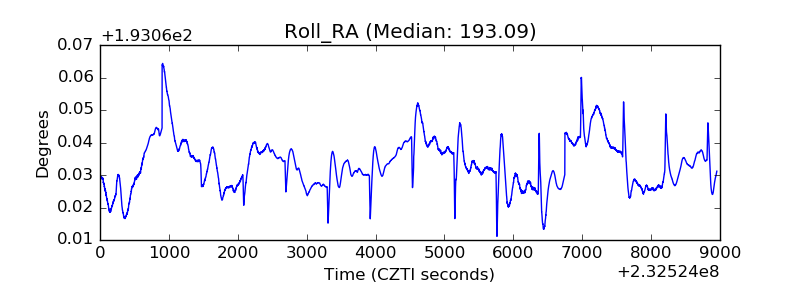 |
| Veto Counter | 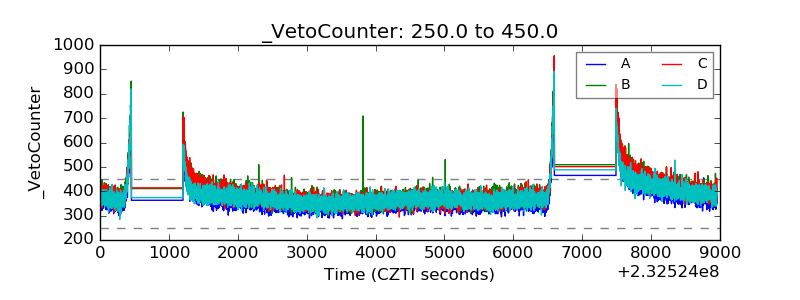 |