| Param | Original file | Final file |
|---|---|---|
| Filename | modeM0/AS1A03_135T01_9000001226_08813cztM0_level2.evt | modeM0/AS1A03_135T01_9000001226_08813cztM0_level2_quad_clean.evt |
| Size (bytes) | 451,808,640 | 94,717,440 |
| Size | 430.9 MB | 90.3 MB |
| Events in quadrant A | 3,375,977 | 625,234 |
| Events in quadrant B | 3,235,088 | 627,265 |
| Events in quadrant C | 2,917,974 | 610,823 |
| Events in quadrant D | 3,749,624 | 589,006 |
| Mode SS | |||
|---|---|---|---|
| Quadrant | BADHDUFLAG | Total packets | Discarded packets |
| A | 0 | 120 | 0 |
| B | 0 | 120 | 0 |
| C | 0 | 120 | 0 |
| D | 0 | 120 | 0 |
| Mode M0 | |||
|---|---|---|---|
| Quadrant | BADHDUFLAG | Total packets | Discarded packets |
| A | 0 | 13760 | 2 |
| B | 0 | 13294 | 1 |
| C | 0 | 12485 | 1 |
| D | 0 | 15109 | 1 |
| Mode M9 | |||
|---|---|---|---|
| Quadrant | BADHDUFLAG | Total packets | Discarded packets |
| A | 0 | 13 | 0 |
| B | 0 | 13 | 0 |
| C | 0 | 13 | 0 |
| D | 0 | 13 | 0 |
| Quadrant | Total seconds | Saturated seconds | Saturation percentage |
|---|---|---|---|
| A | 5958 | 64 | 1.074186% |
| B | 5958 | 81 | 1.359517% |
| C | 5958 | 37 | 0.621014% |
| D | 5958 | 197 | 3.306479% |
Noise dominated data is calculated using 1-second bins in cleaned event files. If a bin has >2000 counts, and if more than 50% of those come from <1% of pixels, then it is considered to be noise-dominated and hence unusable.
| Quadrant | # 1 sec bins | Bins with >0 counts | Bins with >2000 counts | High rate bins dominated by noise | Noise dominated (total time) | Noise dominated (detector-on time) | Marked lightcurve |
|---|---|---|---|---|---|---|---|
| A | 7238 | 5958 | 11 | 11 | 0.15% | 0.18% | 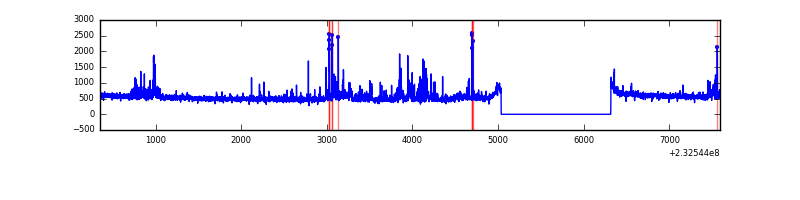 |
| B | 7238 | 5958 | 20 | 20 | 0.28% | 0.34% | 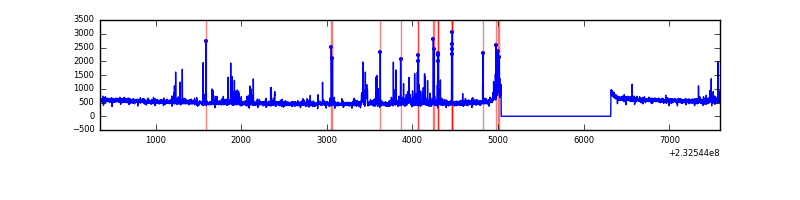 |
| C | 7238 | 5958 | 0 | 0 | 0.00% | 0.00% | 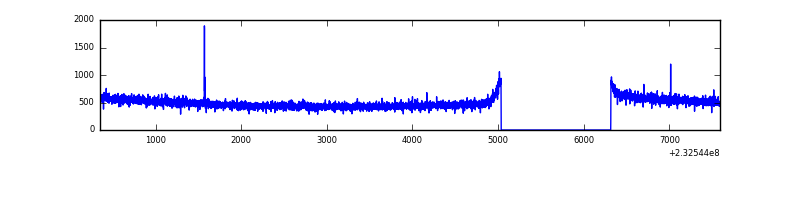 |
| D | 7238 | 5958 | 149 | 149 | 2.06% | 2.50% | 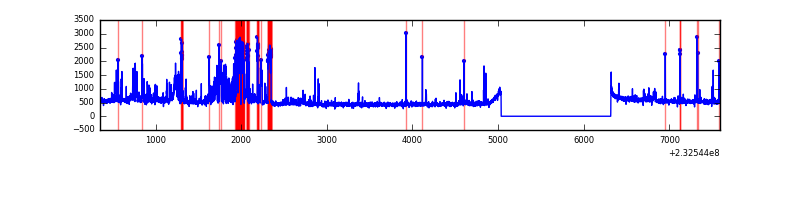 |
Top three noisy pixels from each quadrant. If the there are fewer than three noisy pixels in the level2.evt file, extra rows are filled as -1
| Pixel properties | Quadrant properties | ||||||
|---|---|---|---|---|---|---|---|
| Quadrant | DetID | PixID | Counts | Sigma | Mean | Median | Sigma |
| A | 8 | 5 | 327395 | 2056.75 | 784 | 771 | 158.8 |
| A | 13 | 248 | 20071 | 121.53 | 784 | 771 | 158.8 |
| A | 15 | 174 | 8328 | 47.59 | 784 | 771 | 158.8 |
| B | 10 | 16 | 158963 | 1081.61 | 771 | 755 | 146.3 |
| B | 4 | 80 | 30024 | 200.1 | 771 | 755 | 146.3 |
| B | 0 | 214 | 26149 | 173.61 | 771 | 755 | 146.3 |
| C | 14 | 234 | 6989 | 36.44 | 745 | 751 | 171.2 |
| C | 13 | 61 | 5910 | 30.14 | 745 | 751 | 171.2 |
| C | 1 | 16 | 2308 | 9.09 | 745 | 751 | 171.2 |
| D | 2 | 16 | 599147 | 3315.9 | 748 | 732 | 180.5 |
| D | 2 | 152 | 103655 | 570.31 | 748 | 732 | 180.5 |
| D | 12 | 221 | 73797 | 404.86 | 748 | 732 | 180.5 |
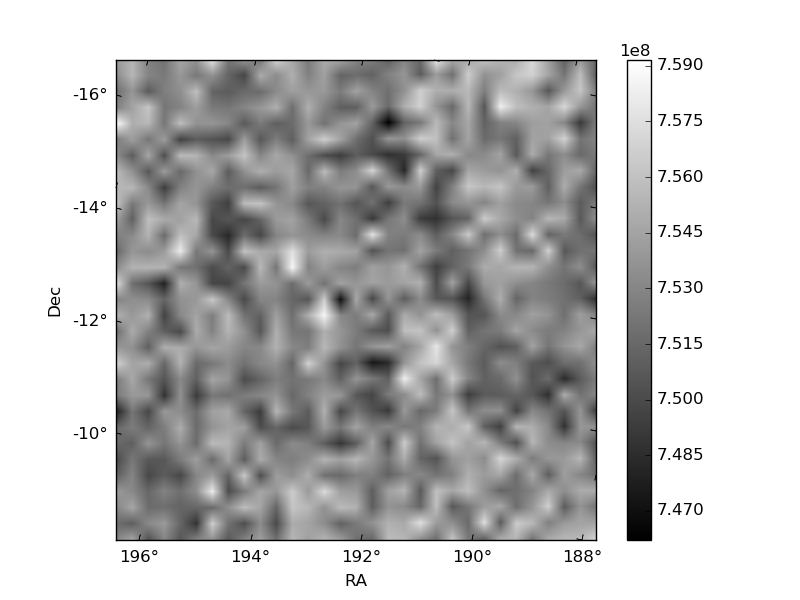
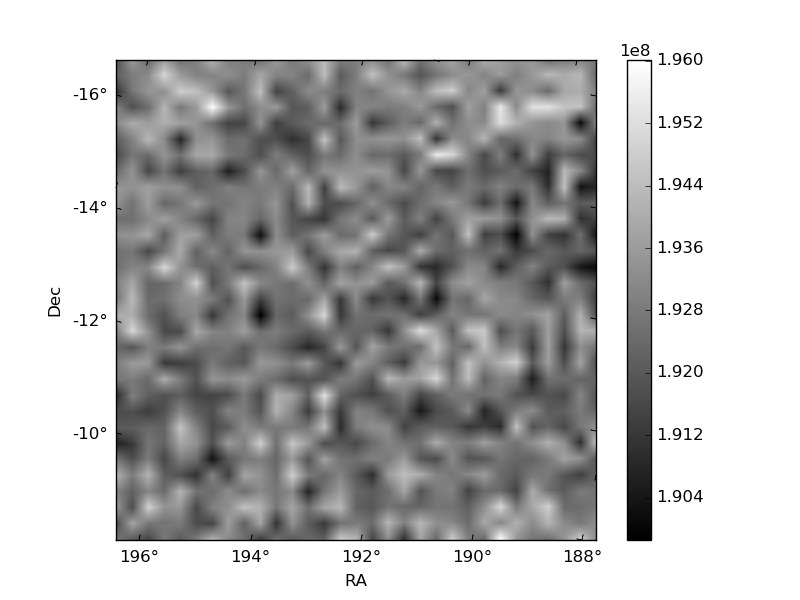
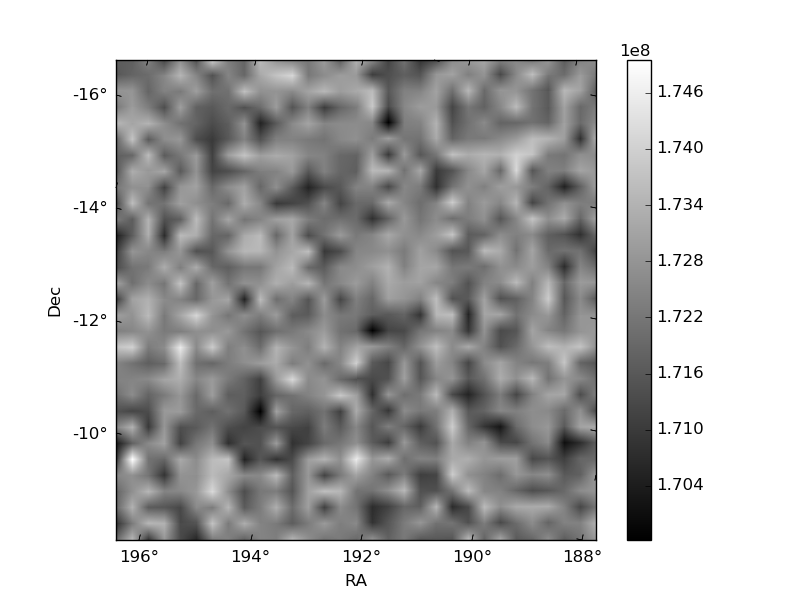
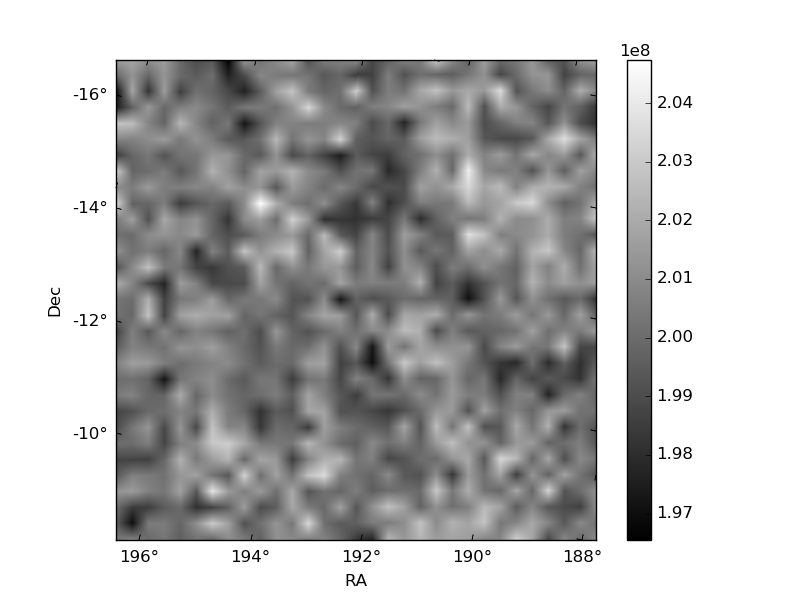
Histogram calculated using DETX and DETY for each event in the final _common_clean file
| Quadrant A | 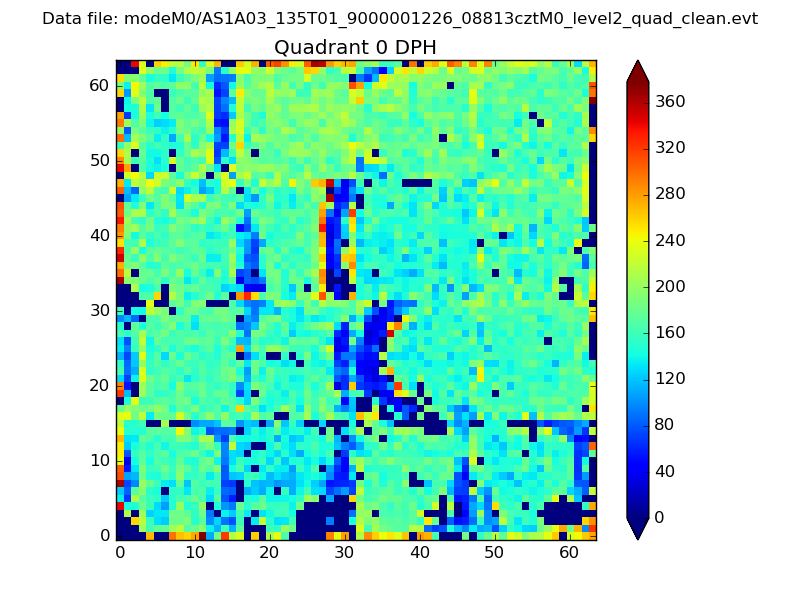 |
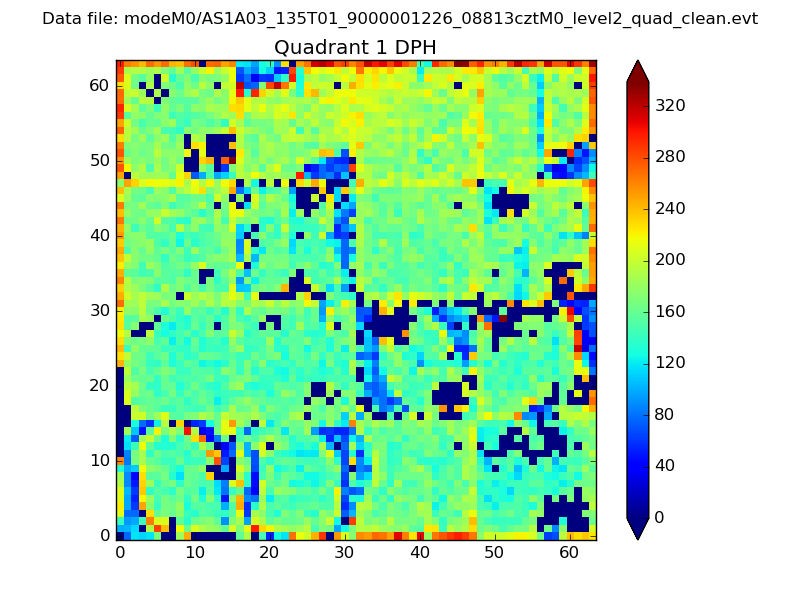 |
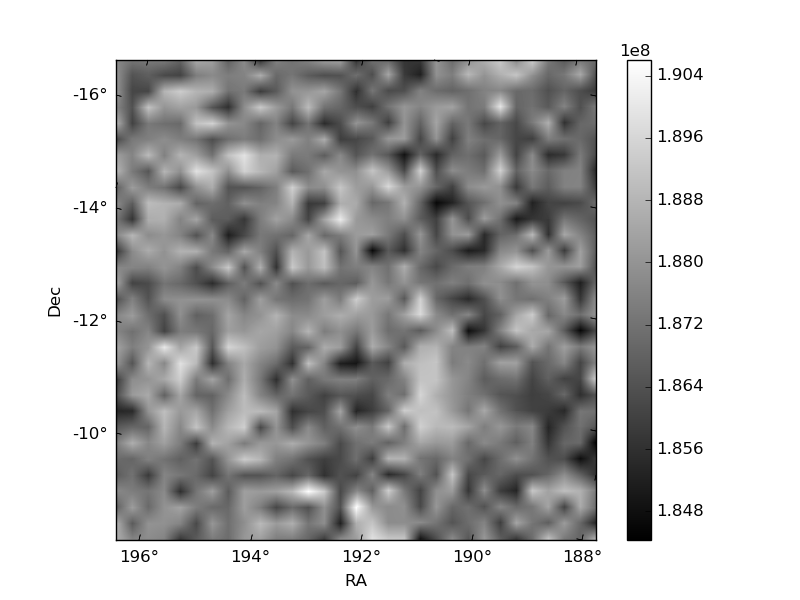
Quadrant B |
|---|---|---|---|
| Quadrant D | 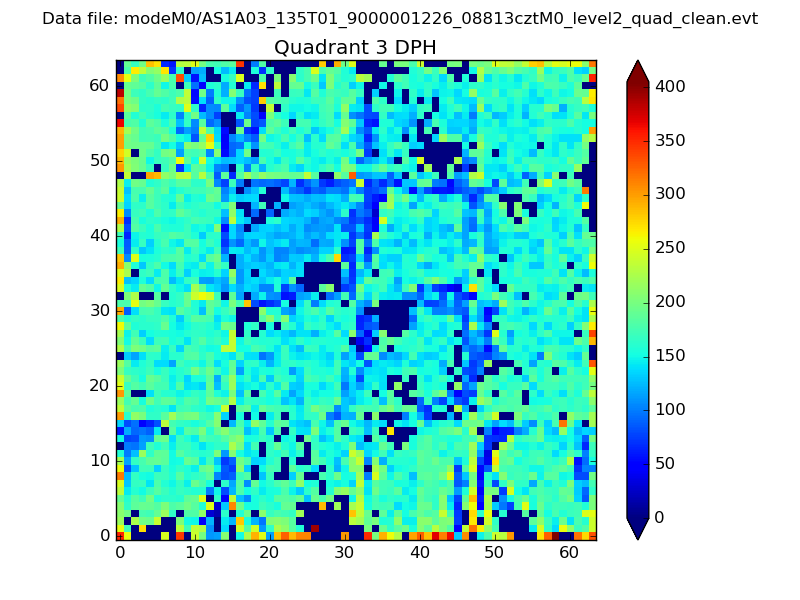 |
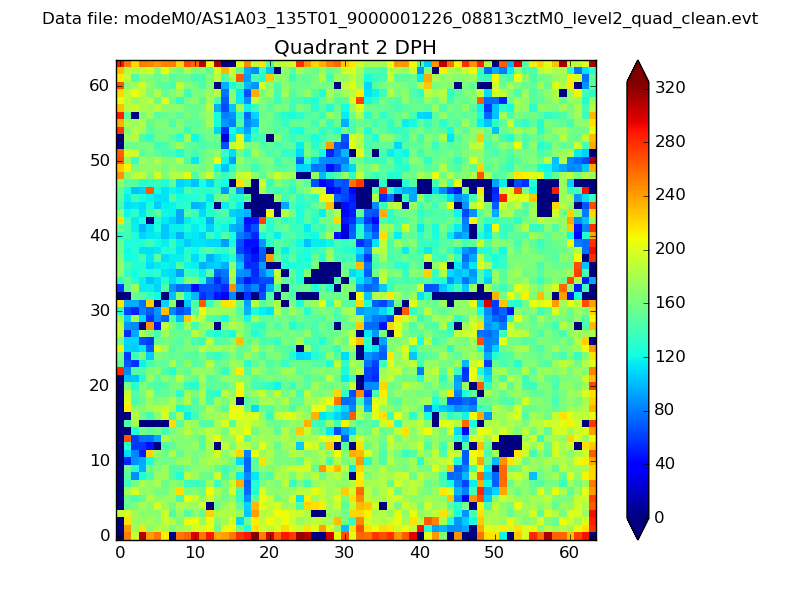 |
Quadrant C |
| Plot type | Count rate plots | Images |
|---|---|---|
| Comparison with Poisson distribution Blue bars denote a histogram of data divided into 1 sec bins. Red curve is a Poisson curve with rate = median count rate of data. |
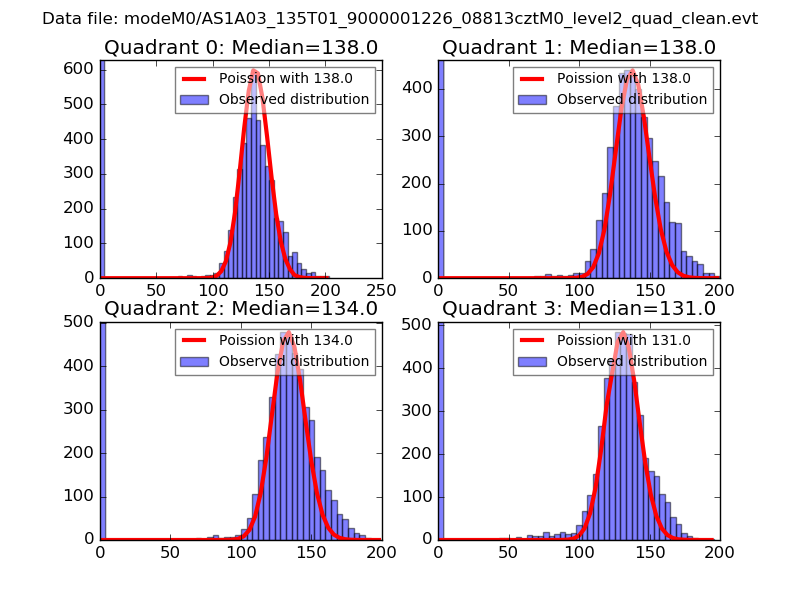 |
 |
| Quadrant-wise count rates Data is divided into 100 sec bins |
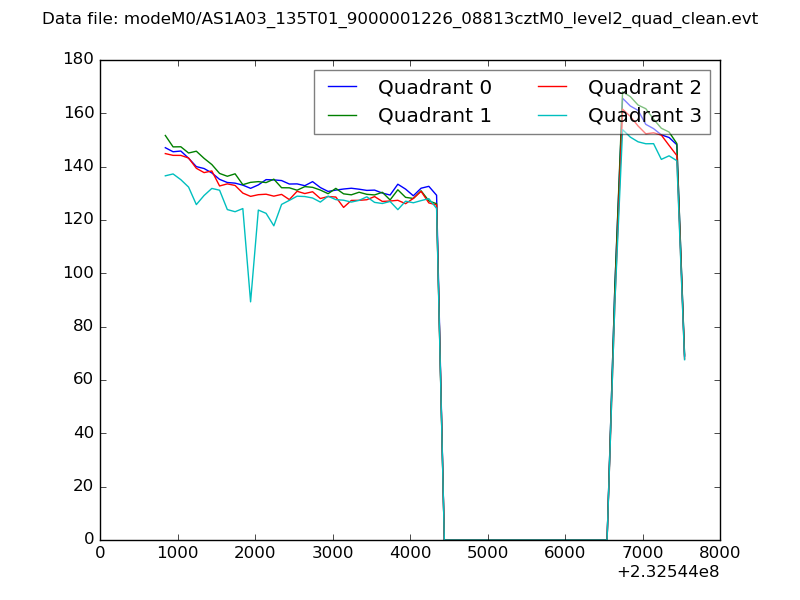 |
|
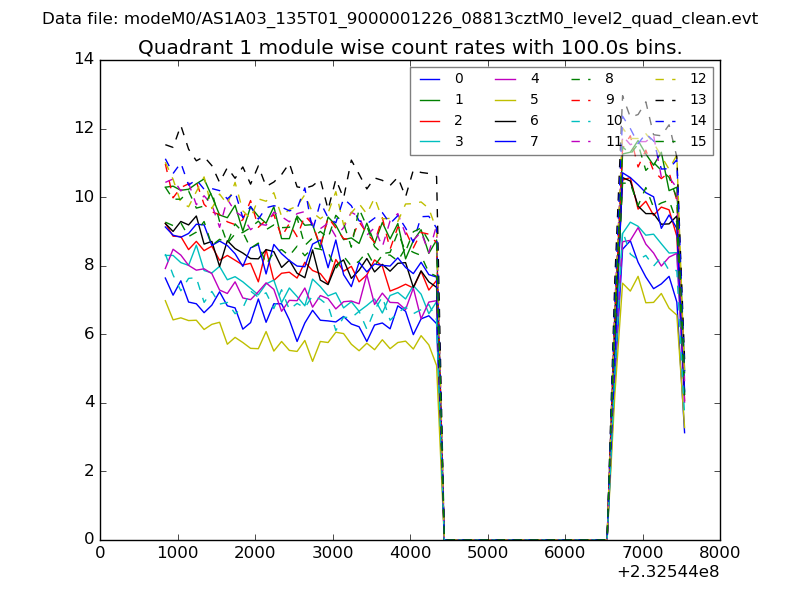
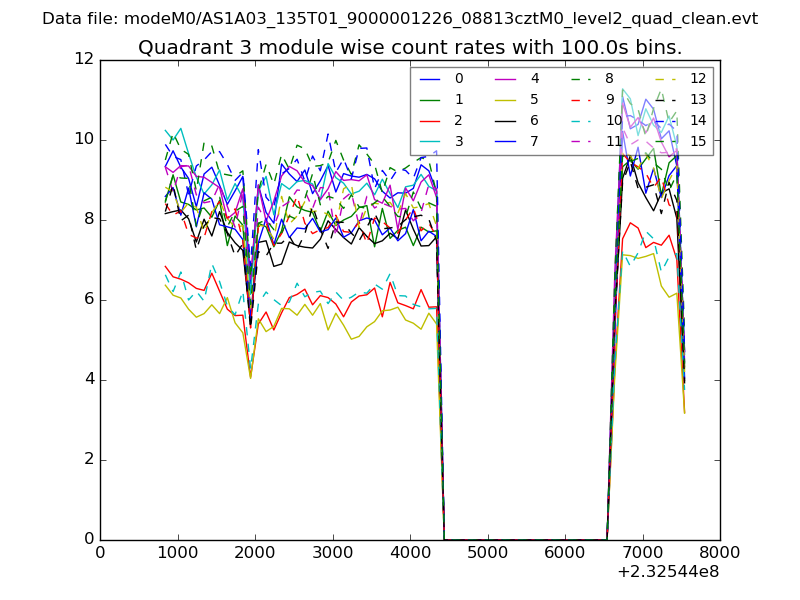
| Module-wise count rates for Quadrant A Data is divided into 100 sec bins |
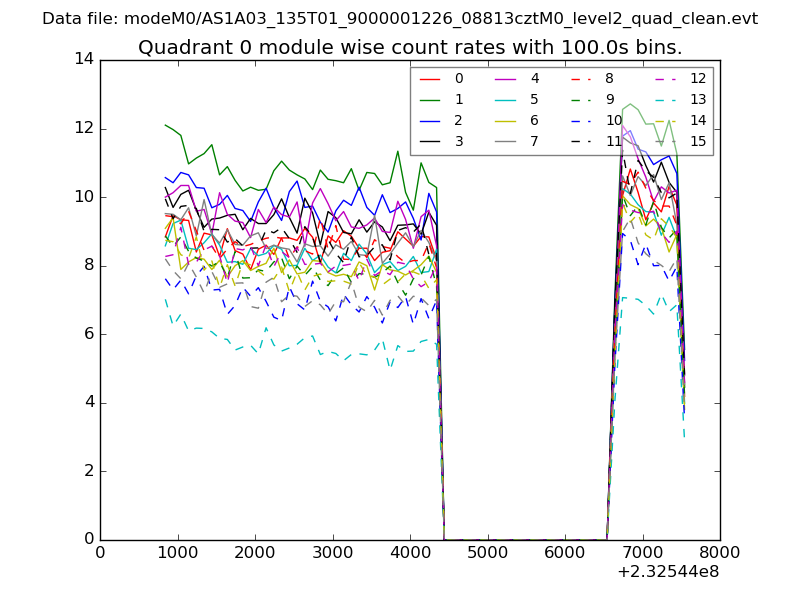 |
 |
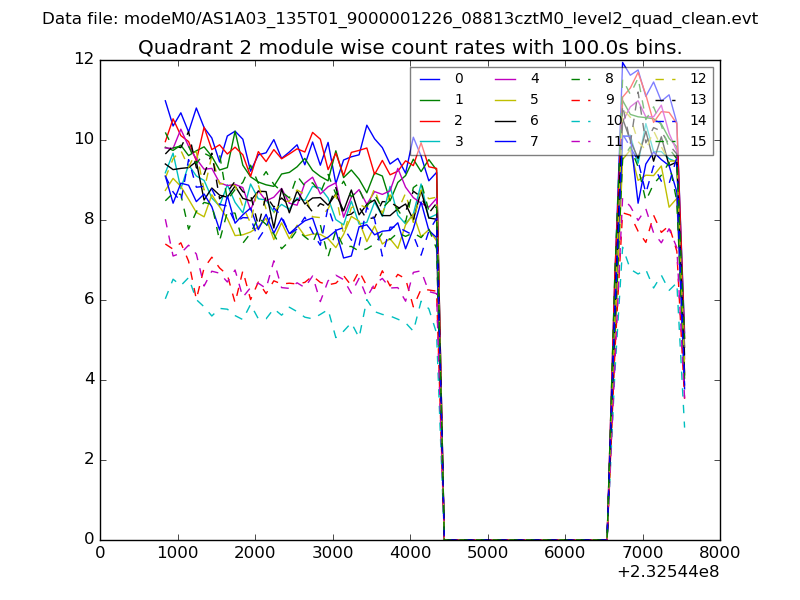
| Module-wise count rates for Quadrant B Data is divided into 100 sec bins |
 |
 |
| Module-wise count rates for Quadrant C Data is divided into 100 sec bins |
 |
 |
| Module-wise count rates for Quadrant D Data is divided into 100 sec bins |
 |
 |
| Parameter | Plot |
|---|---|
| CZT HV Monitor | 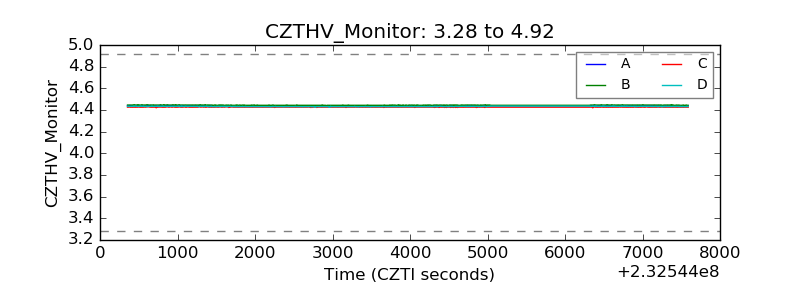 |
| D_VDD | 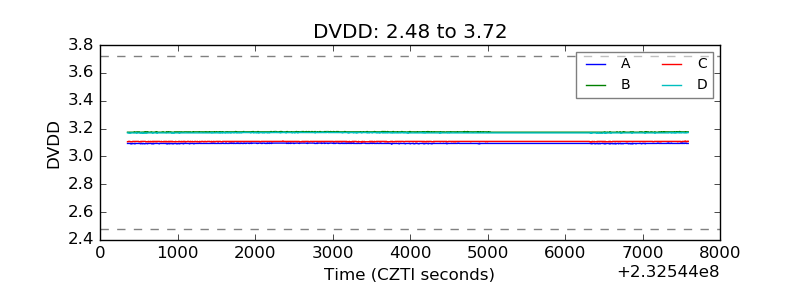 |
| Temperature 1 | 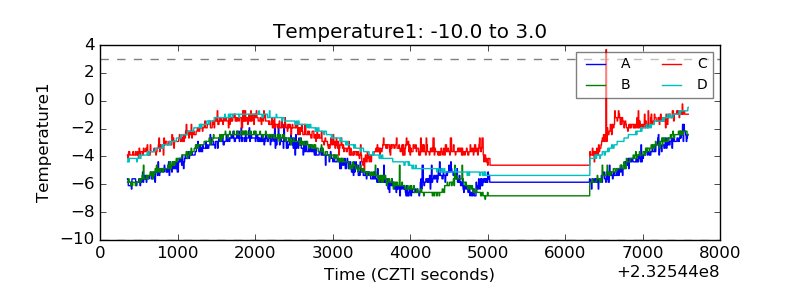 |
| Veto HV Monitor | 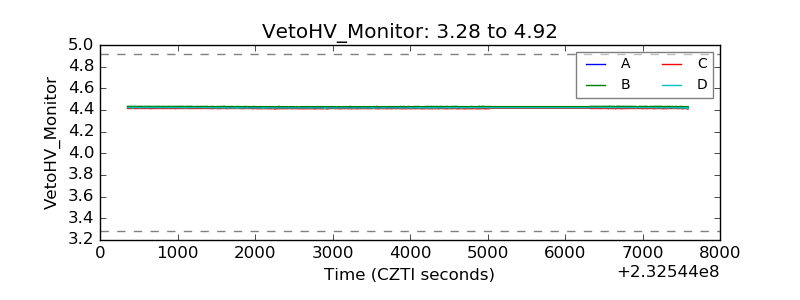 |
| Veto LLD | 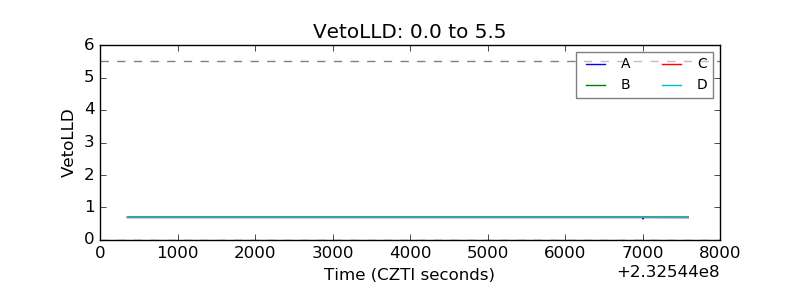 |
| Alpha Counter | 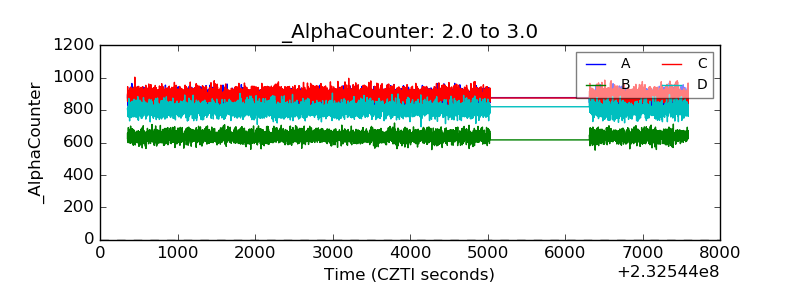 |
| _CPM_Rate | 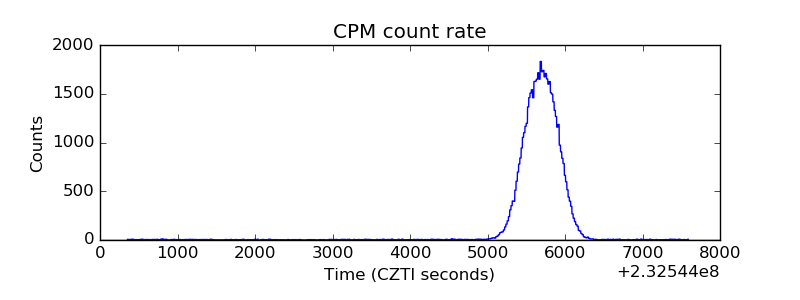 |
| CZT Counter | 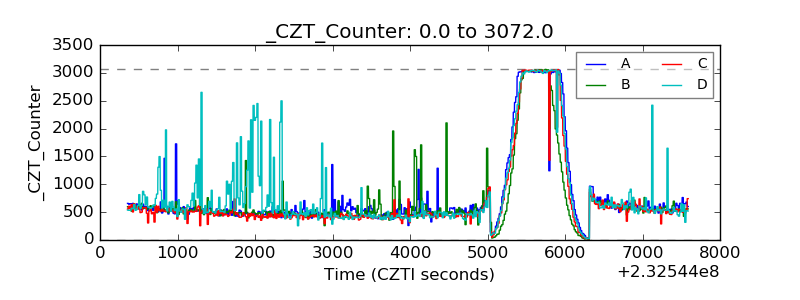 |
| +2.5 Volts monitor |  |
| +5 Volts monitor |  |
| _ROLL_ROT | 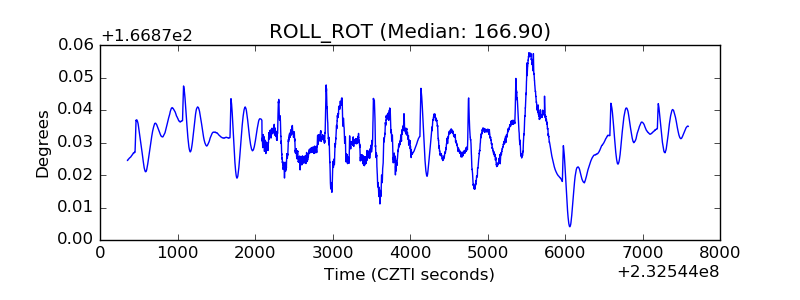 |
| _Roll_DEC | 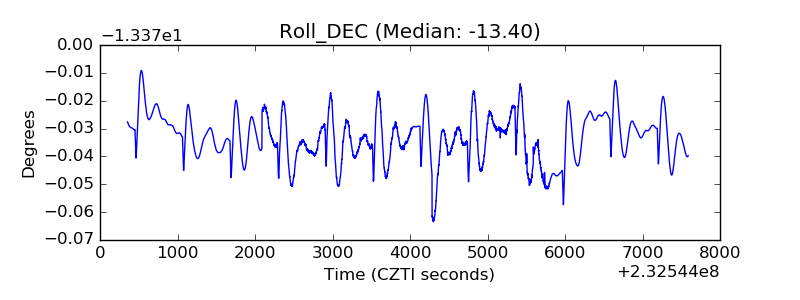 |
| _Roll_RA | 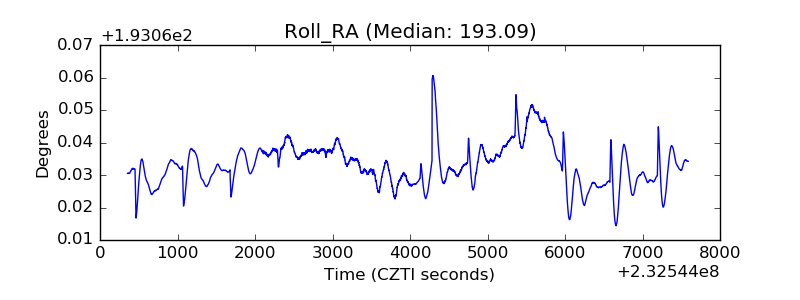 |
| Veto Counter | 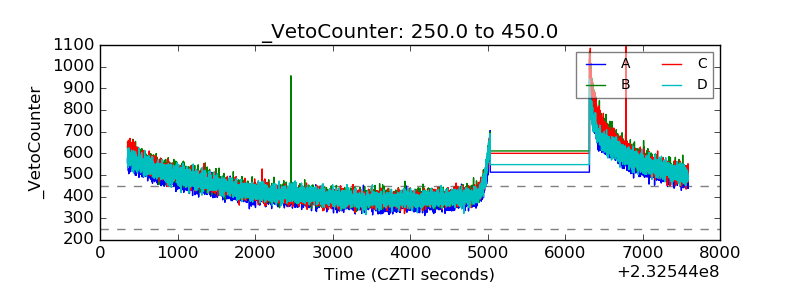 |