| Param | Original file | Final file |
|---|---|---|
| Filename | modeM0/AS1A03_135T01_9000001226_08816cztM0_level2.evt | modeM0/AS1A03_135T01_9000001226_08816cztM0_level2_quad_clean.evt |
| Size (bytes) | 444,836,160 | 92,594,880 |
| Size | 424.2 MB | 88.3 MB |
| Events in quadrant A | 3,185,612 | 608,658 |
| Events in quadrant B | 3,454,448 | 600,063 |
| Events in quadrant C | 2,905,405 | 585,999 |
| Events in quadrant D | 3,503,119 | 575,035 |
| Mode SS | |||
|---|---|---|---|
| Quadrant | BADHDUFLAG | Total packets | Discarded packets |
| A | 0 | 132 | 4 |
| B | 0 | 132 | 0 |
| C | 0 | 132 | 6 |
| D | 0 | 132 | 10 |
| Mode M0 | |||
|---|---|---|---|
| Quadrant | BADHDUFLAG | Total packets | Discarded packets |
| A | 0 | 14119 | 672 |
| B | 0 | 14916 | 652 |
| C | 0 | 13568 | 742 |
| D | 0 | 15215 | 663 |
| Mode M9 | |||
|---|---|---|---|
| Quadrant | BADHDUFLAG | Total packets | Discarded packets |
| A | 0 | 11 | 2 |
| B | 0 | 11 | 2 |
| C | 0 | 11 | 2 |
| D | 0 | 11 | 5 |
| Quadrant | Total seconds | Saturated seconds | Saturation percentage |
|---|---|---|---|
| A | 6226 | 80 | 1.284934% |
| B | 6225 | 140 | 2.248996% |
| C | 6194 | 43 | 0.694220% |
| D | 6236 | 92 | 1.475305% |
Noise dominated data is calculated using 1-second bins in cleaned event files. If a bin has >2000 counts, and if more than 50% of those come from <1% of pixels, then it is considered to be noise-dominated and hence unusable.
| Quadrant | # 1 sec bins | Bins with >0 counts | Bins with >2000 counts | High rate bins dominated by noise | Noise dominated (total time) | Noise dominated (detector-on time) | Marked lightcurve |
|---|---|---|---|---|---|---|---|
| A | 7580 | 6376 | 4 | 4 | 0.05% | 0.06% | 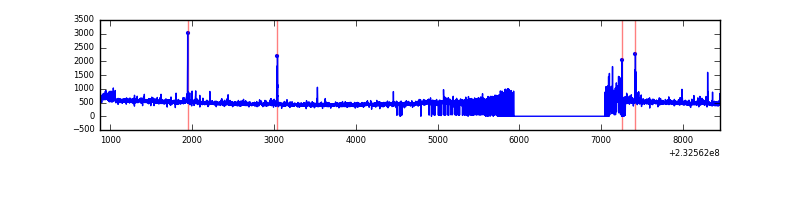 |
| B | 7580 | 6360 | 68 | 68 | 0.90% | 1.07% | 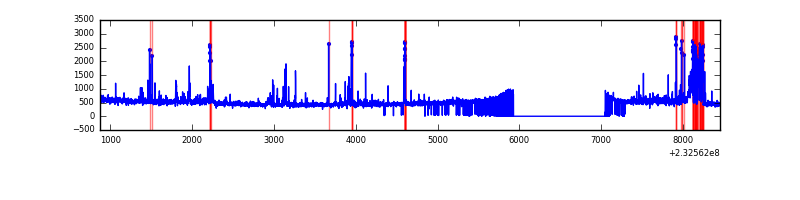 |
| C | 7580 | 6371 | 0 | 0 | 0.00% | 0.00% | 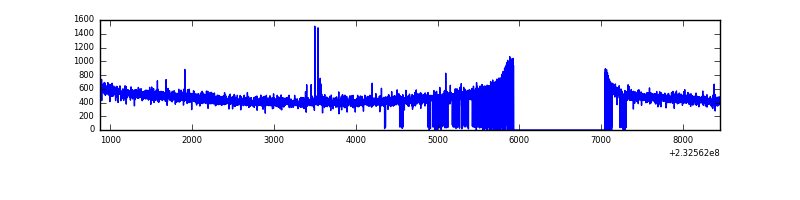 |
| D | 7580 | 6384 | 37 | 37 | 0.49% | 0.58% | 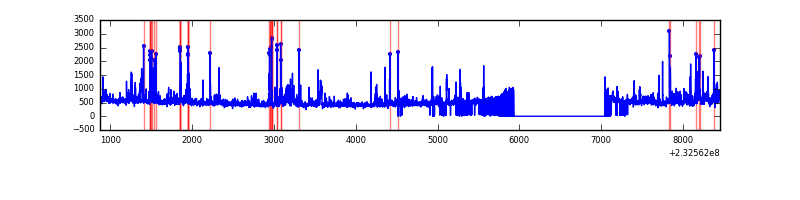 |
Top three noisy pixels from each quadrant. If the there are fewer than three noisy pixels in the level2.evt file, extra rows are filled as -1
| Pixel properties | Quadrant properties | ||||||
|---|---|---|---|---|---|---|---|
| Quadrant | DetID | PixID | Counts | Sigma | Mean | Median | Sigma |
| A | 8 | 5 | 121143 | 758.73 | 781 | 766 | 158.7 |
| A | 5 | 16 | 25712 | 157.23 | 781 | 766 | 158.7 |
| A | 15 | 174 | 17891 | 107.94 | 781 | 766 | 158.7 |
| B | 10 | 16 | 364322 | 2462.48 | 769 | 752 | 147.6 |
| B | 0 | 214 | 64794 | 433.76 | 769 | 752 | 147.6 |
| B | 4 | 80 | 22821 | 149.47 | 769 | 752 | 147.6 |
| C | 8 | 128 | 10763 | 58.51 | 737 | 743 | 171.3 |
| C | 8 | 112 | 5833 | 29.72 | 737 | 743 | 171.3 |
| C | 13 | 61 | 5620 | 28.48 | 737 | 743 | 171.3 |
| D | 5 | 233 | 188396 | 952.82 | 745 | 727 | 197.0 |
| D | 2 | 152 | 169459 | 856.68 | 745 | 727 | 197.0 |
| D | 7 | 71 | 137226 | 693.03 | 745 | 727 | 197.0 |
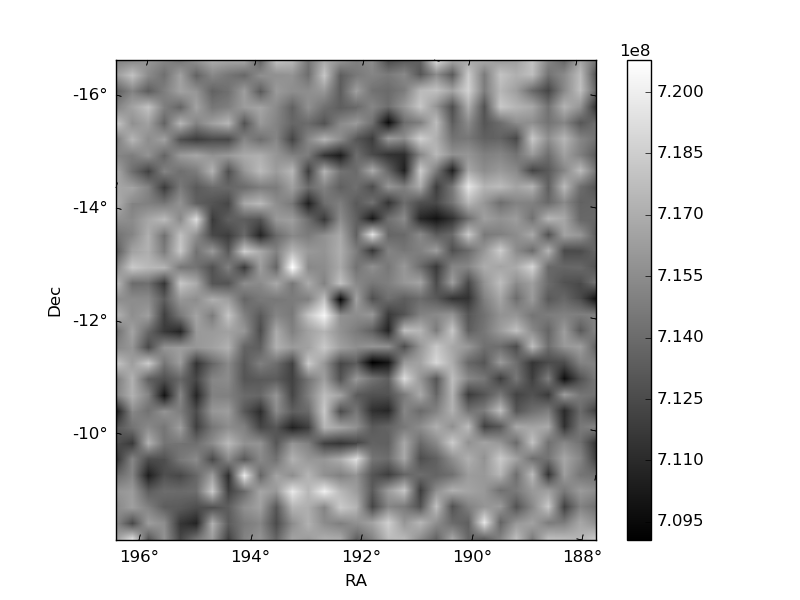
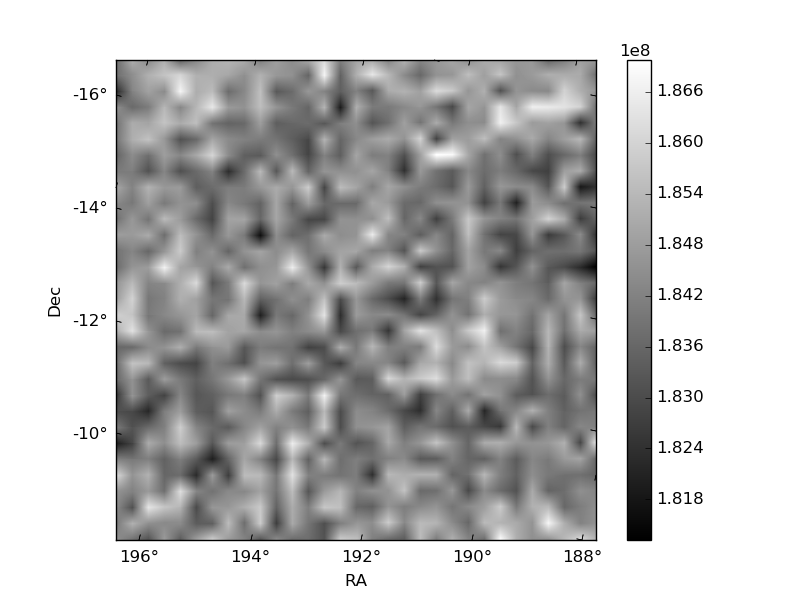
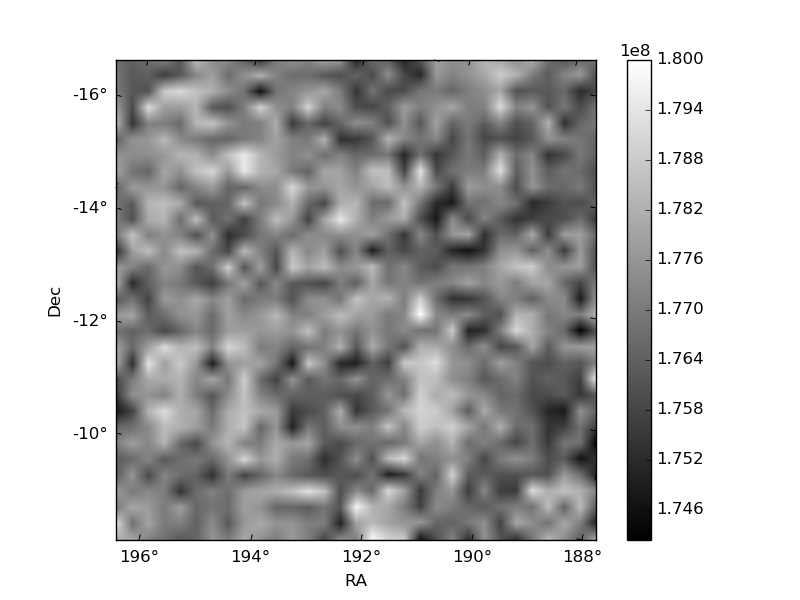
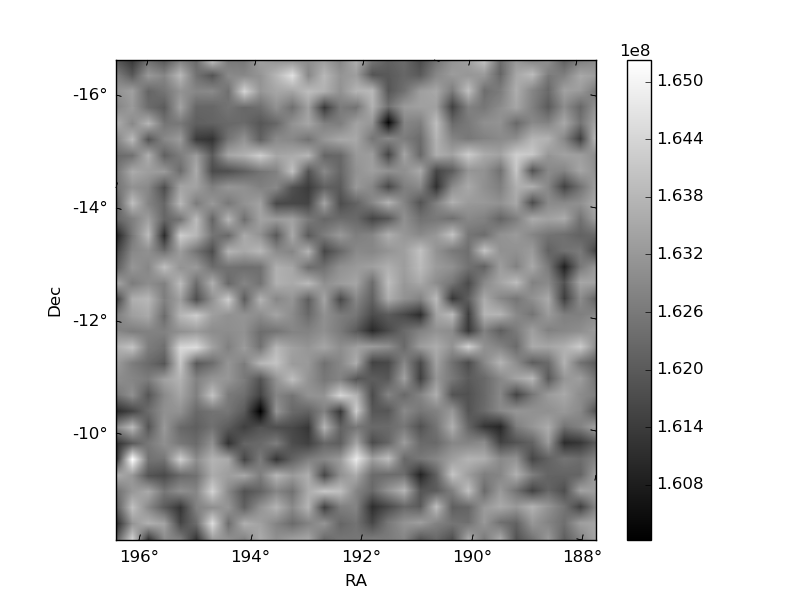
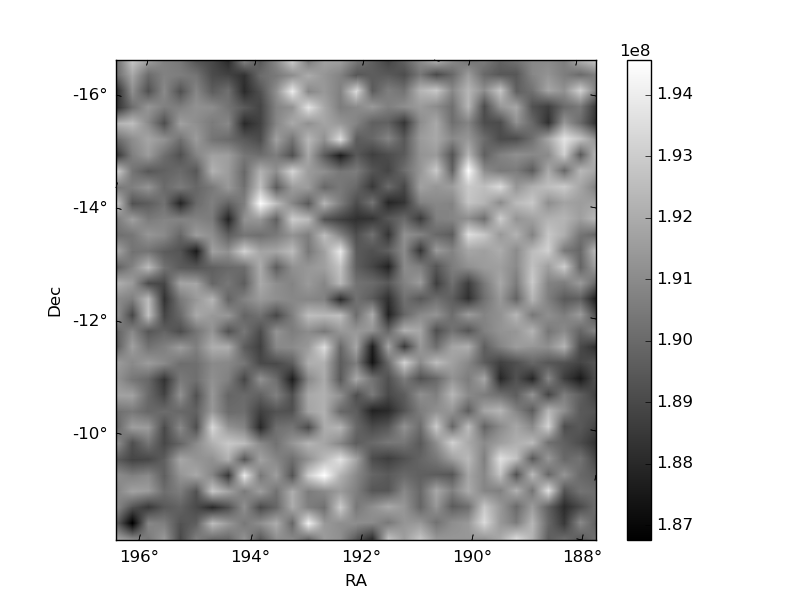
Histogram calculated using DETX and DETY for each event in the final _common_clean file
| Quadrant A | 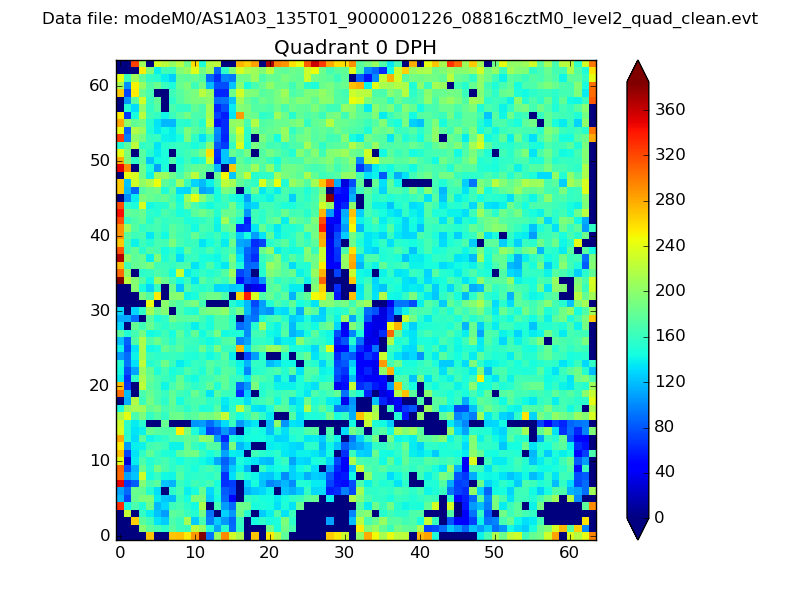 |
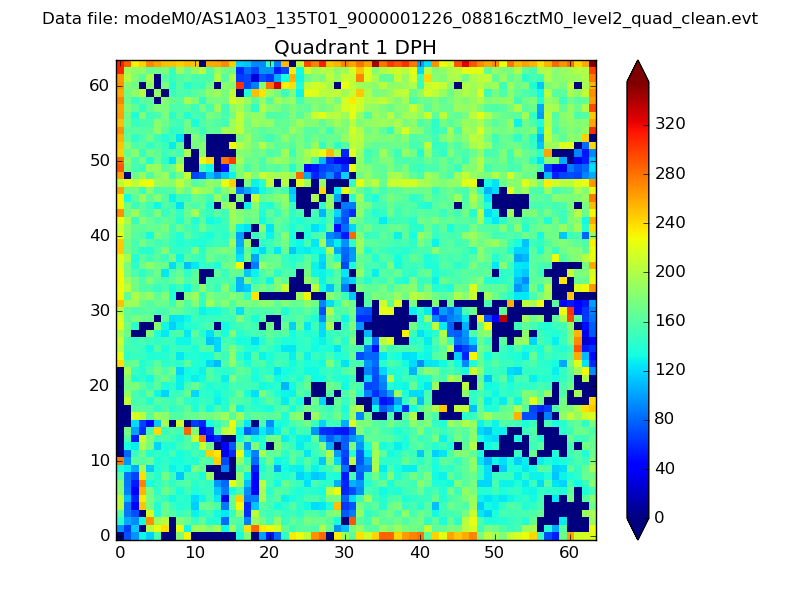 |
Quadrant B |
|---|---|---|---|
| Quadrant D | 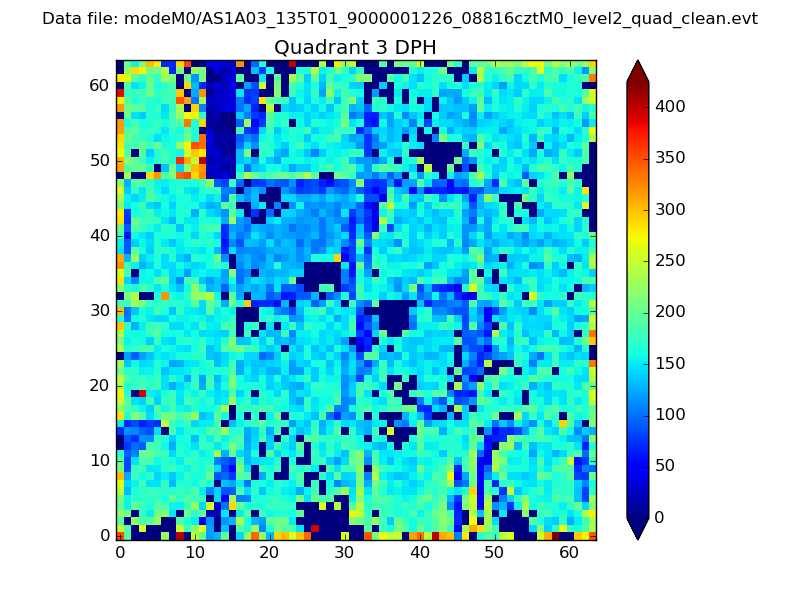 |
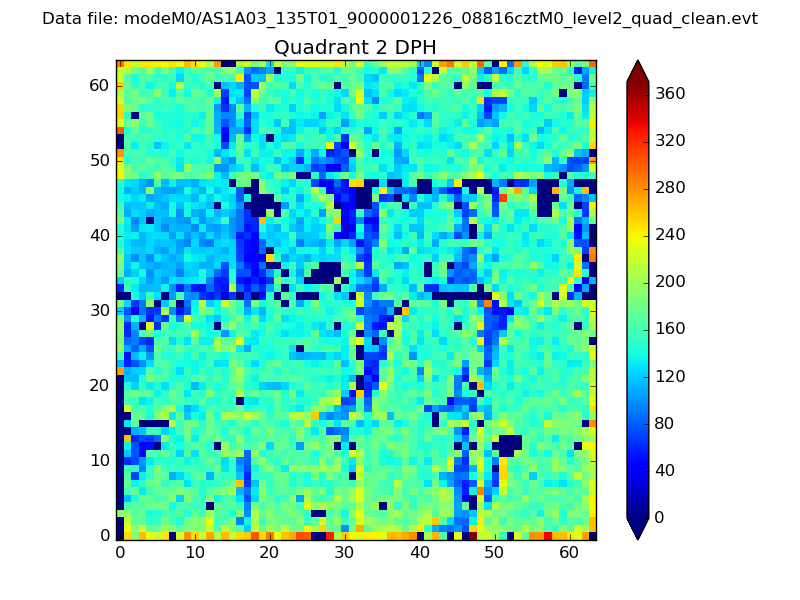 |
Quadrant C |
| Plot type | Count rate plots | Images |
|---|---|---|
| Comparison with Poisson distribution Blue bars denote a histogram of data divided into 1 sec bins. Red curve is a Poisson curve with rate = median count rate of data. |
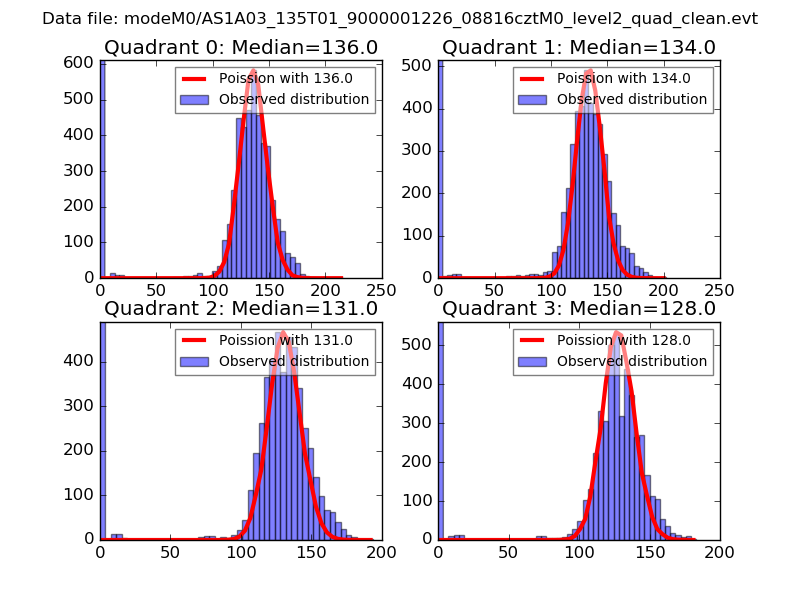 |
 |
| Quadrant-wise count rates Data is divided into 100 sec bins |
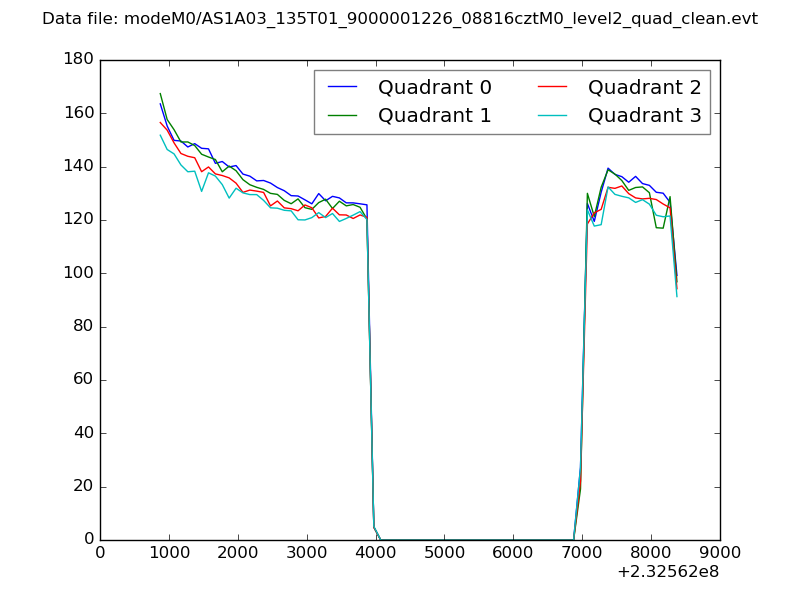 |
|
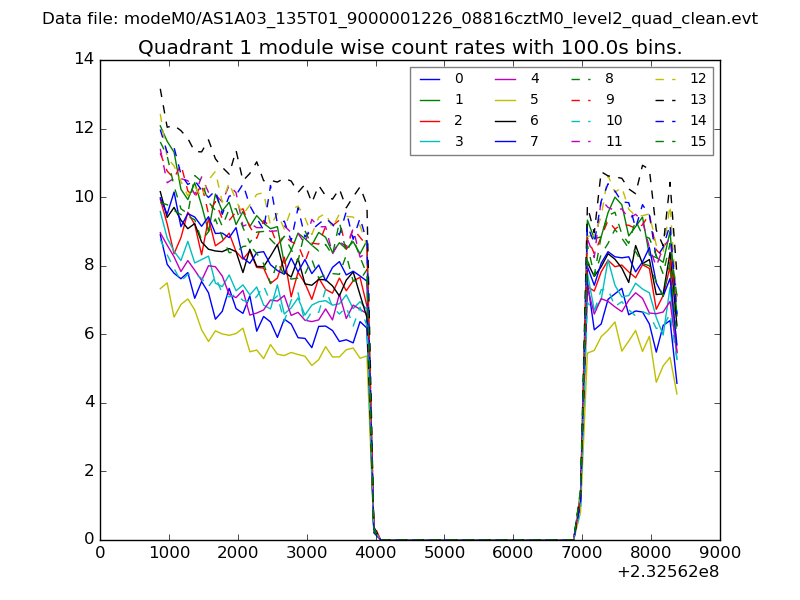
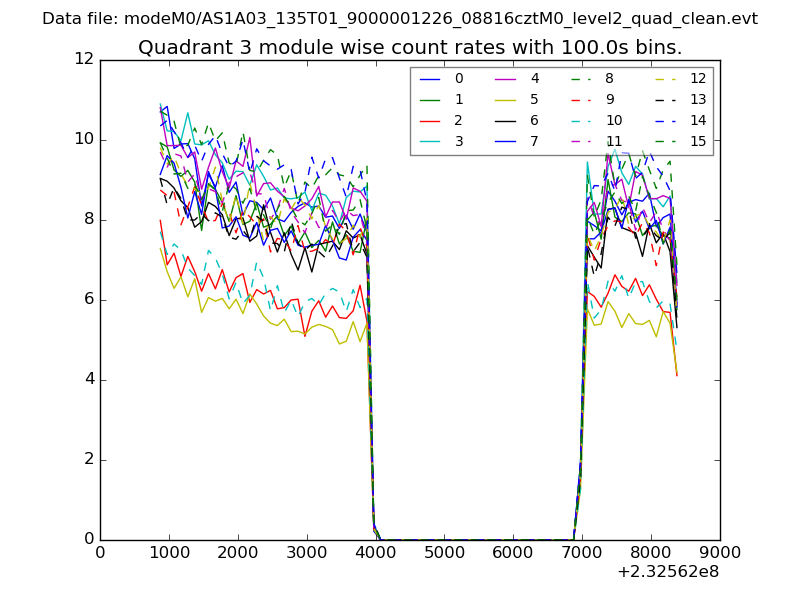
| Module-wise count rates for Quadrant A Data is divided into 100 sec bins |
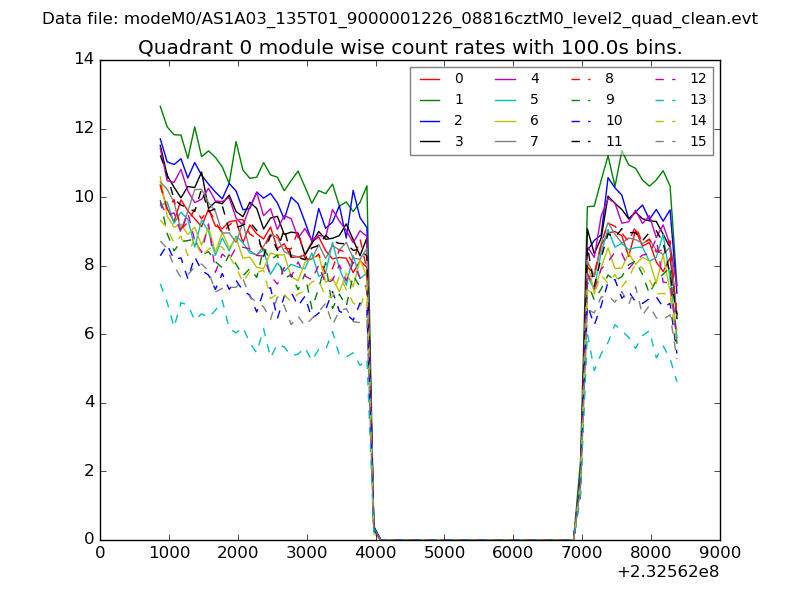 |
 |
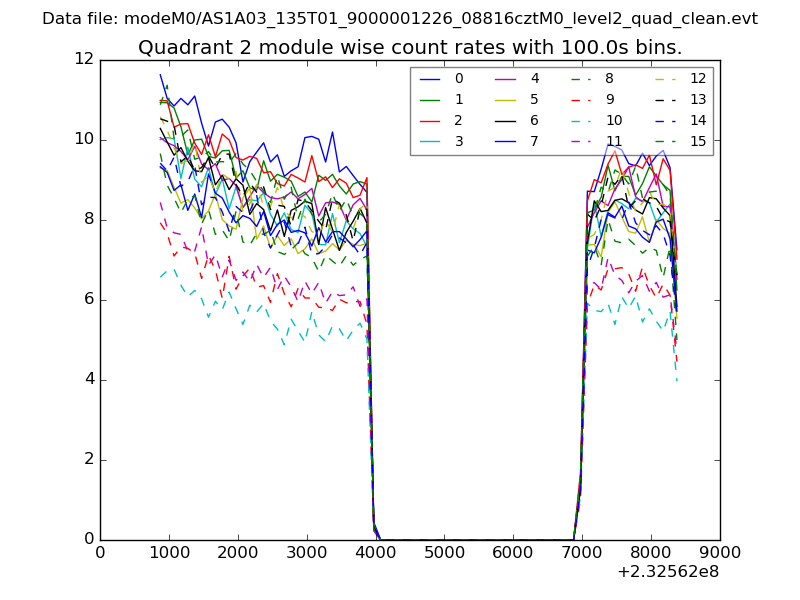
| Module-wise count rates for Quadrant B Data is divided into 100 sec bins |
 |
 |
| Module-wise count rates for Quadrant C Data is divided into 100 sec bins |
 |
 |
| Module-wise count rates for Quadrant D Data is divided into 100 sec bins |
 |
 |
| Parameter | Plot |
|---|---|
| CZT HV Monitor | 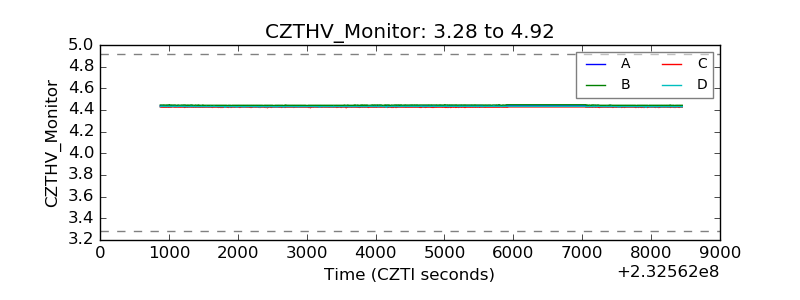 |
| D_VDD | 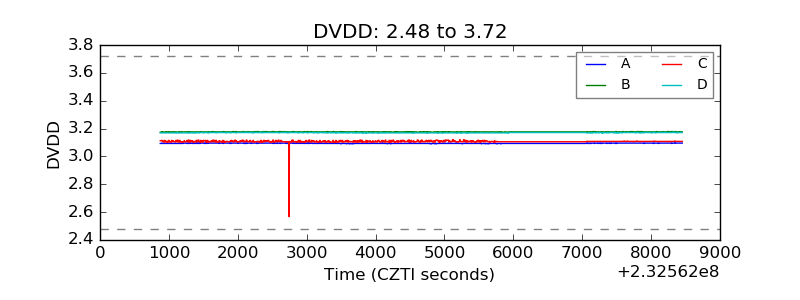 |
| Temperature 1 | 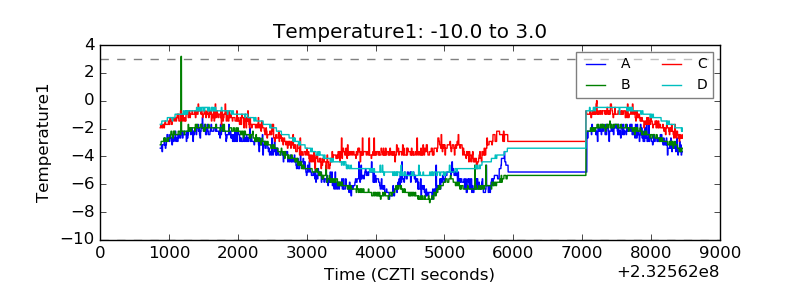 |
| Veto HV Monitor | 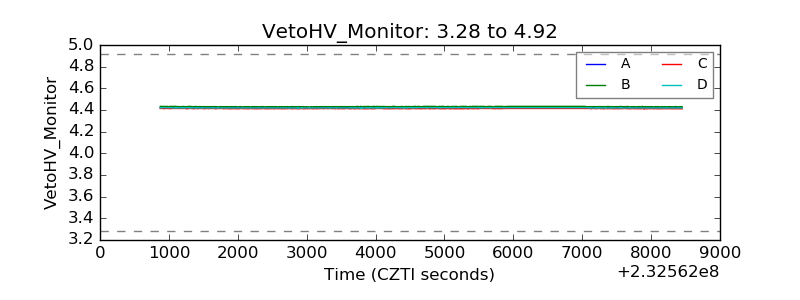 |
| Veto LLD | 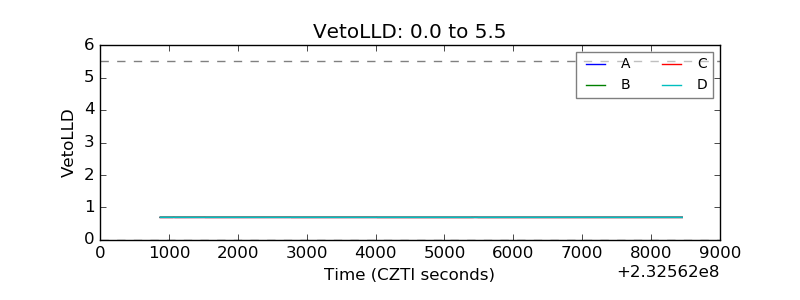 |
| Alpha Counter | 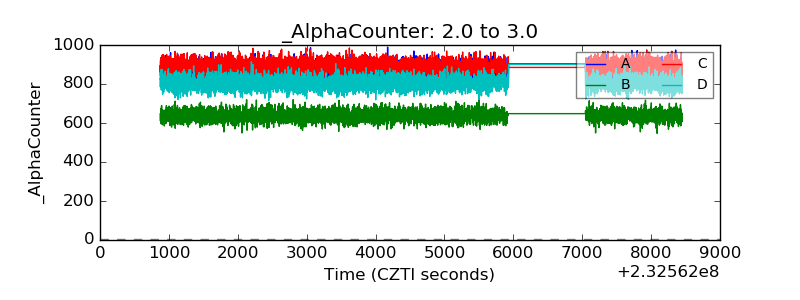 |
| _CPM_Rate | 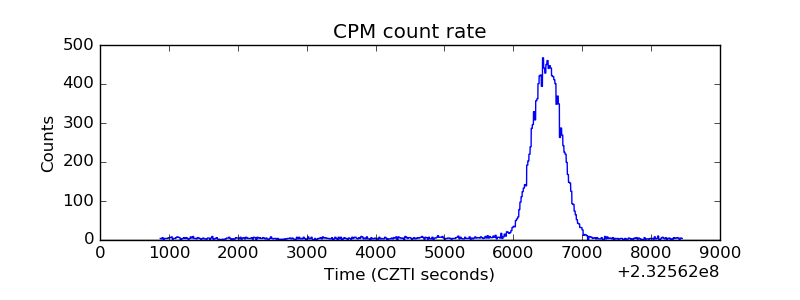 |
| CZT Counter | 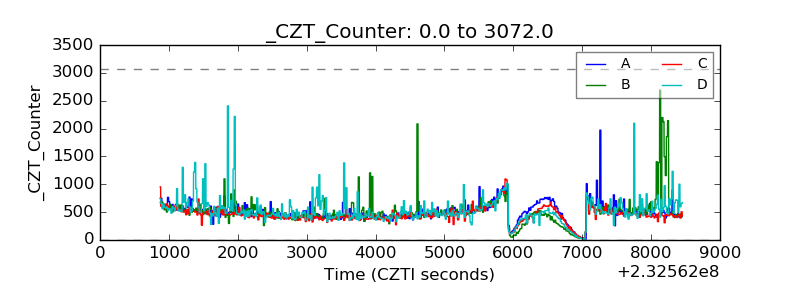 |
| +2.5 Volts monitor |  |
| +5 Volts monitor | 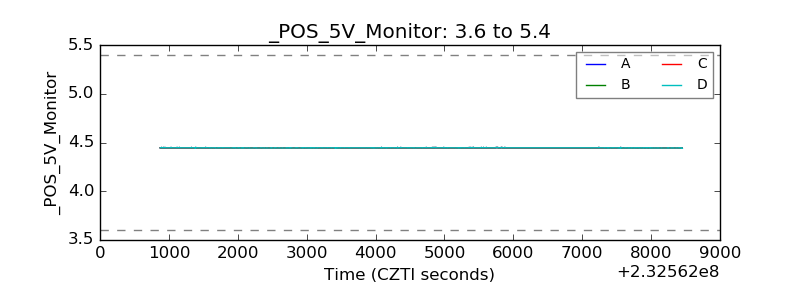 |
| _ROLL_ROT | 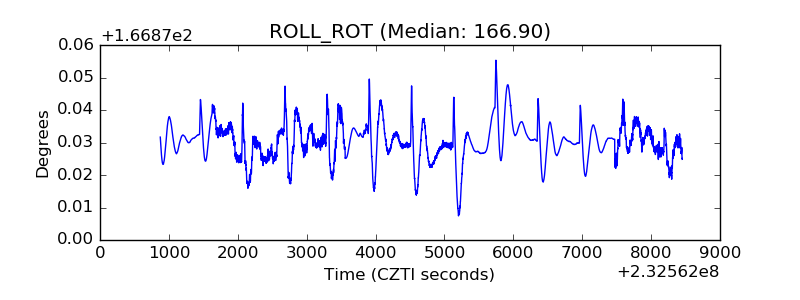 |
| _Roll_DEC | 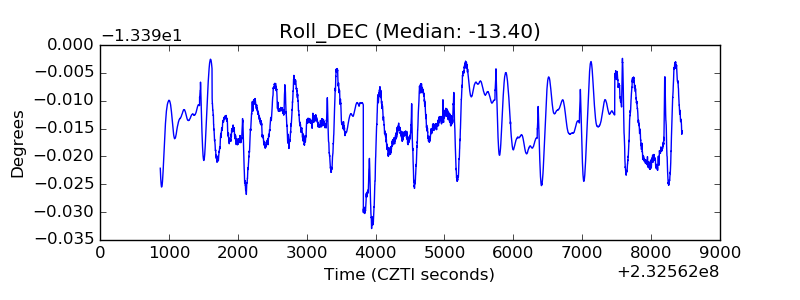 |
| _Roll_RA | 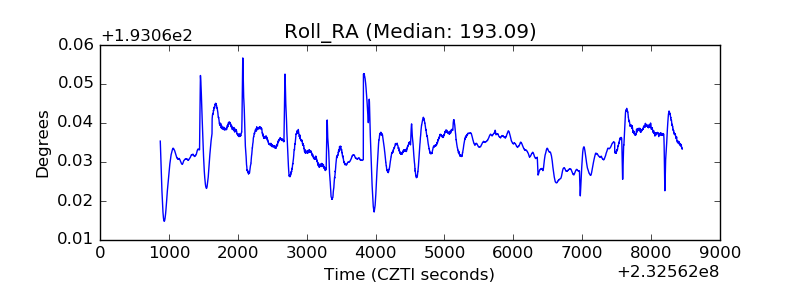 |
| Veto Counter | 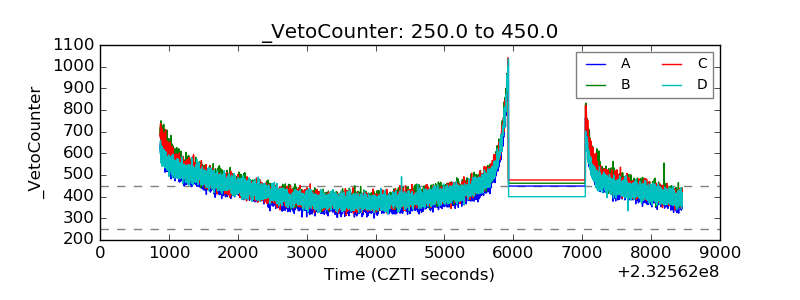 |