| Param | Original file | Final file |
|---|---|---|
| Filename | modeM0/AS1A03_135T01_9000001226_08817cztM0_level2.evt | modeM0/AS1A03_135T01_9000001226_08817cztM0_level2_quad_clean.evt |
| Size (bytes) | 777,588,480 | 157,423,680 |
| Size | 741.6 MB | 150.1 MB |
| Events in quadrant A | 5,684,780 | 1,030,984 |
| Events in quadrant B | 6,161,651 | 1,008,939 |
| Events in quadrant C | 5,013,760 | 995,593 |
| Events in quadrant D | 5,946,501 | 973,362 |
| Mode SS | |||
|---|---|---|---|
| Quadrant | BADHDUFLAG | Total packets | Discarded packets |
| A | 0 | 224 | 0 |
| B | 0 | 224 | 0 |
| C | 0 | 224 | 0 |
| D | 0 | 224 | 0 |
| Mode M0 | |||
|---|---|---|---|
| Quadrant | BADHDUFLAG | Total packets | Discarded packets |
| A | 0 | 23774 | 38 |
| B | 0 | 25441 | 22 |
| C | 0 | 22510 | 29 |
| D | 0 | 25103 | 43 |
| Mode M9 | |||
|---|---|---|---|
| Quadrant | BADHDUFLAG | Total packets | Discarded packets |
| A | 0 | 11 | 0 |
| B | 0 | 11 | 0 |
| C | 0 | 11 | 0 |
| D | 0 | 11 | 0 |
| Quadrant | Total seconds | Saturated seconds | Saturation percentage |
|---|---|---|---|
| A | 10956 | 94 | 0.857977% |
| B | 10963 | 267 | 2.435465% |
| C | 10959 | 37 | 0.337622% |
| D | 10951 | 80 | 0.730527% |
Noise dominated data is calculated using 1-second bins in cleaned event files. If a bin has >2000 counts, and if more than 50% of those come from <1% of pixels, then it is considered to be noise-dominated and hence unusable.
| Quadrant | # 1 sec bins | Bins with >0 counts | Bins with >2000 counts | High rate bins dominated by noise | Noise dominated (total time) | Noise dominated (detector-on time) | Marked lightcurve |
|---|---|---|---|---|---|---|---|
| A | 19666 | 10973 | 11 | 11 | 0.06% | 0.10% |  |
| B | 19666 | 10972 | 186 | 186 | 0.95% | 1.70% |  |
| C | 19666 | 10973 | 1 | 1 | 0.01% | 0.01% | 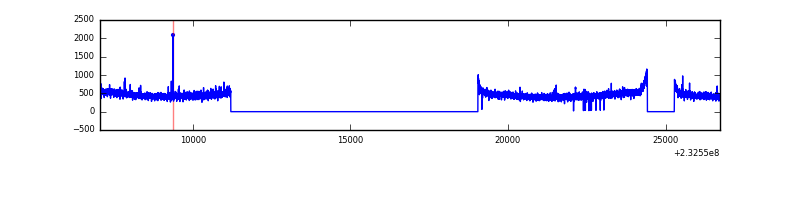 |
| D | 19666 | 10972 | 50 | 50 | 0.25% | 0.46% |  |
Top three noisy pixels from each quadrant. If the there are fewer than three noisy pixels in the level2.evt file, extra rows are filled as -1
| Pixel properties | Quadrant properties | ||||||
|---|---|---|---|---|---|---|---|
| Quadrant | DetID | PixID | Counts | Sigma | Mean | Median | Sigma |
| A | 8 | 5 | 424769 | 1569.04 | 1340 | 1316 | 269.9 |
| A | 15 | 174 | 42761 | 153.57 | 1340 | 1316 | 269.9 |
| A | 13 | 251 | 20449 | 70.89 | 1340 | 1316 | 269.9 |
| B | 10 | 16 | 858824 | 3383.09 | 1324 | 1293 | 253.5 |
| B | 0 | 214 | 108309 | 422.19 | 1324 | 1293 | 253.5 |
| B | 4 | 173 | 26581 | 99.77 | 1324 | 1293 | 253.5 |
| C | 9 | 68 | 16279 | 51.01 | 1277 | 1288 | 293.9 |
| C | 13 | 61 | 9809 | 28.99 | 1277 | 1288 | 293.9 |
| C | 12 | 4 | 9155 | 26.77 | 1277 | 1288 | 293.9 |
| D | 2 | 152 | 318832 | 936.37 | 1281 | 1253 | 339.2 |
| D | 5 | 233 | 251246 | 737.1 | 1281 | 1253 | 339.2 |
| D | 7 | 71 | 238850 | 700.55 | 1281 | 1253 | 339.2 |
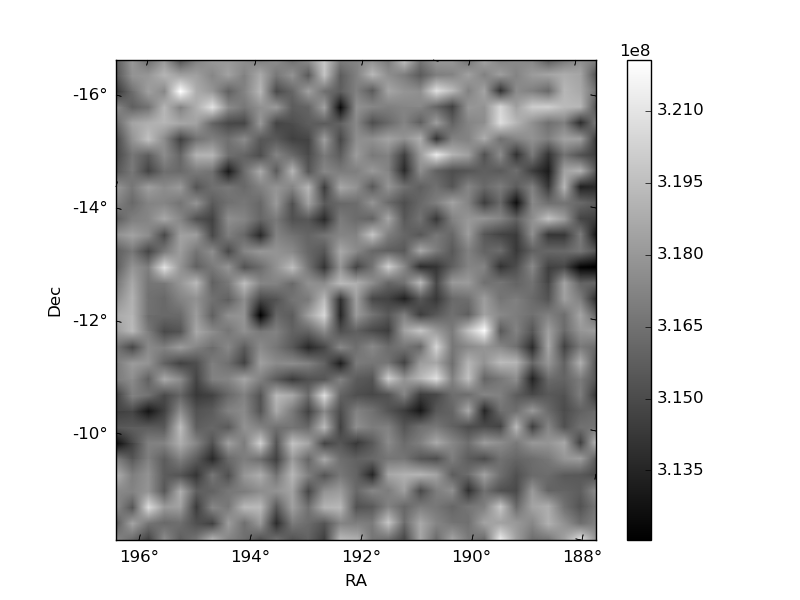
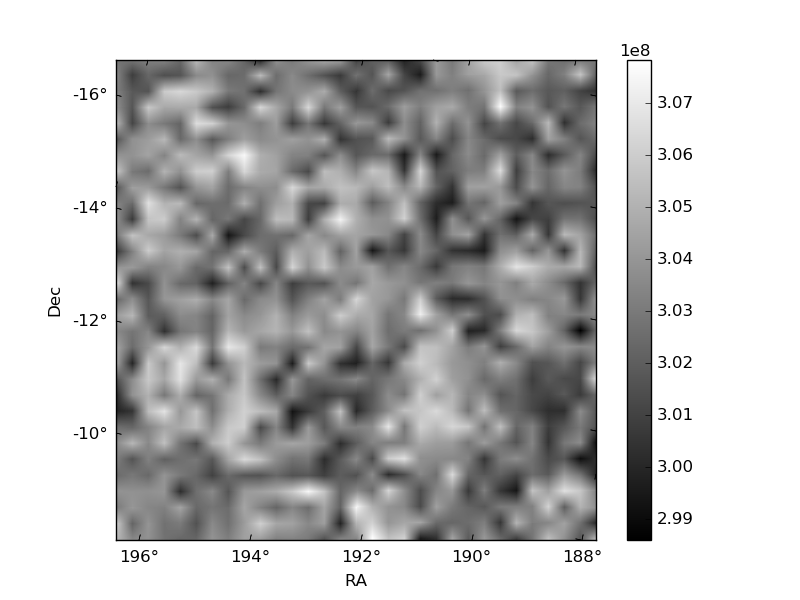
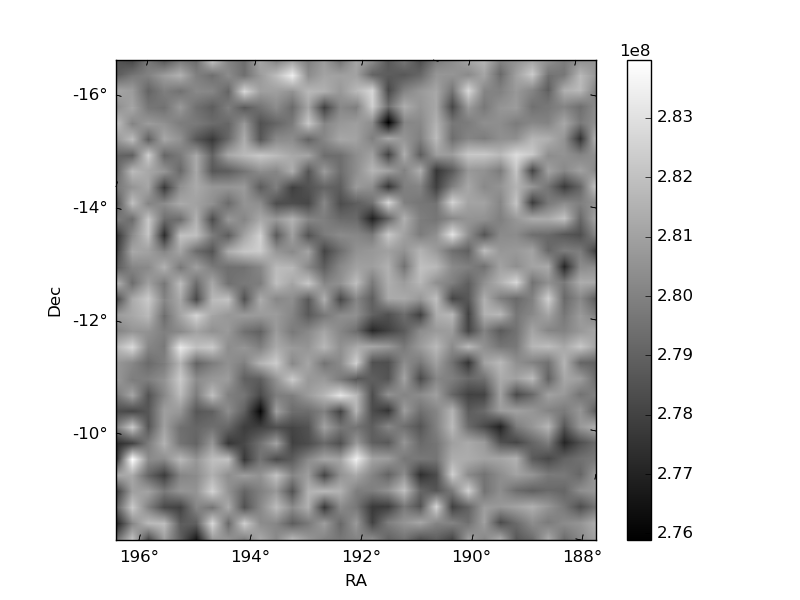
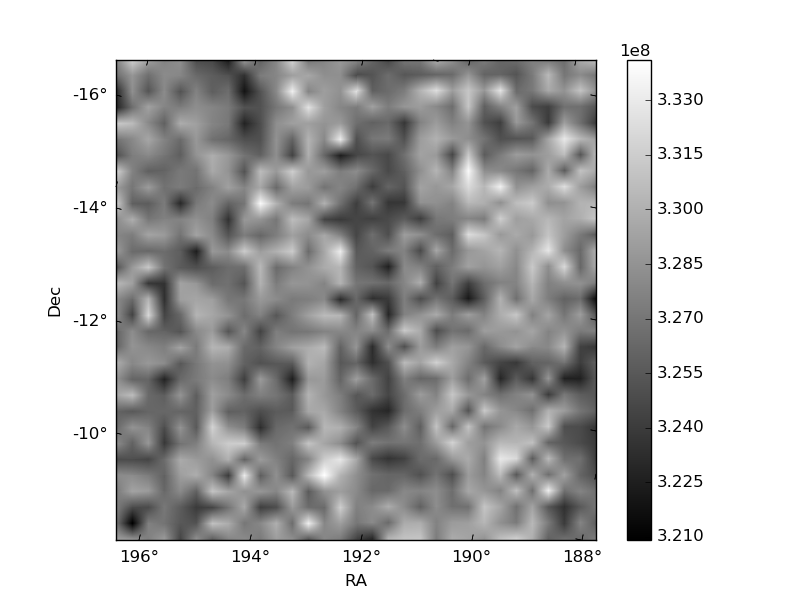
Histogram calculated using DETX and DETY for each event in the final _common_clean file
| Quadrant A | 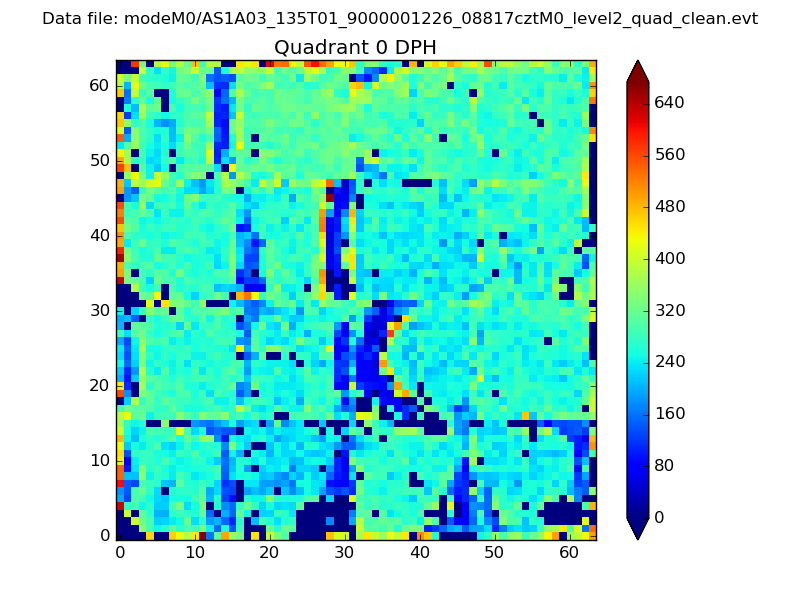 |
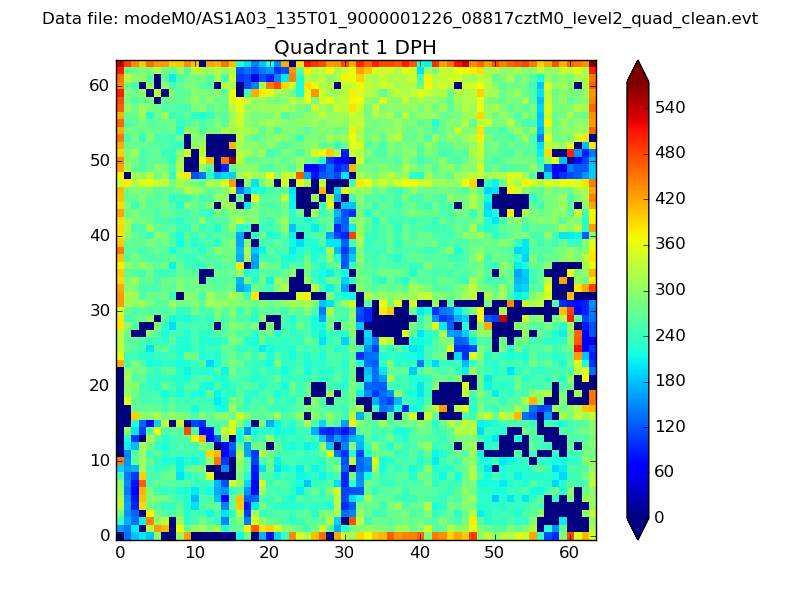 |
Quadrant B |
|---|---|---|---|
| Quadrant D | 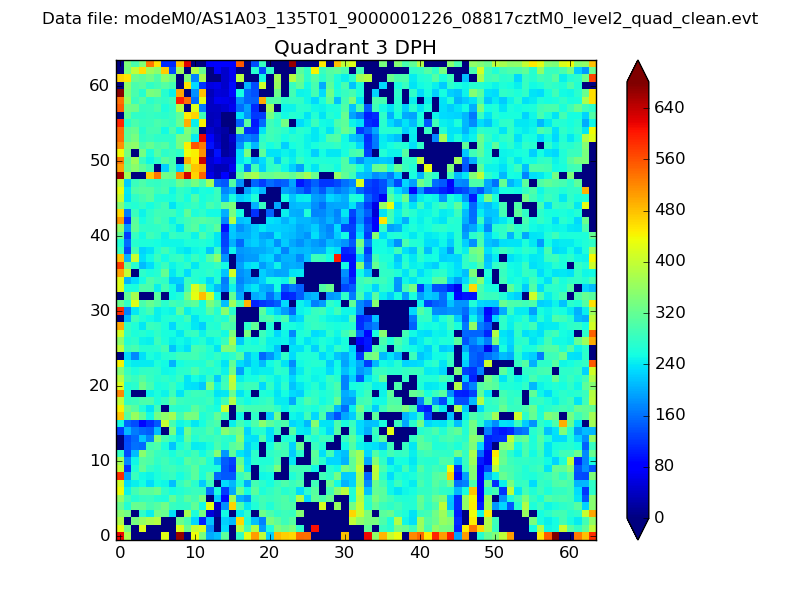 |
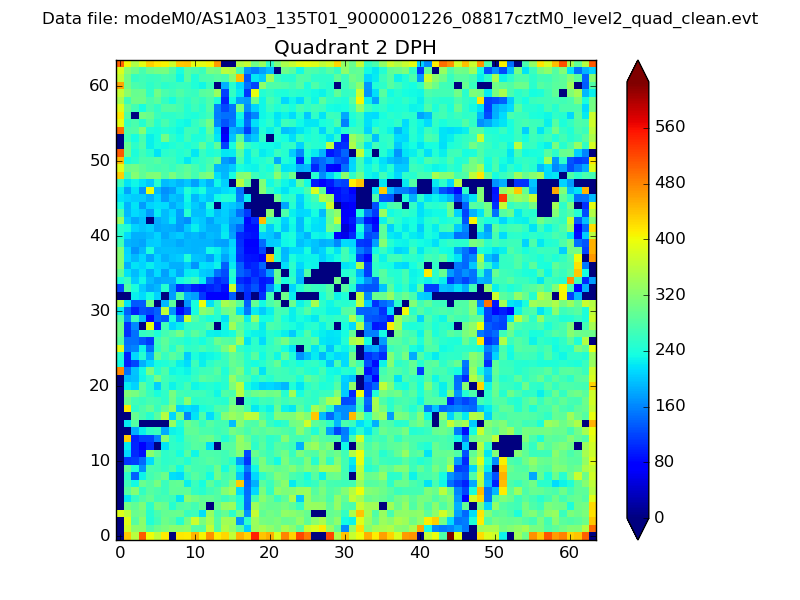 |
Quadrant C |
| Plot type | Count rate plots | Images |
|---|---|---|
| Comparison with Poisson distribution Blue bars denote a histogram of data divided into 1 sec bins. Red curve is a Poisson curve with rate = median count rate of data. |
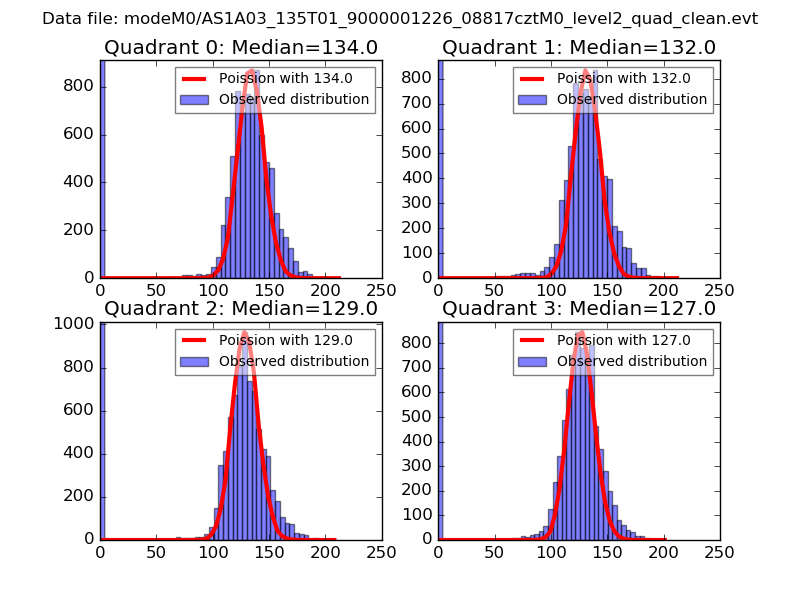 |
 |
| Quadrant-wise count rates Data is divided into 100 sec bins |
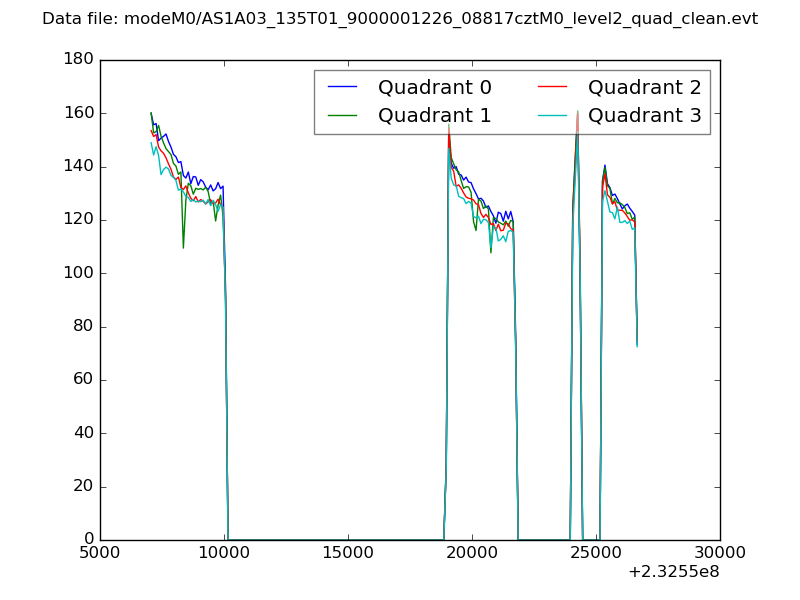 |
|
| Module-wise count rates for Quadrant A Data is divided into 100 sec bins |
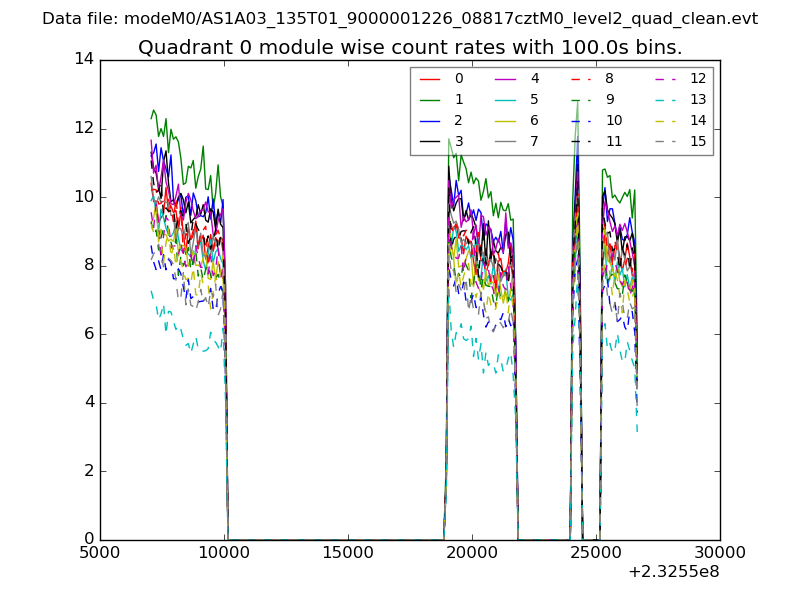 |
 |
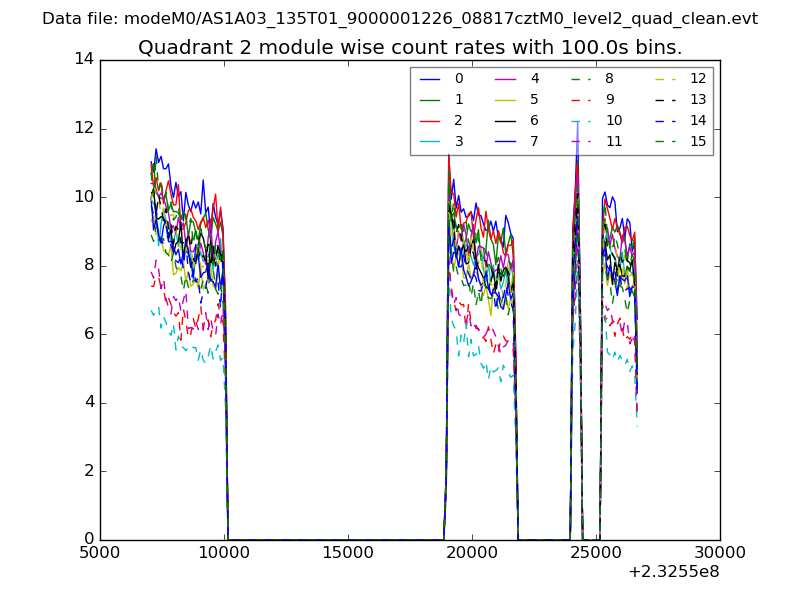
| Module-wise count rates for Quadrant B Data is divided into 100 sec bins |
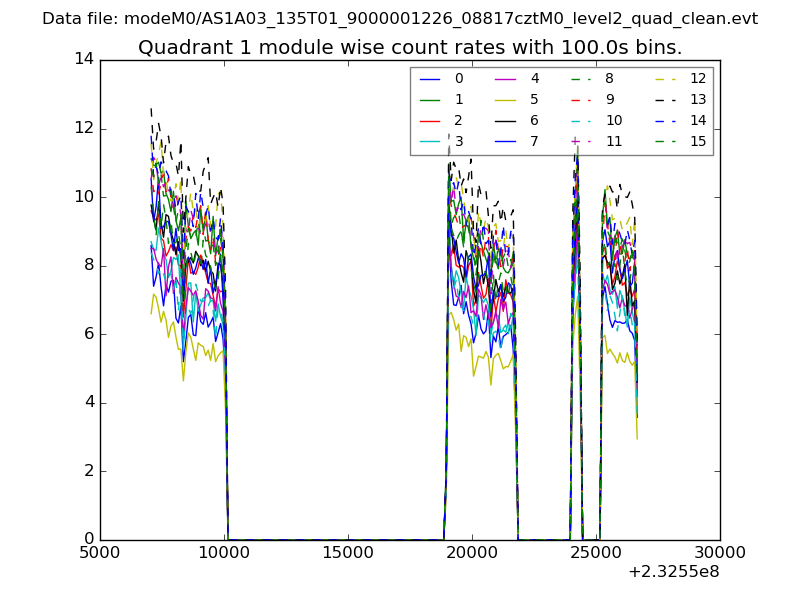 |
 |
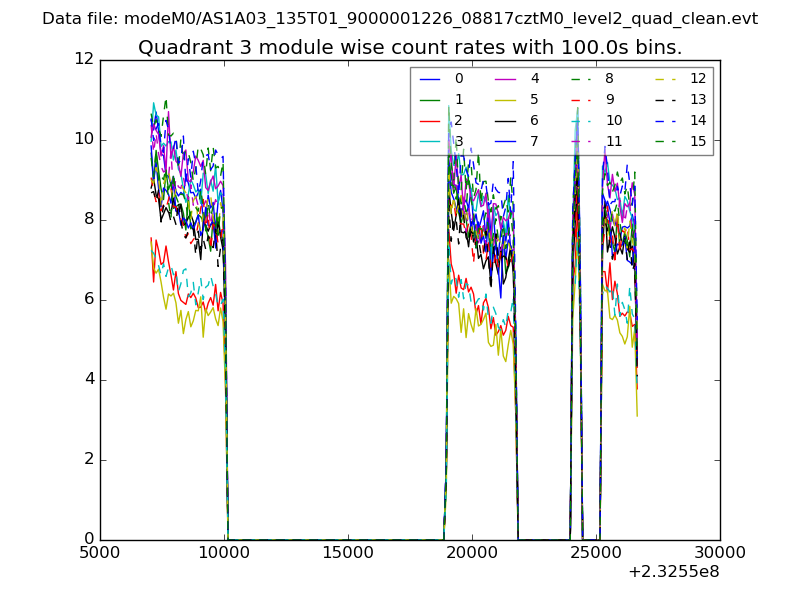
| Module-wise count rates for Quadrant C Data is divided into 100 sec bins |
 |
 |
| Module-wise count rates for Quadrant D Data is divided into 100 sec bins |
 |
 |
| Parameter | Plot |
|---|---|
| CZT HV Monitor | 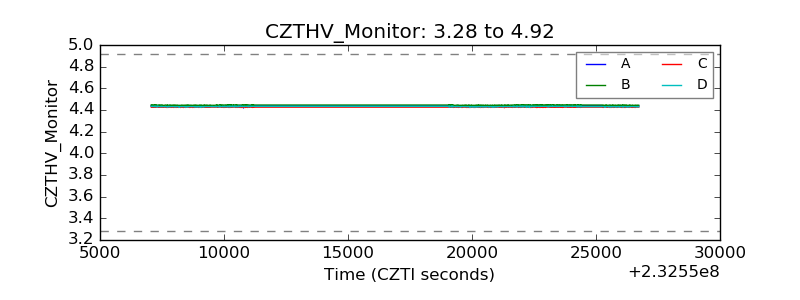 |
| D_VDD | 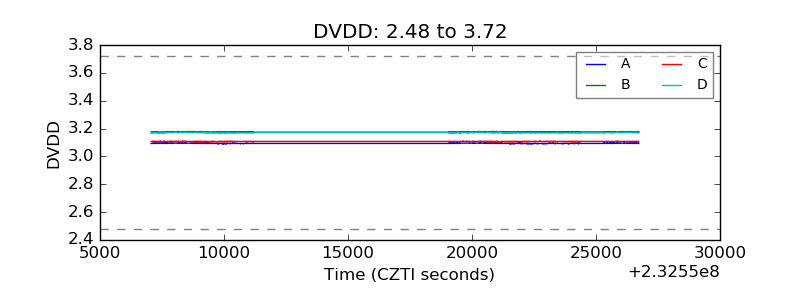 |
| Temperature 1 | 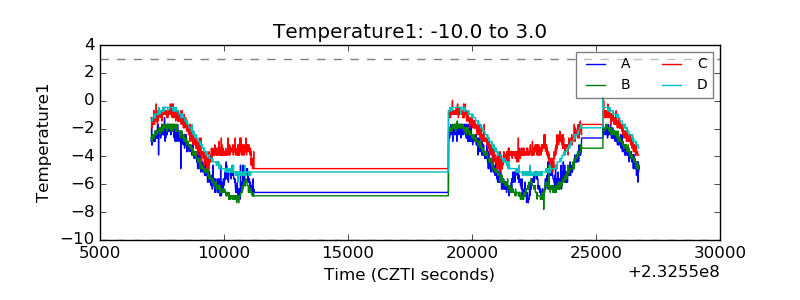 |
| Veto HV Monitor | 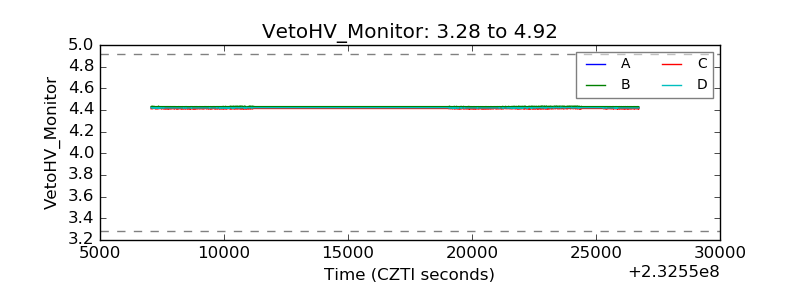 |
| Veto LLD |  |
| Alpha Counter | 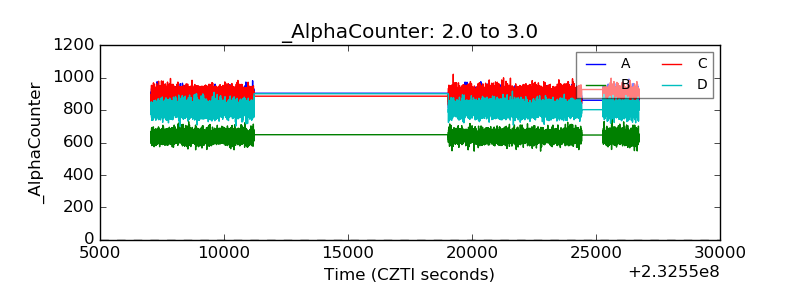 |
| _CPM_Rate | 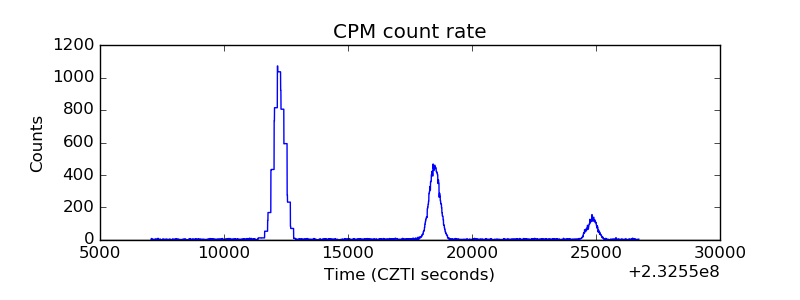 |
| CZT Counter | 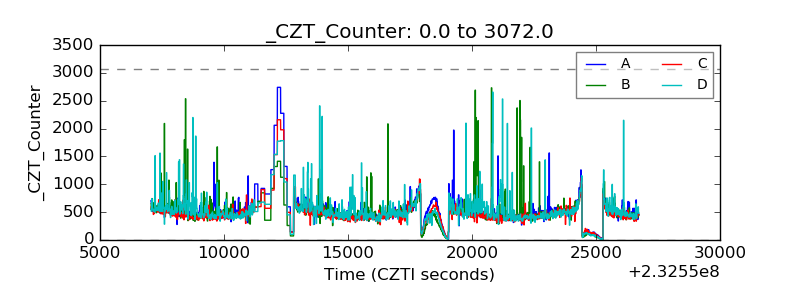 |
| +2.5 Volts monitor |  |
| +5 Volts monitor |  |
| _ROLL_ROT | 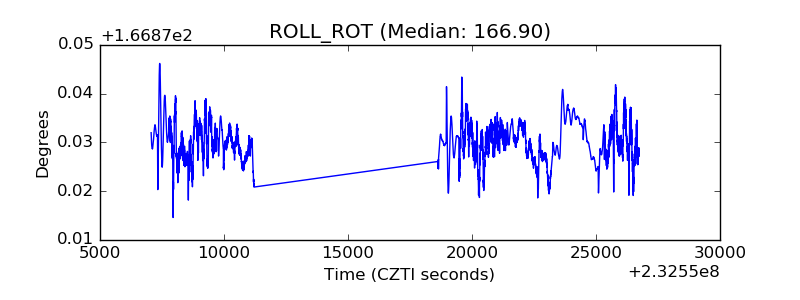 |
| _Roll_DEC | 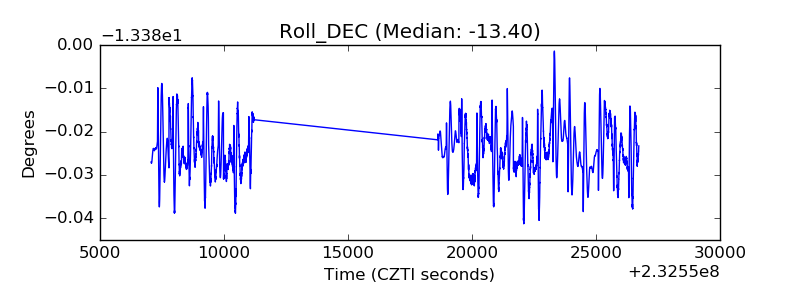 |
| _Roll_RA | 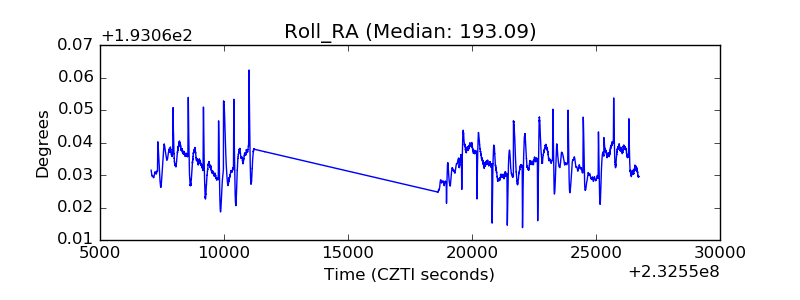 |
| Veto Counter | 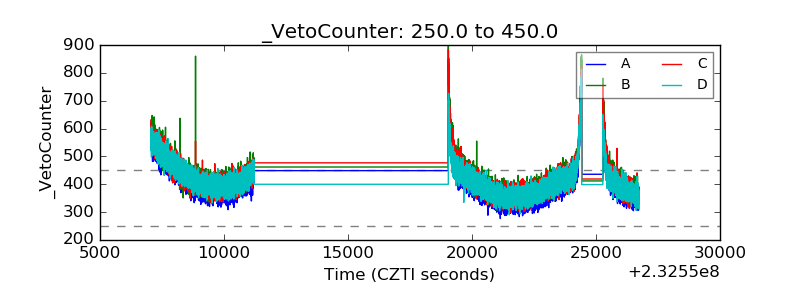 |