| Param | Original file | Final file |
|---|---|---|
| Filename | modeM0/AS1A03_135T01_9000001226_08824cztM0_level2.evt | modeM0/AS1A03_135T01_9000001226_08824cztM0_level2_quad_clean.evt |
| Size (bytes) | 695,450,880 | 66,942,720 |
| Size | 663.2 MB | 63.8 MB |
| Events in quadrant A | 4,698,984 | 359,838 |
| Events in quadrant B | 4,145,468 | 363,810 |
| Events in quadrant C | 3,971,650 | 356,111 |
| Events in quadrant D | 7,653,196 | 339,723 |
| Mode SS | |||
|---|---|---|---|
| Quadrant | BADHDUFLAG | Total packets | Discarded packets |
| A | 0 | 216 | 32 |
| B | 0 | 219 | 45 |
| C | 0 | 214 | 30 |
| D | 0 | 217 | 29 |
| Mode M0 | |||
|---|---|---|---|
| Quadrant | BADHDUFLAG | Total packets | Discarded packets |
| A | 0 | 23840 | 4284 |
| B | 0 | 22476 | 4218 |
| C | 0 | 21986 | 3921 |
| D | 0 | 33603 | 5048 |
| Mode M9 | |||
|---|---|---|---|
| Quadrant | BADHDUFLAG | Total packets | Discarded packets |
| A | 0 | 8 | 1 |
| B | 0 | 9 | 1 |
| C | 0 | 9 | 2 |
| D | 0 | 8 | 0 |
| Quadrant | Total seconds | Saturated seconds | Saturation percentage |
|---|---|---|---|
| A | 8721 | 58 | 0.665061% |
| B | 8728 | 69 | 0.790559% |
| C | 8728 | 20 | 0.229148% |
| D | 8710 | 1038 | 11.917336% |
Noise dominated data is calculated using 1-second bins in cleaned event files. If a bin has >2000 counts, and if more than 50% of those come from <1% of pixels, then it is considered to be noise-dominated and hence unusable.
| Quadrant | # 1 sec bins | Bins with >0 counts | Bins with >2000 counts | High rate bins dominated by noise | Noise dominated (total time) | Noise dominated (detector-on time) | Marked lightcurve |
|---|---|---|---|---|---|---|---|
| A | 25361 | 9005 | 9 | 9 | 0.04% | 0.10% | 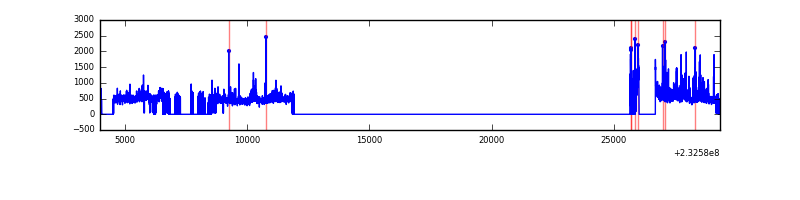 |
| B | 25365 | 9022 | 27 | 27 | 0.11% | 0.30% | 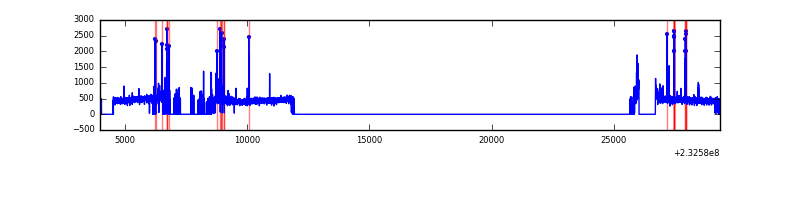 |
| C | 25363 | 9020 | 6 | 6 | 0.02% | 0.07% | 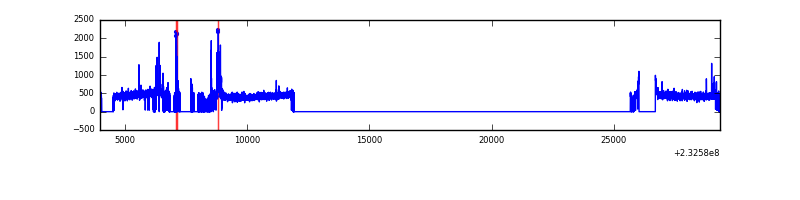 |
| D | 25347 | 8999 | 1020 | 1020 | 4.02% | 11.33% | 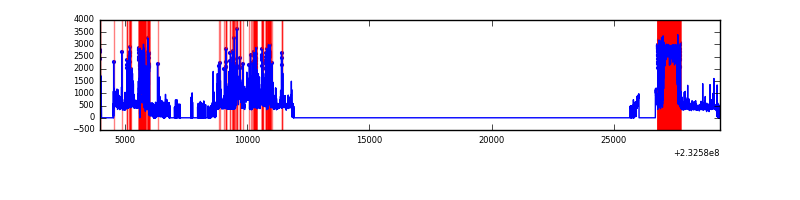 |
Top three noisy pixels from each quadrant. If the there are fewer than three noisy pixels in the level2.evt file, extra rows are filled as -1
| Pixel properties | Quadrant properties | ||||||
|---|---|---|---|---|---|---|---|
| Quadrant | DetID | PixID | Counts | Sigma | Mean | Median | Sigma |
| A | 8 | 5 | 783871 | 3839.21 | 999 | 978 | 203.9 |
| A | 13 | 251 | 23850 | 112.16 | 999 | 978 | 203.9 |
| A | 13 | 248 | 10789 | 48.11 | 999 | 978 | 203.9 |
| B | 10 | 16 | 170923 | 877.32 | 1009 | 983 | 193.7 |
| B | 0 | 214 | 26036 | 129.34 | 1009 | 983 | 193.7 |
| B | 12 | 111 | 21757 | 107.25 | 1009 | 983 | 193.7 |
| C | 9 | 54 | 160196 | 701.24 | 971 | 976 | 227.1 |
| C | 12 | 4 | 10349 | 41.28 | 971 | 976 | 227.1 |
| C | 13 | 61 | 7605 | 29.2 | 971 | 976 | 227.1 |
| D | 2 | 16 | 1996162 | 8998.44 | 894 | 872 | 221.7 |
| D | 1 | 52 | 1640942 | 7396.46 | 894 | 872 | 221.7 |
| D | 2 | 152 | 429928 | 1934.98 | 894 | 872 | 221.7 |
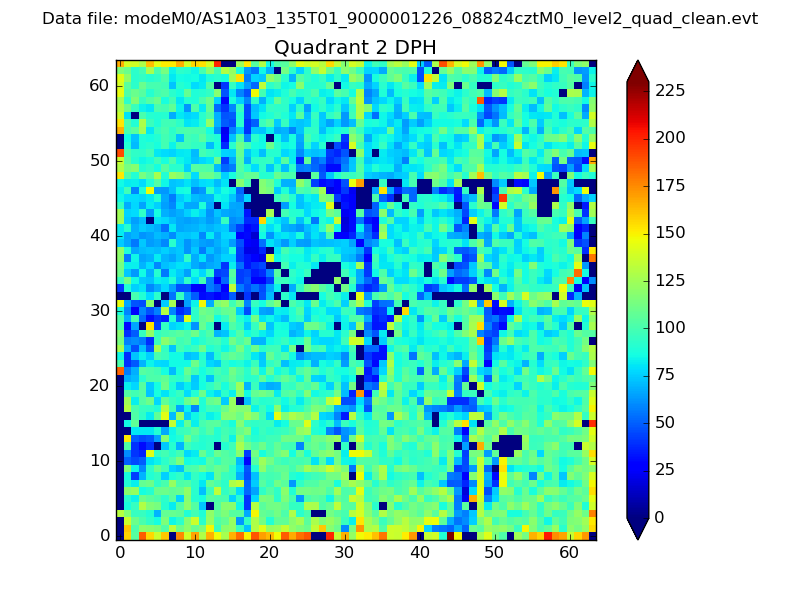
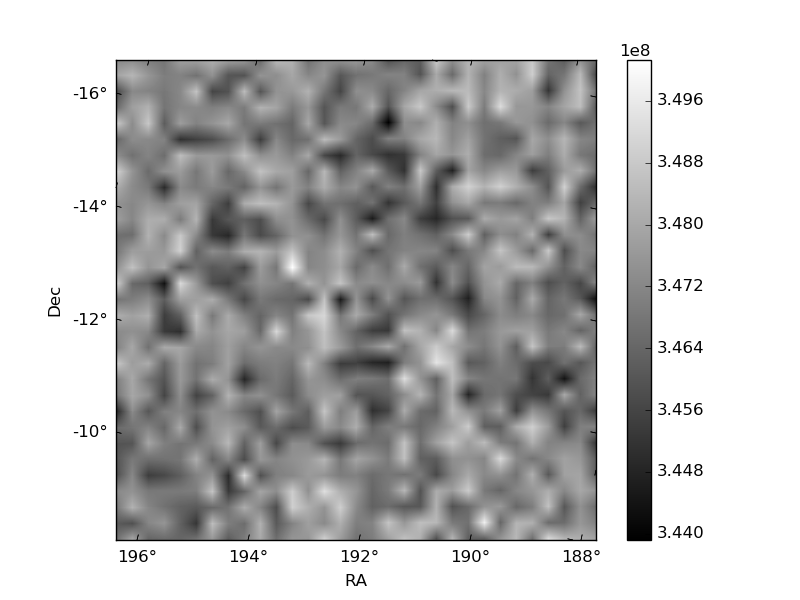
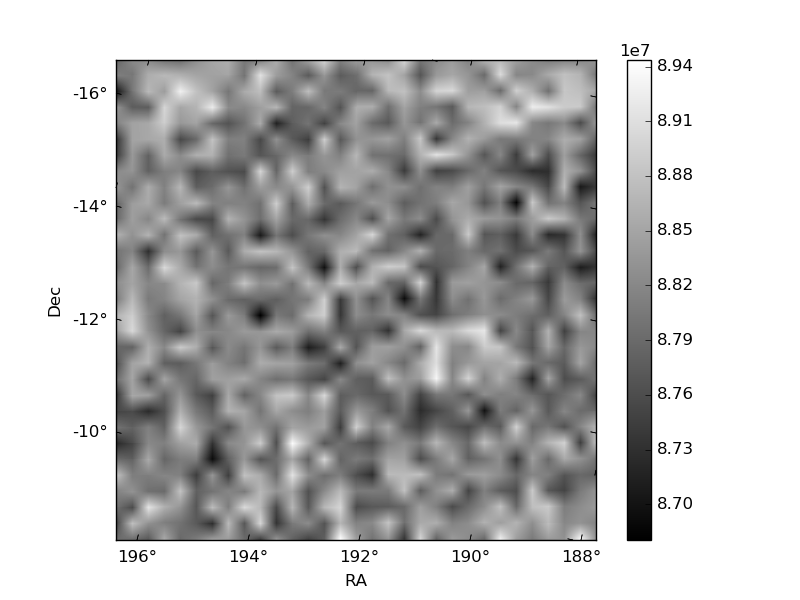
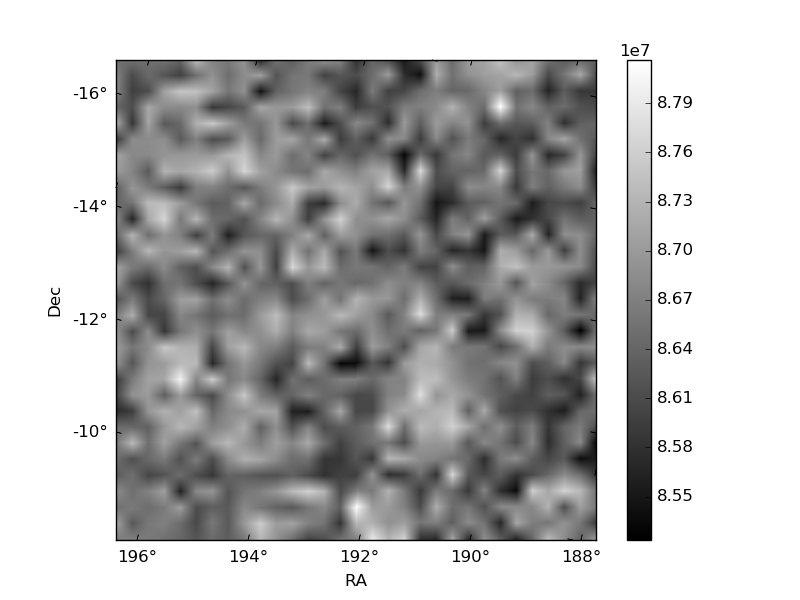
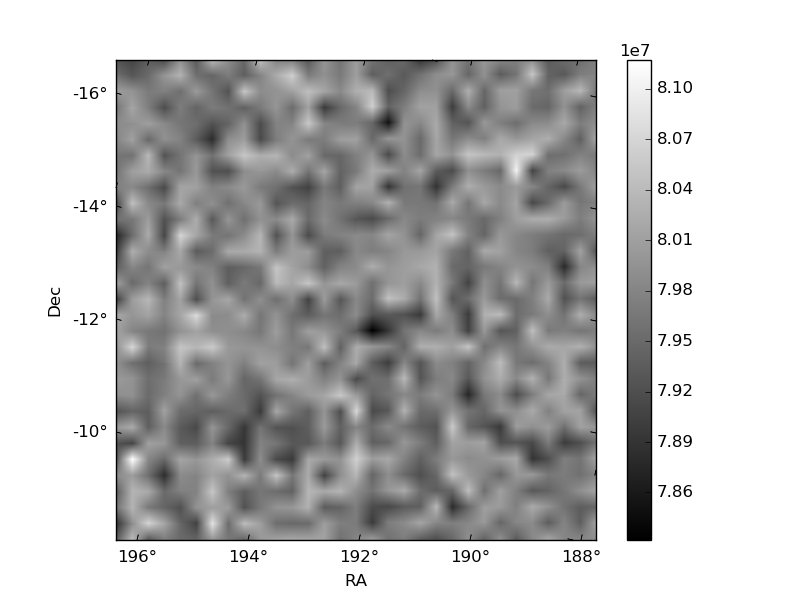
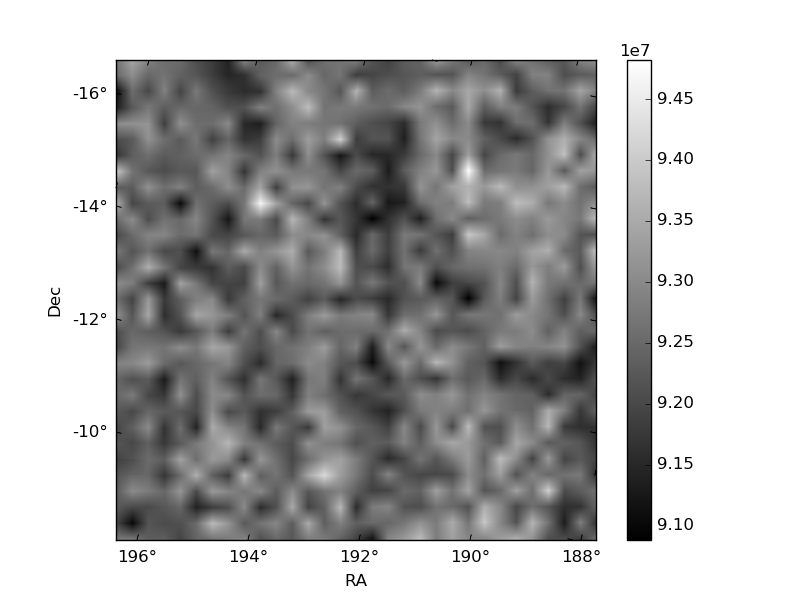
Histogram calculated using DETX and DETY for each event in the final _common_clean file
| Quadrant A | 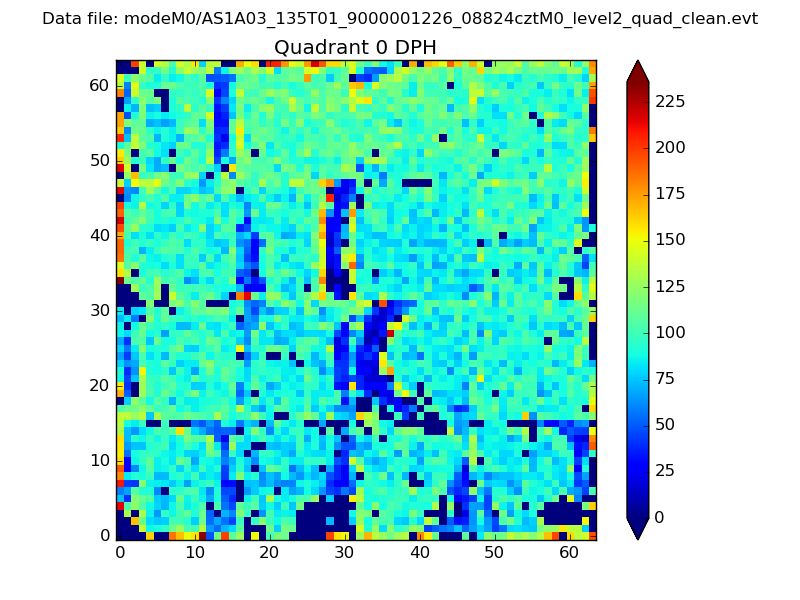 |
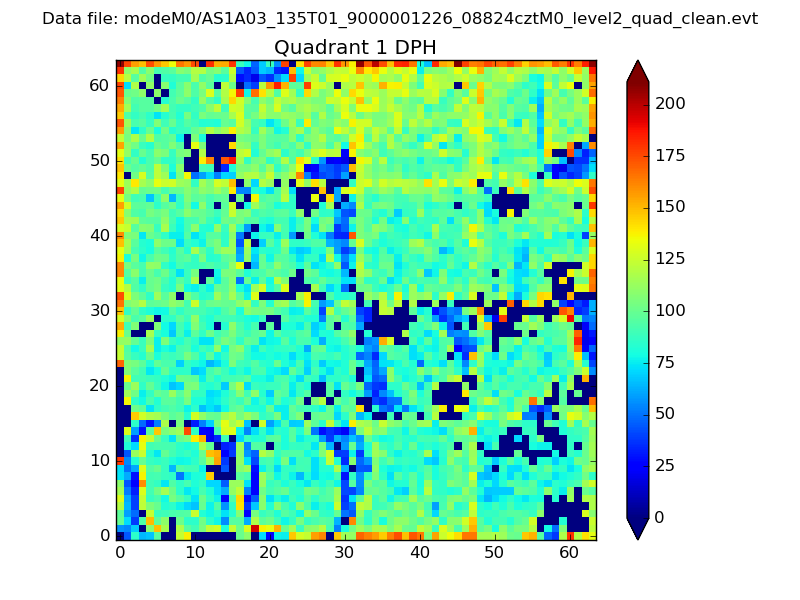 |
Quadrant B |
|---|---|---|---|
| Quadrant D | 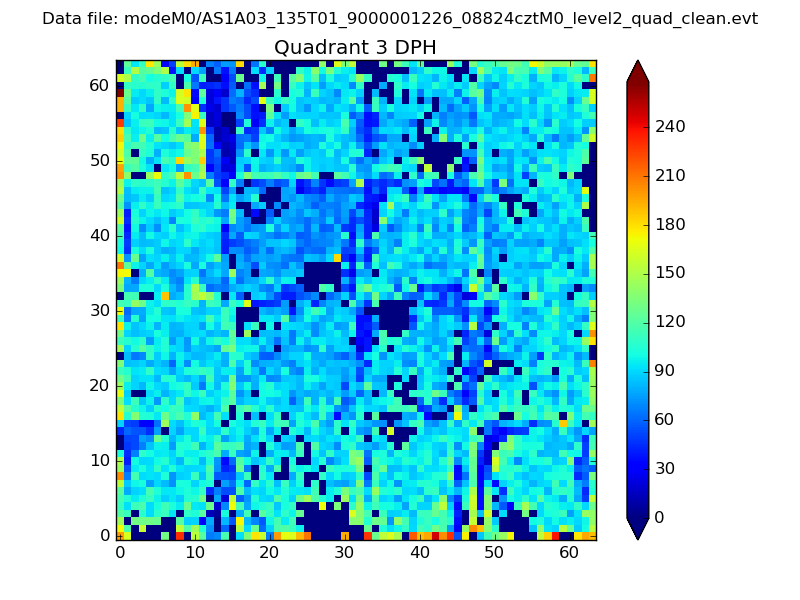 |
 |
Quadrant C |
| Plot type | Count rate plots | Images |
|---|---|---|
| Comparison with Poisson distribution Blue bars denote a histogram of data divided into 1 sec bins. Red curve is a Poisson curve with rate = median count rate of data. |
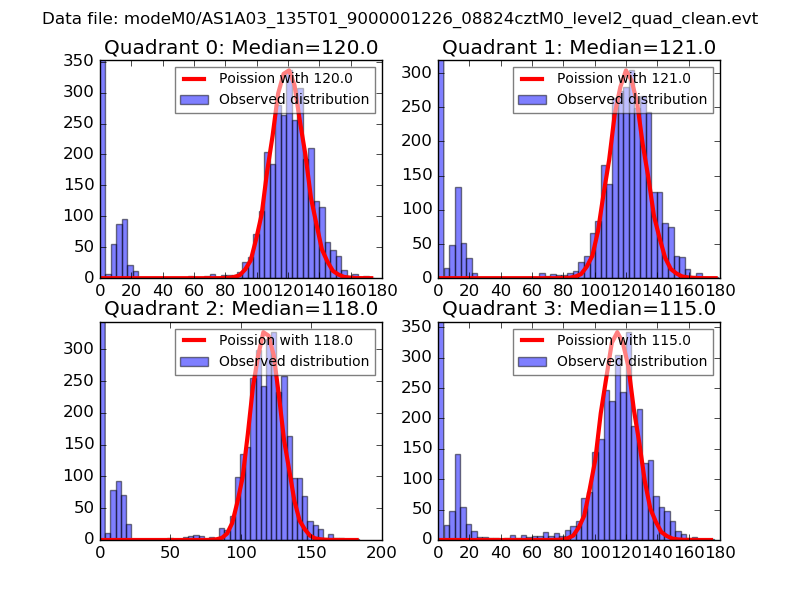 |
 |
| Quadrant-wise count rates Data is divided into 100 sec bins |
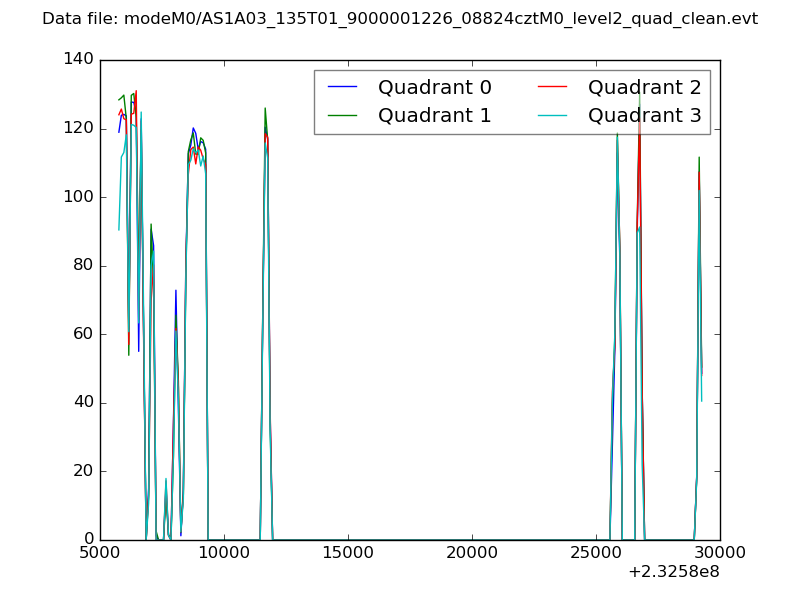 |
|
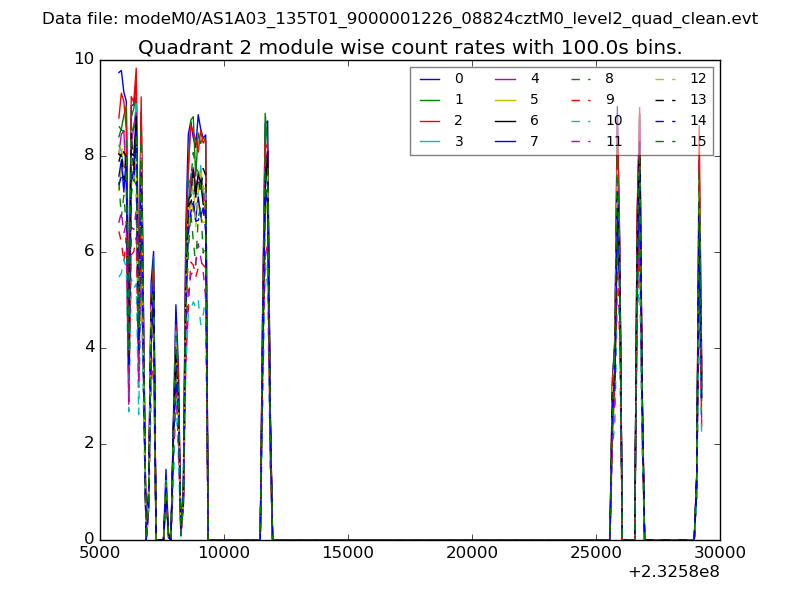
| Module-wise count rates for Quadrant A Data is divided into 100 sec bins |
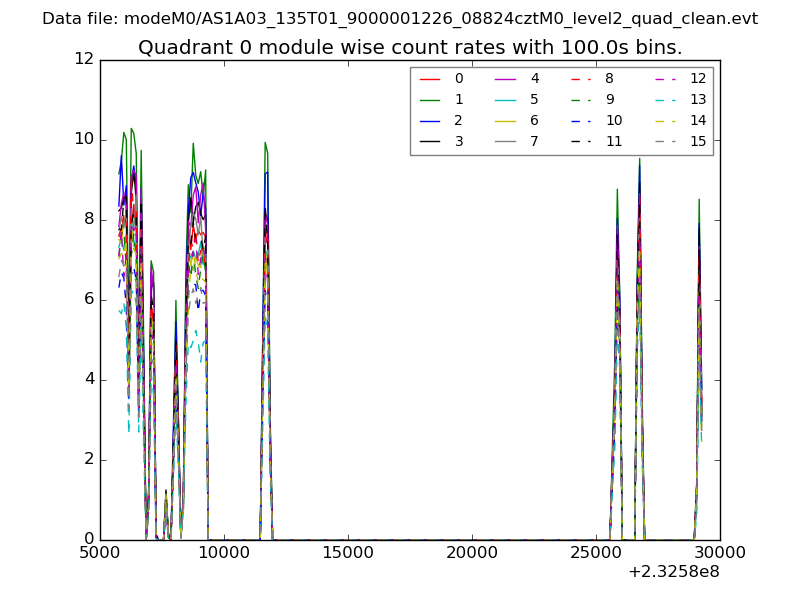 |
 |
| Module-wise count rates for Quadrant B Data is divided into 100 sec bins |
 |
 |
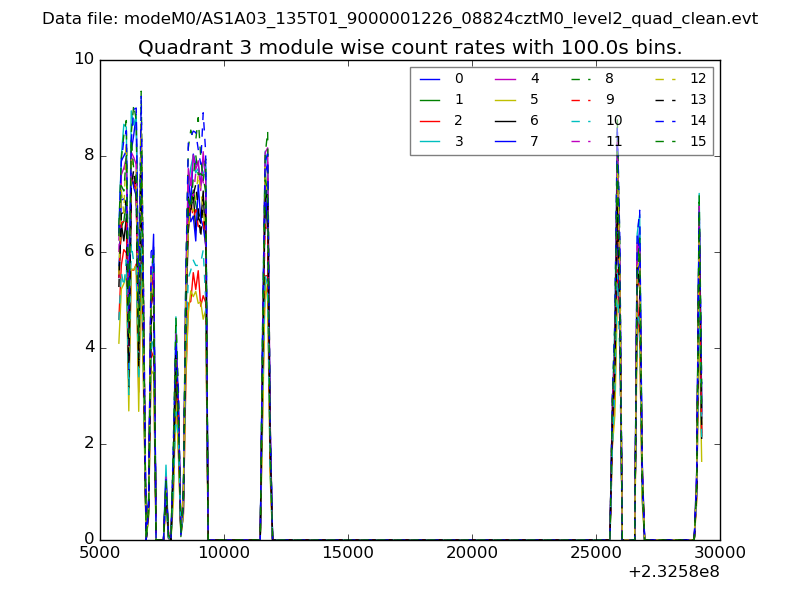
| Module-wise count rates for Quadrant C Data is divided into 100 sec bins |
 |
 |
| Module-wise count rates for Quadrant D Data is divided into 100 sec bins |
 |
 |
| Parameter | Plot |
|---|---|
| CZT HV Monitor | 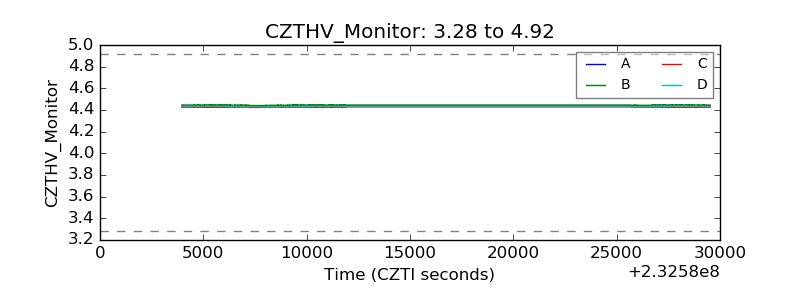 |
| D_VDD | 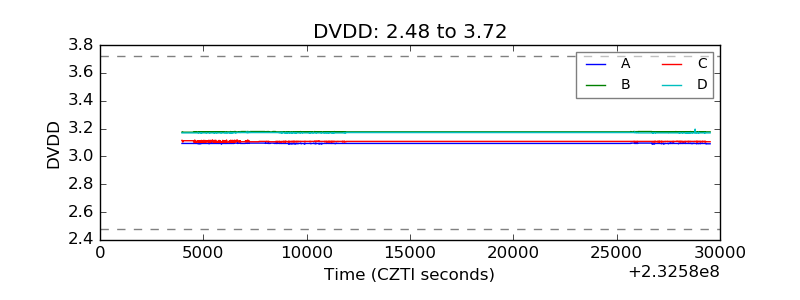 |
| Temperature 1 | 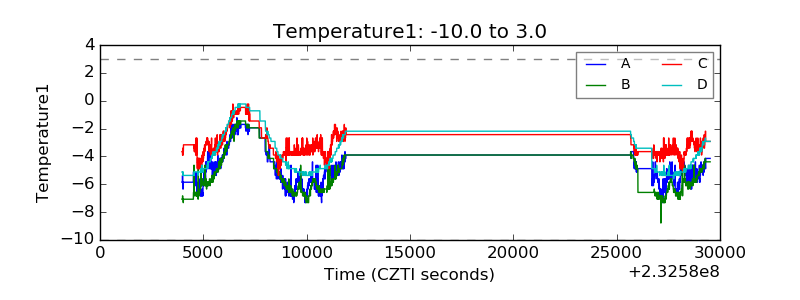 |
| Veto HV Monitor | 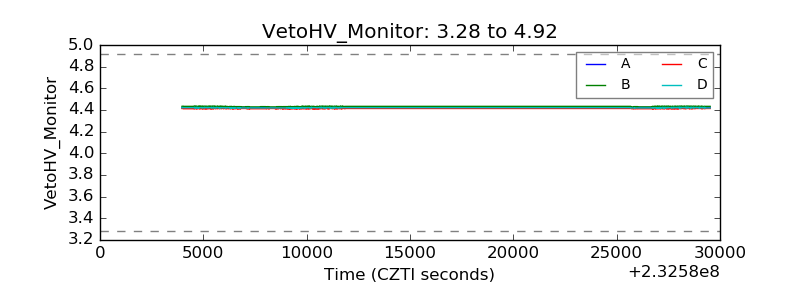 |
| Veto LLD | 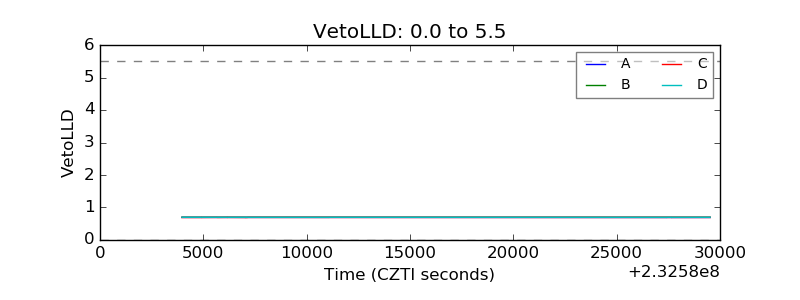 |
| Alpha Counter | 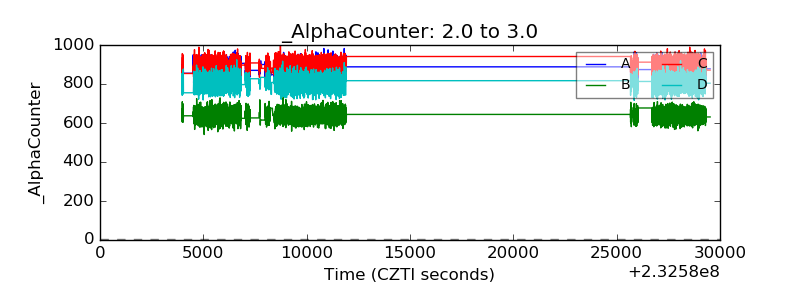 |
| _CPM_Rate | 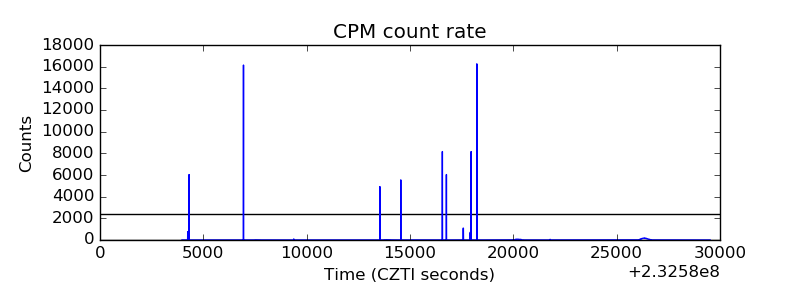 |
| CZT Counter | 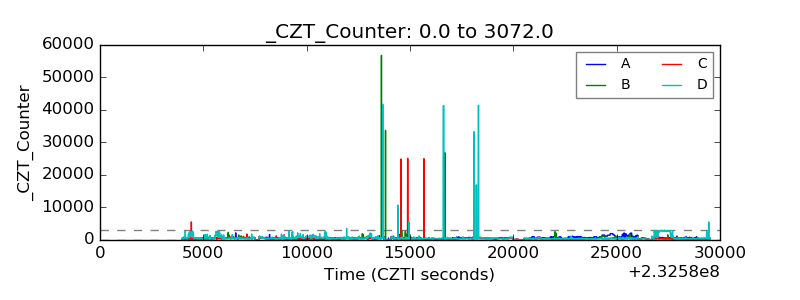 |
| +2.5 Volts monitor |  |
| +5 Volts monitor |  |
| _ROLL_ROT | 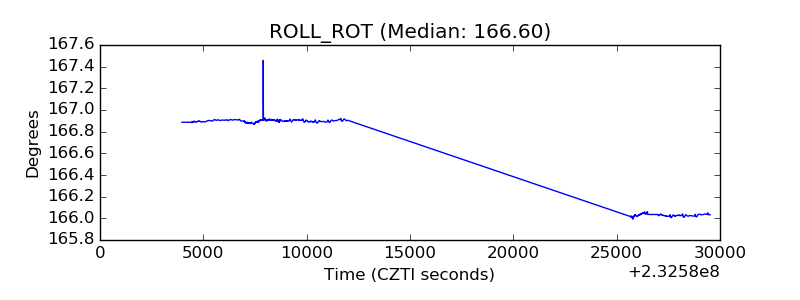 |
| _Roll_DEC | 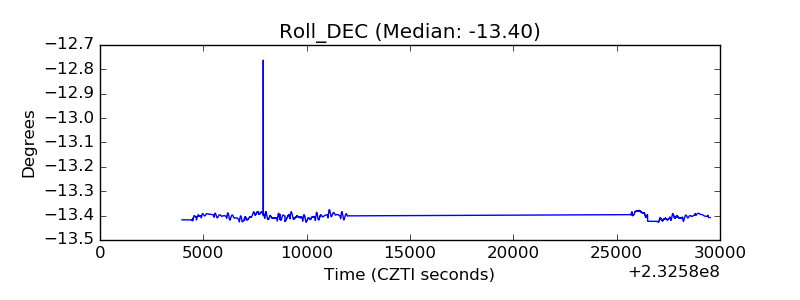 |
| _Roll_RA | 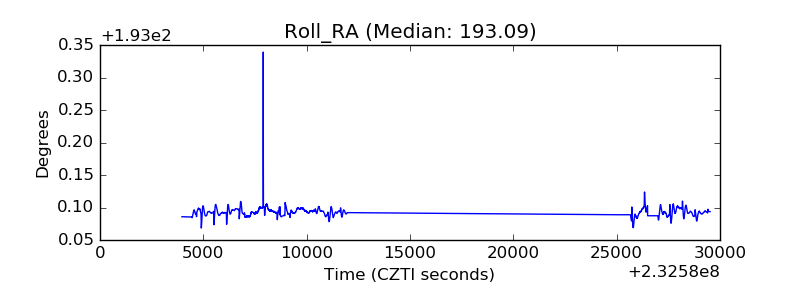 |
| Veto Counter | 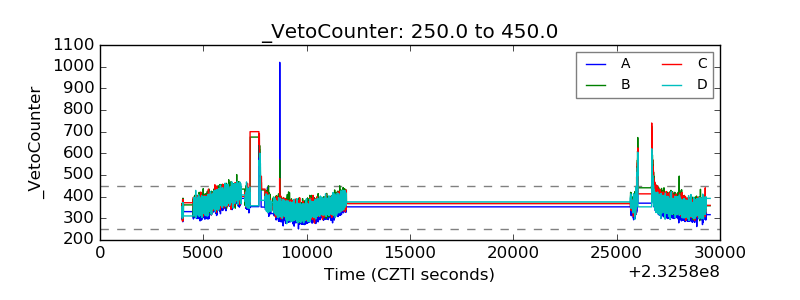 |