| Param | Original file | Final file |
|---|---|---|
| Filename | modeM0/AS1A03_135T01_9000001226_08827cztM0_level2.evt | modeM0/AS1A03_135T01_9000001226_08827cztM0_level2_quad_clean.evt |
| Size (bytes) | 543,389,760 | 88,113,600 |
| Size | 518.2 MB | 84.0 MB |
| Events in quadrant A | 4,067,379 | 564,191 |
| Events in quadrant B | 3,542,728 | 570,086 |
| Events in quadrant C | 3,141,277 | 556,403 |
| Events in quadrant D | 5,270,079 | 529,983 |
| Mode SS | |||
|---|---|---|---|
| Quadrant | BADHDUFLAG | Total packets | Discarded packets |
| A | 0 | 132 | 0 |
| B | 0 | 132 | 0 |
| C | 0 | 132 | 0 |
| D | 0 | 132 | 0 |
| Mode M0 | |||
|---|---|---|---|
| Quadrant | BADHDUFLAG | Total packets | Discarded packets |
| A | 0 | 16443 | 22 |
| B | 0 | 14476 | 12 |
| C | 0 | 13479 | 22 |
| D | 0 | 19816 | 17 |
| Mode M9 | |||
|---|---|---|---|
| Quadrant | BADHDUFLAG | Total packets | Discarded packets |
| A | 0 | 12 | 0 |
| B | 0 | 12 | 0 |
| C | 0 | 12 | 0 |
| D | 0 | 12 | 0 |
| Quadrant | Total seconds | Saturated seconds | Saturation percentage |
|---|---|---|---|
| A | 6409 | 202 | 3.151818% |
| B | 6412 | 155 | 2.417342% |
| C | 6408 | 63 | 0.983146% |
| D | 6410 | 731 | 11.404056% |
Noise dominated data is calculated using 1-second bins in cleaned event files. If a bin has >2000 counts, and if more than 50% of those come from <1% of pixels, then it is considered to be noise-dominated and hence unusable.
| Quadrant | # 1 sec bins | Bins with >0 counts | Bins with >2000 counts | High rate bins dominated by noise | Noise dominated (total time) | Noise dominated (detector-on time) | Marked lightcurve |
|---|---|---|---|---|---|---|---|
| A | 7617 | 6417 | 58 | 58 | 0.76% | 0.90% | 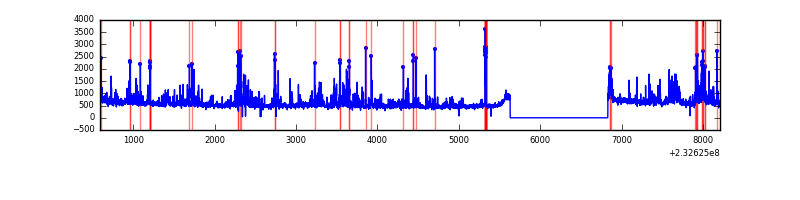 |
| B | 7617 | 6417 | 54 | 54 | 0.71% | 0.84% | 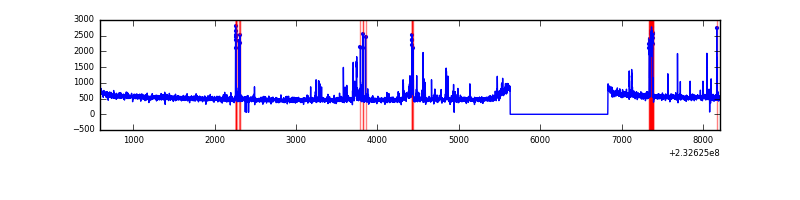 |
| C | 7617 | 6417 | 0 | 0 | 0.00% | 0.00% | 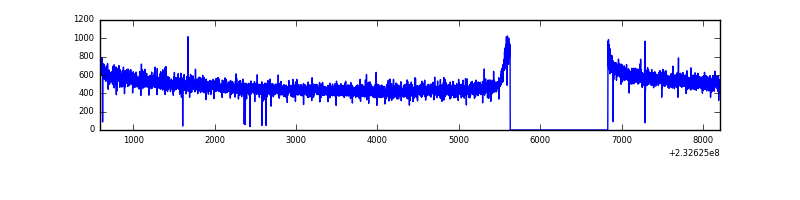 |
| D | 7617 | 6417 | 651 | 651 | 8.55% | 10.14% | 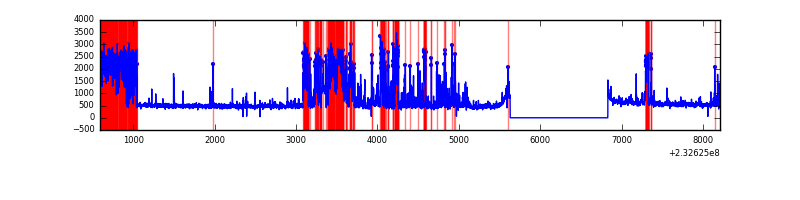 |
Top three noisy pixels from each quadrant. If the there are fewer than three noisy pixels in the level2.evt file, extra rows are filled as -1
| Pixel properties | Quadrant properties | ||||||
|---|---|---|---|---|---|---|---|
| Quadrant | DetID | PixID | Counts | Sigma | Mean | Median | Sigma |
| A | 8 | 5 | 375496 | 2234.33 | 832 | 818 | 167.7 |
| A | 15 | 223 | 244652 | 1454.06 | 832 | 818 | 167.7 |
| A | 15 | 239 | 103295 | 611.1 | 832 | 818 | 167.7 |
| B | 10 | 16 | 248657 | 1577.53 | 830 | 812 | 157.1 |
| B | 0 | 214 | 54544 | 342.0 | 830 | 812 | 157.1 |
| B | 12 | 111 | 16516 | 99.96 | 830 | 812 | 157.1 |
| C | 13 | 61 | 5973 | 28.04 | 804 | 810 | 184.1 |
| C | 5 | 32 | 3175 | 12.84 | 804 | 810 | 184.1 |
| C | 12 | 4 | 2984 | 11.81 | 804 | 810 | 184.1 |
| D | 2 | 16 | 1314678 | 7006.78 | 776 | 756 | 187.5 |
| D | 1 | 52 | 402872 | 2144.37 | 776 | 756 | 187.5 |
| D | 13 | 105 | 259647 | 1380.59 | 776 | 756 | 187.5 |
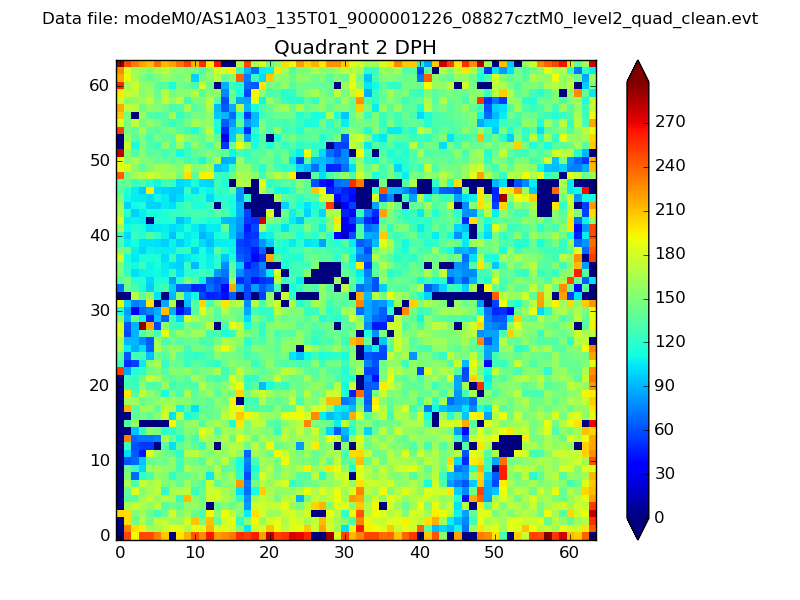
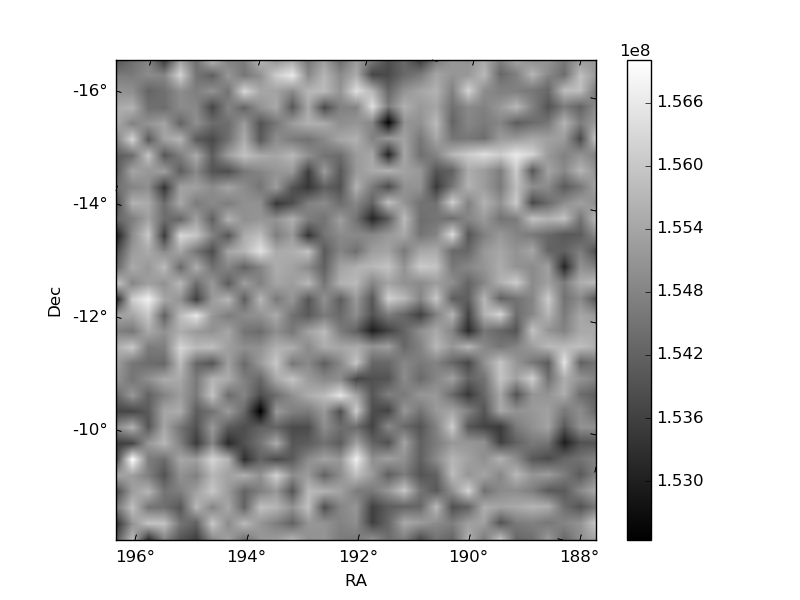
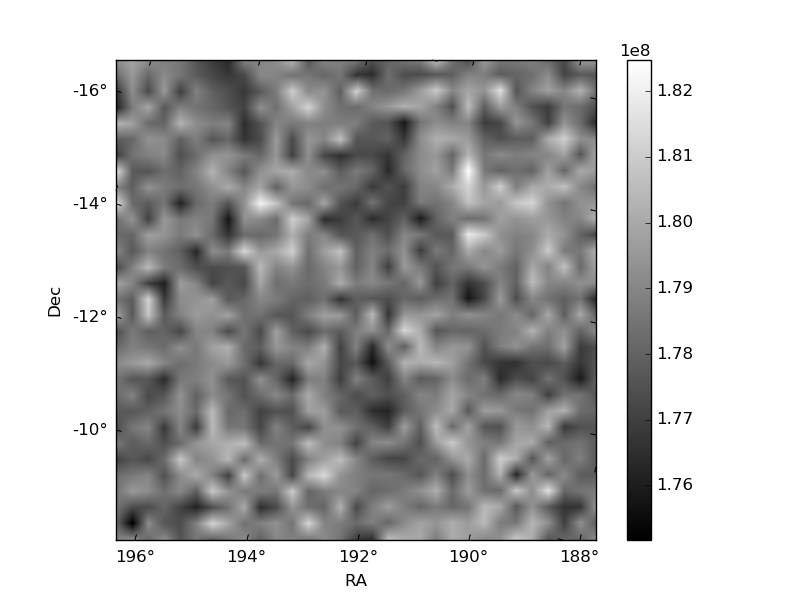
Histogram calculated using DETX and DETY for each event in the final _common_clean file
| Quadrant A | 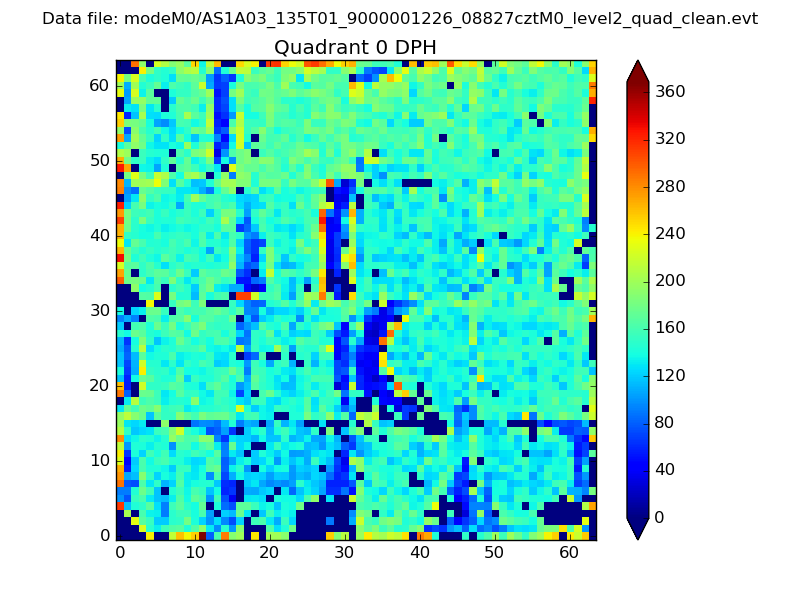 |
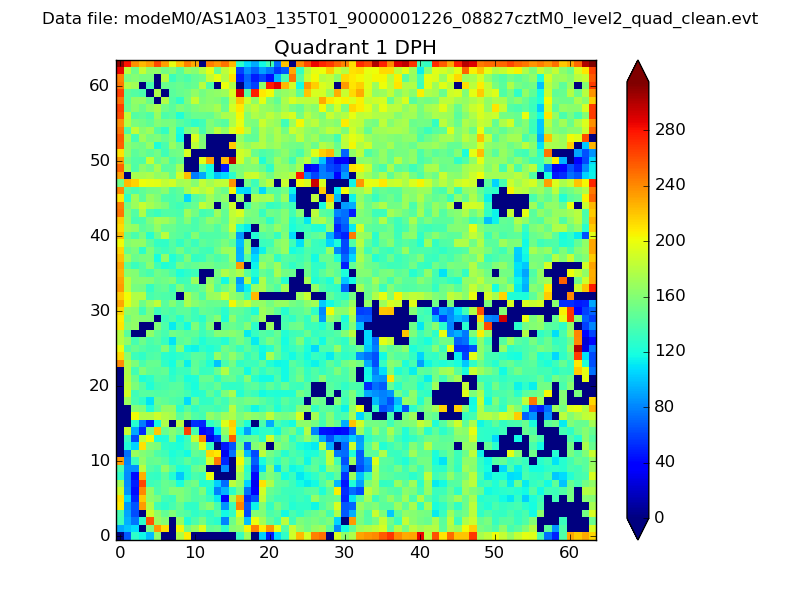 |
Quadrant B |
|---|---|---|---|
| Quadrant D | 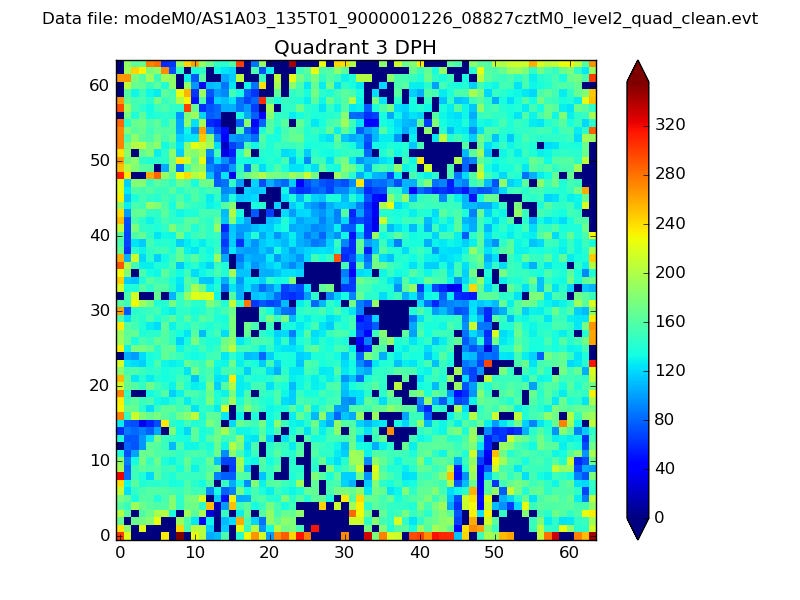 |
 |
Quadrant C |
| Plot type | Count rate plots | Images |
|---|---|---|
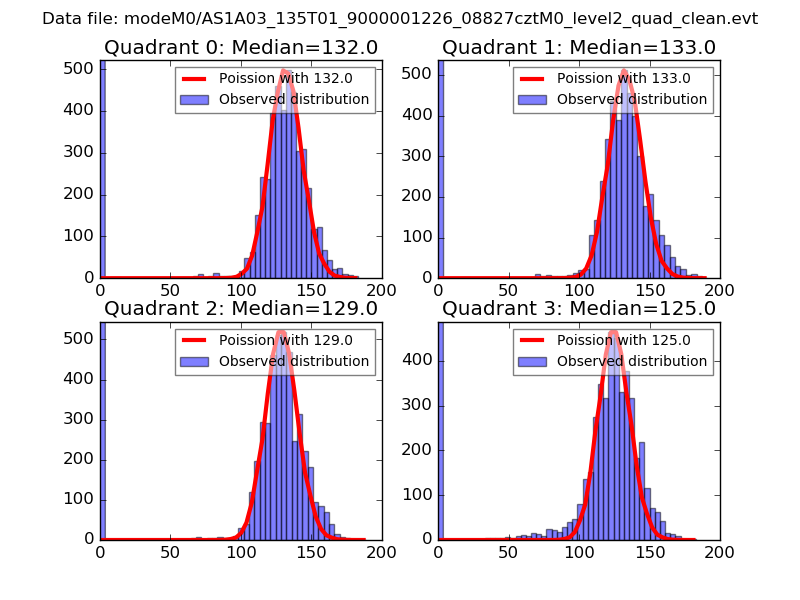
| Comparison with Poisson distribution Blue bars denote a histogram of data divided into 1 sec bins. Red curve is a Poisson curve with rate = median count rate of data. |
 |
 |
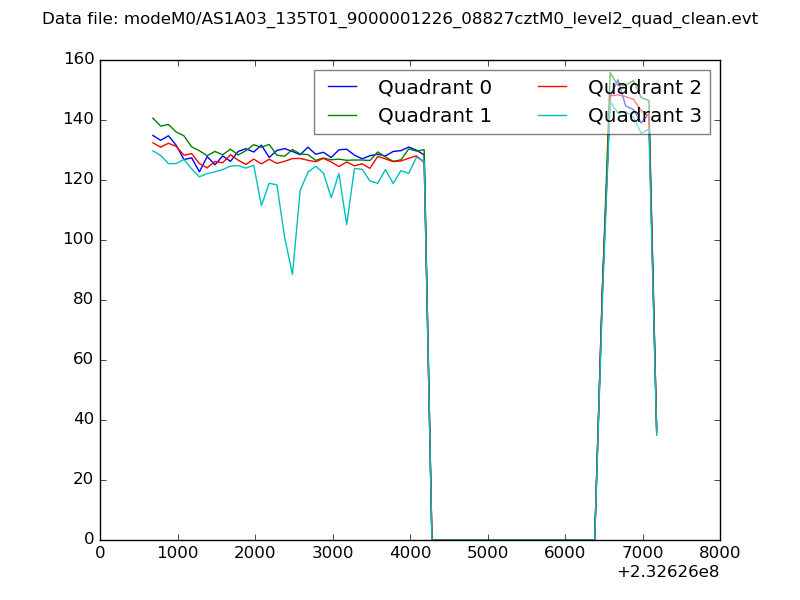
| Quadrant-wise count rates Data is divided into 100 sec bins |
 |
|
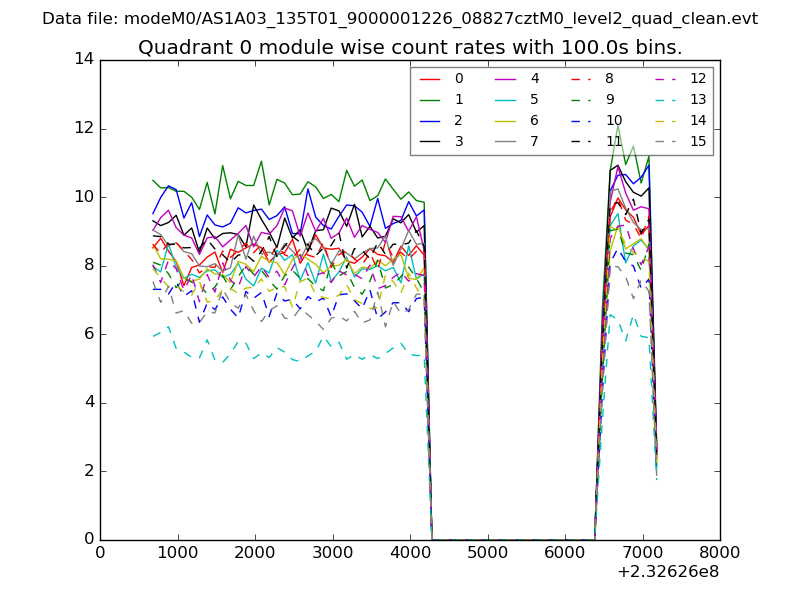
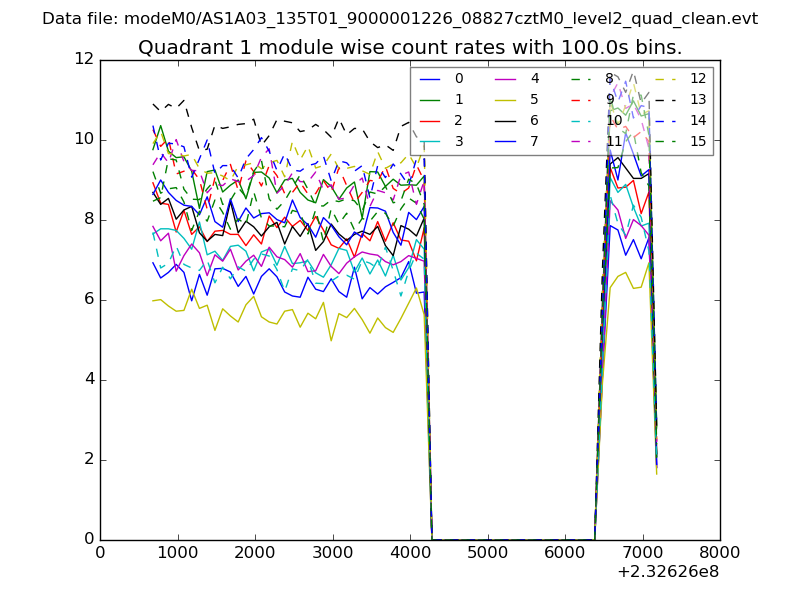
| Module-wise count rates for Quadrant A Data is divided into 100 sec bins |
 |
 |
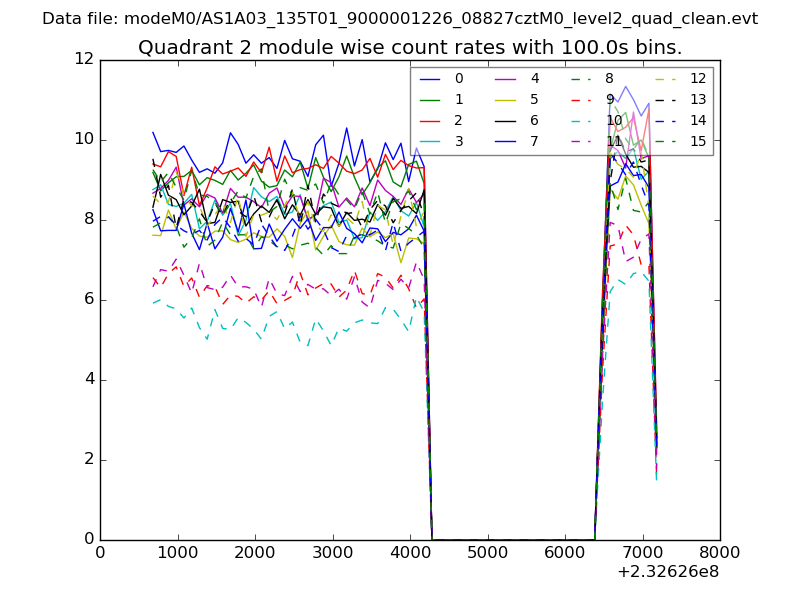
| Module-wise count rates for Quadrant B Data is divided into 100 sec bins |
 |
 |
| Module-wise count rates for Quadrant C Data is divided into 100 sec bins |
 |
 |
| Module-wise count rates for Quadrant D Data is divided into 100 sec bins |
 |
 |
| Parameter | Plot |
|---|---|
| CZT HV Monitor | 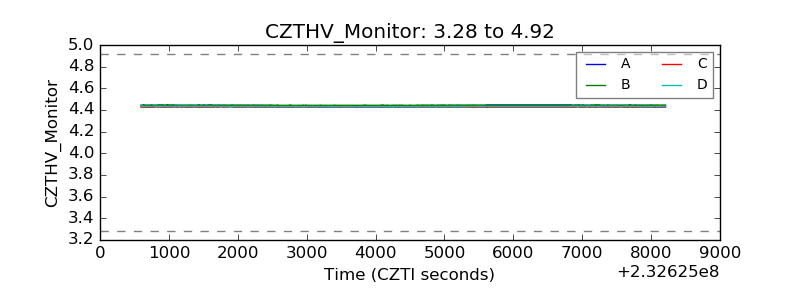 |
| D_VDD | 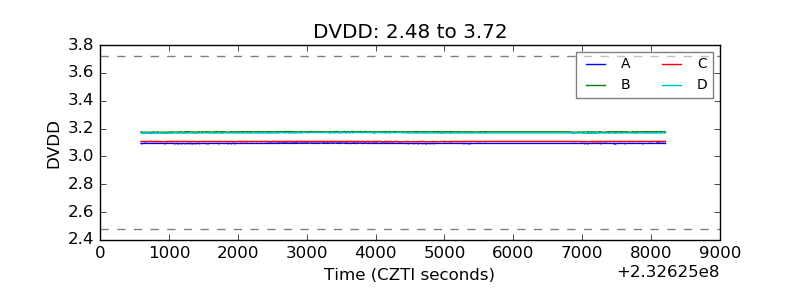 |
| Temperature 1 | 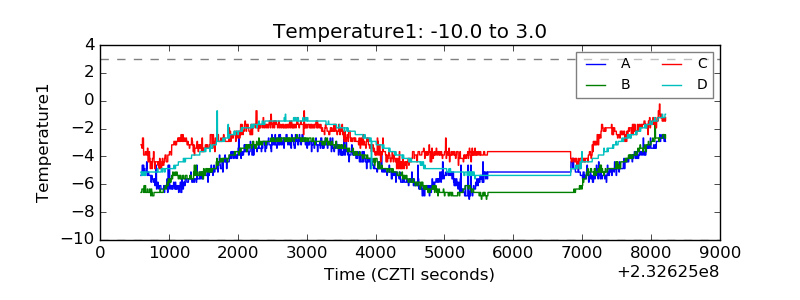 |
| Veto HV Monitor | 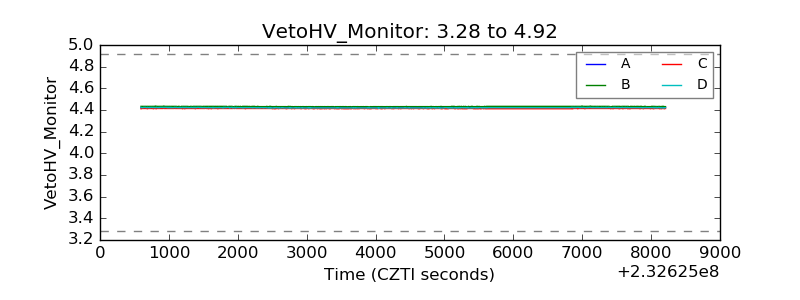 |
| Veto LLD | 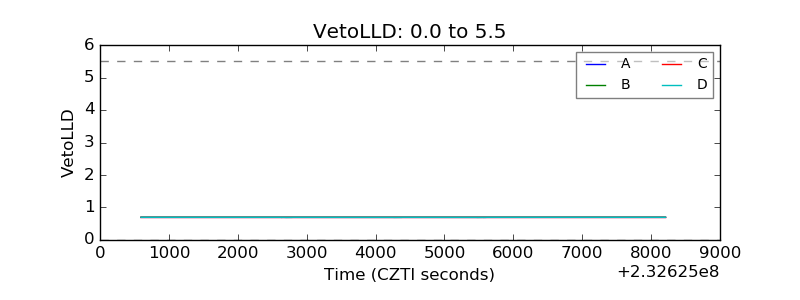 |
| Alpha Counter | 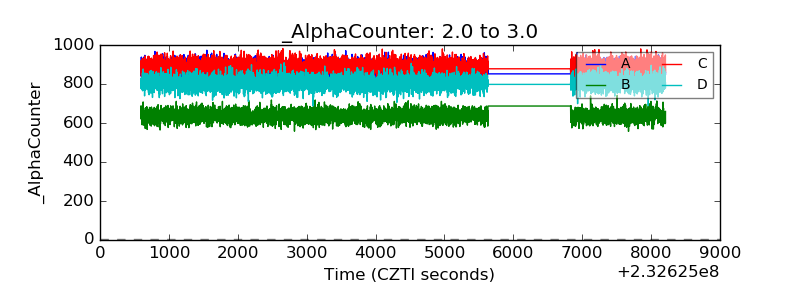 |
| _CPM_Rate | 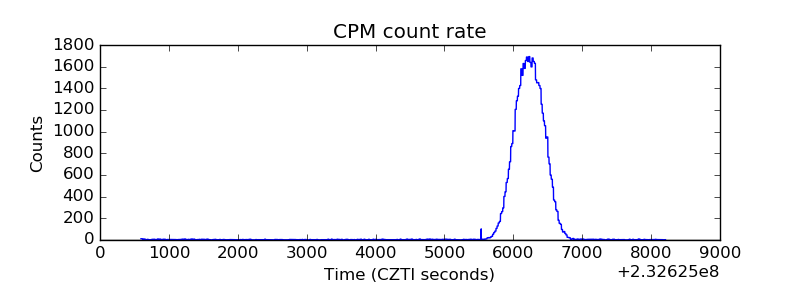 |
| CZT Counter | 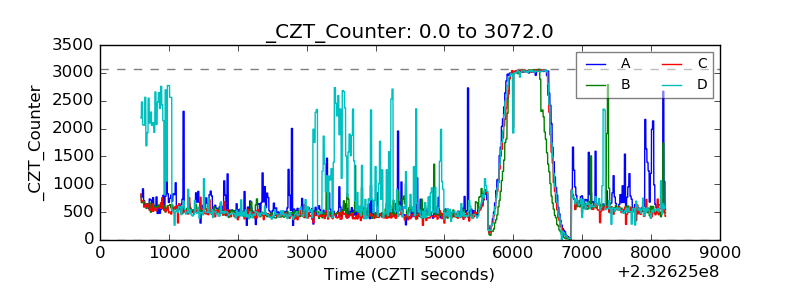 |
| +2.5 Volts monitor |  |
| +5 Volts monitor |  |
| _ROLL_ROT | 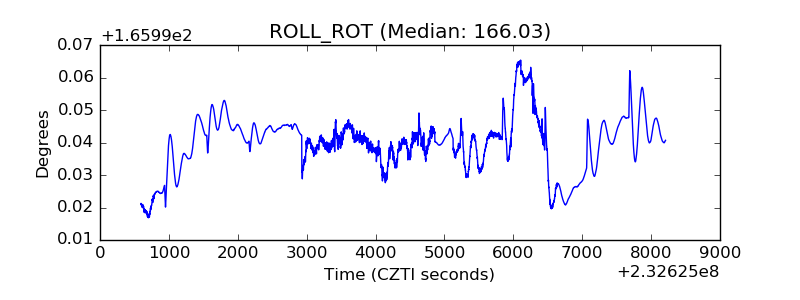 |
| _Roll_DEC | 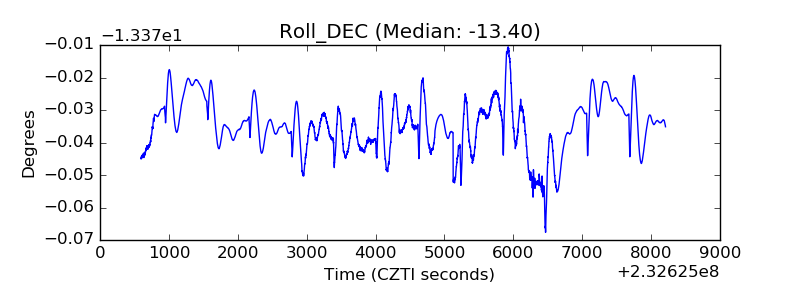 |
| _Roll_RA | 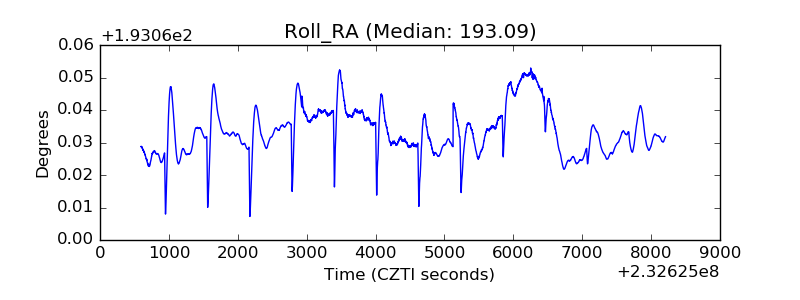 |
| Veto Counter |  |