| Param | Original file | Final file |
|---|---|---|
| Filename | modeM0/AS1A03_135T01_9000001226_08829cztM0_level2.evt | modeM0/AS1A03_135T01_9000001226_08829cztM0_level2_quad_clean.evt |
| Size (bytes) | 227,810,880 | 49,530,240 |
| Size | 217.3 MB | 47.2 MB |
| Events in quadrant A | 1,973,365 | 343,221 |
| Events in quadrant B | 1,294,266 | 349,980 |
| Events in quadrant C | 1,153,108 | 338,959 |
| Events in quadrant D | 2,313,205 | 294,224 |
| Mode SS | |||
|---|---|---|---|
| Quadrant | BADHDUFLAG | Total packets | Discarded packets |
| A | 0 | 48 | 0 |
| B | 0 | 48 | 0 |
| C | 0 | 48 | 0 |
| D | 0 | 48 | 0 |
| Mode M0 | |||
|---|---|---|---|
| Quadrant | BADHDUFLAG | Total packets | Discarded packets |
| A | 0 | 7527 | 0 |
| B | 0 | 5312 | 0 |
| C | 0 | 4907 | 0 |
| D | 0 | 8369 | 0 |
| Quadrant | Total seconds | Saturated seconds | Saturation percentage |
|---|---|---|---|
| A | 2407 | 105 | 4.362277% |
| B | 2407 | 18 | 0.747819% |
| C | 2407 | 1 | 0.041545% |
| D | 2407 | 431 | 17.906107% |
Noise dominated data is calculated using 1-second bins in cleaned event files. If a bin has >2000 counts, and if more than 50% of those come from <1% of pixels, then it is considered to be noise-dominated and hence unusable.
| Quadrant | # 1 sec bins | Bins with >0 counts | Bins with >2000 counts | High rate bins dominated by noise | Noise dominated (total time) | Noise dominated (detector-on time) | Marked lightcurve |
|---|---|---|---|---|---|---|---|
| A | 2407 | 2407 | 81 | 81 | 3.37% | 3.37% | 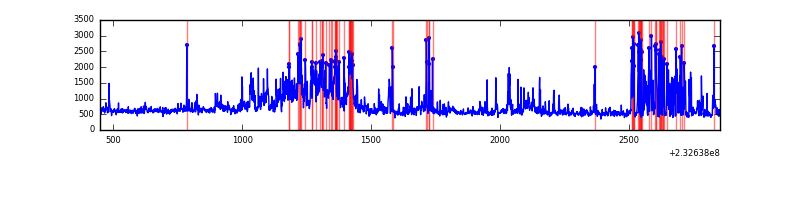 |
| B | 2407 | 2407 | 12 | 12 | 0.50% | 0.50% |  |
| C | 2407 | 2407 | 0 | 0 | 0.00% | 0.00% | 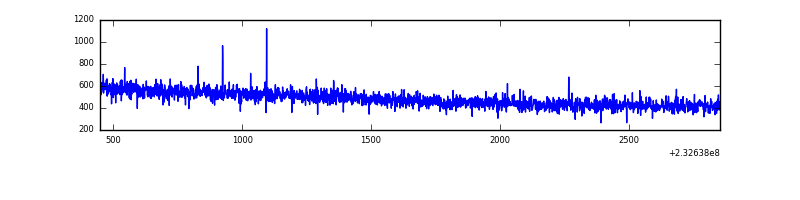 |
| D | 2407 | 2407 | 406 | 406 | 16.87% | 16.87% | 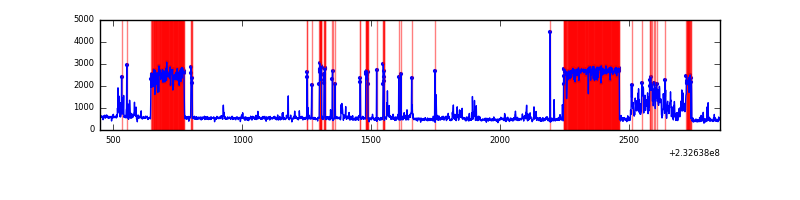 |
Top three noisy pixels from each quadrant. If the there are fewer than three noisy pixels in the level2.evt file, extra rows are filled as -1
| Pixel properties | Quadrant properties | ||||||
|---|---|---|---|---|---|---|---|
| Quadrant | DetID | PixID | Counts | Sigma | Mean | Median | Sigma |
| A | 8 | 5 | 721004 | 11238.84 | 310 | 305 | 64.1 |
| A | 15 | 223 | 41787 | 646.89 | 310 | 305 | 64.1 |
| A | 15 | 239 | 11126 | 168.75 | 310 | 305 | 64.1 |
| B | 10 | 16 | 91428 | 1536.87 | 305 | 299 | 59.3 |
| B | 0 | 214 | 11991 | 197.18 | 305 | 299 | 59.3 |
| B | 12 | 111 | 5614 | 89.64 | 305 | 299 | 59.3 |
| C | 13 | 61 | 2277 | 28.94 | 295 | 296 | 68.5 |
| C | 12 | 4 | 1349 | 15.38 | 295 | 296 | 68.5 |
| C | 3 | 202 | 821 | 7.67 | 295 | 296 | 68.5 |
| D | 2 | 16 | 949672 | 13624.61 | 272 | 265 | 69.7 |
| D | 2 | 152 | 247579 | 3549.12 | 272 | 265 | 69.7 |
| D | 1 | 52 | 30459 | 433.3 | 272 | 265 | 69.7 |
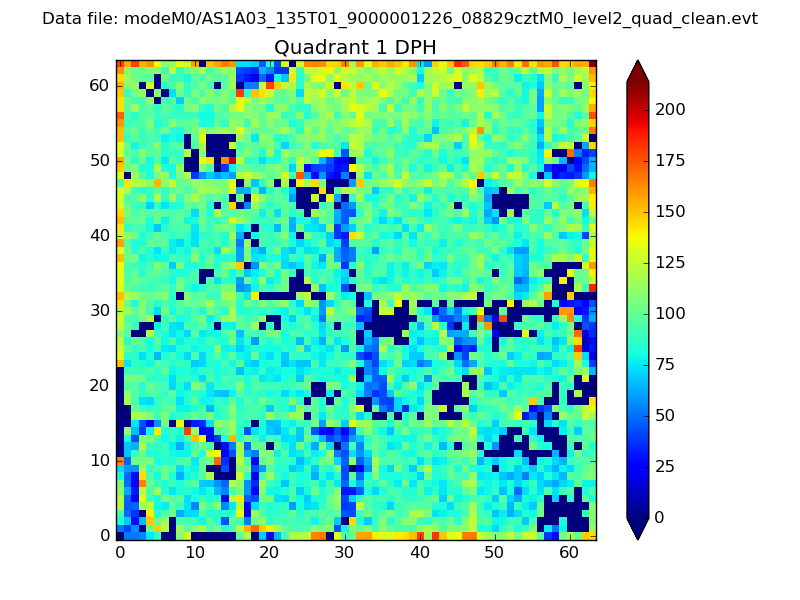
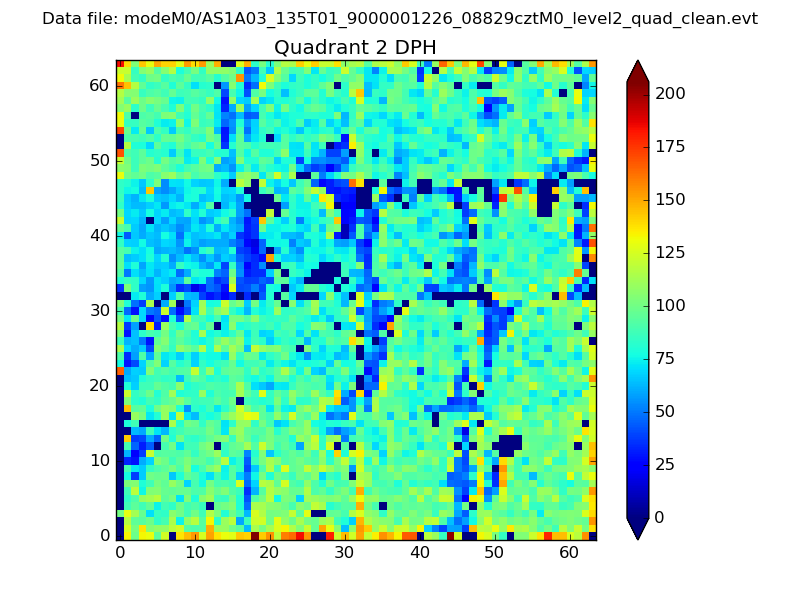
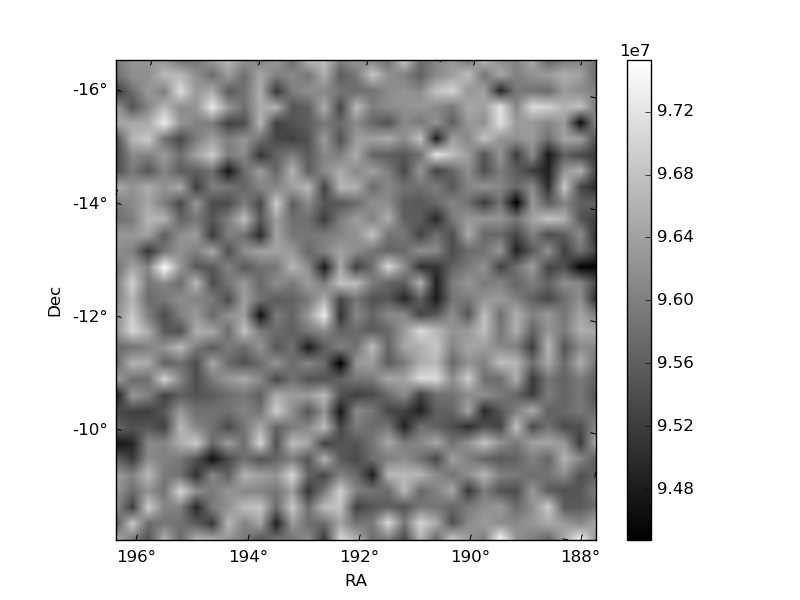
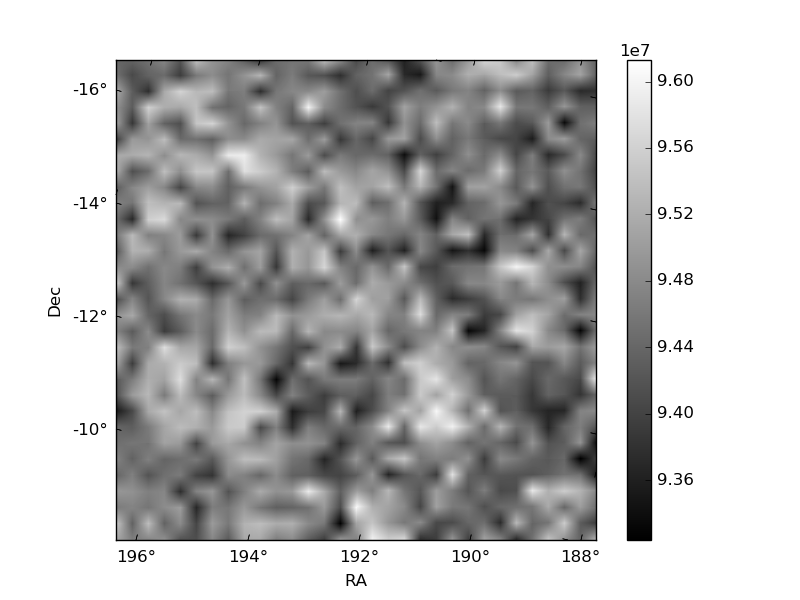
Histogram calculated using DETX and DETY for each event in the final _common_clean file
| Quadrant A |  |
 |
Quadrant B |
|---|---|---|---|
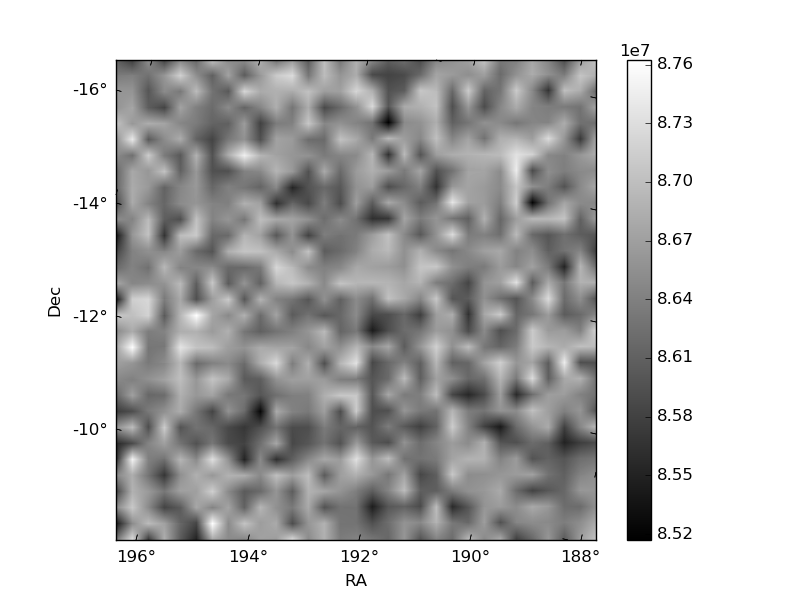
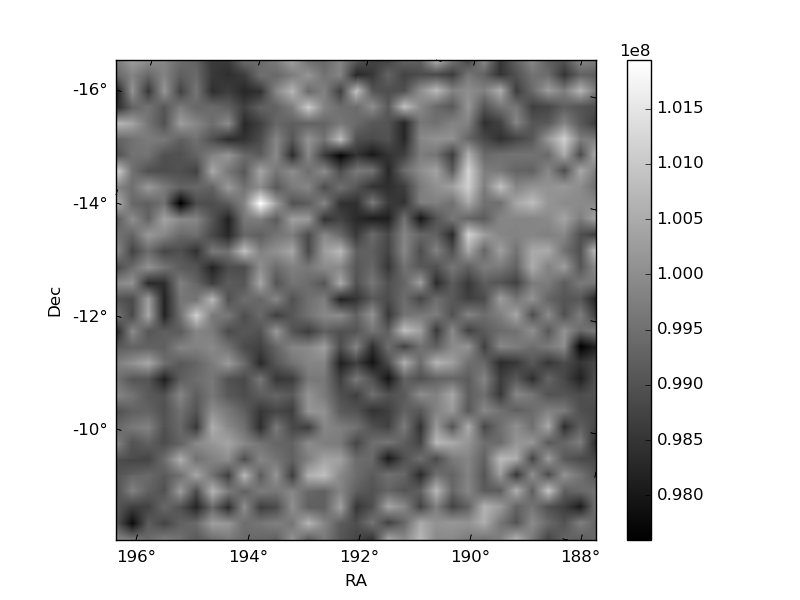
| Quadrant D | 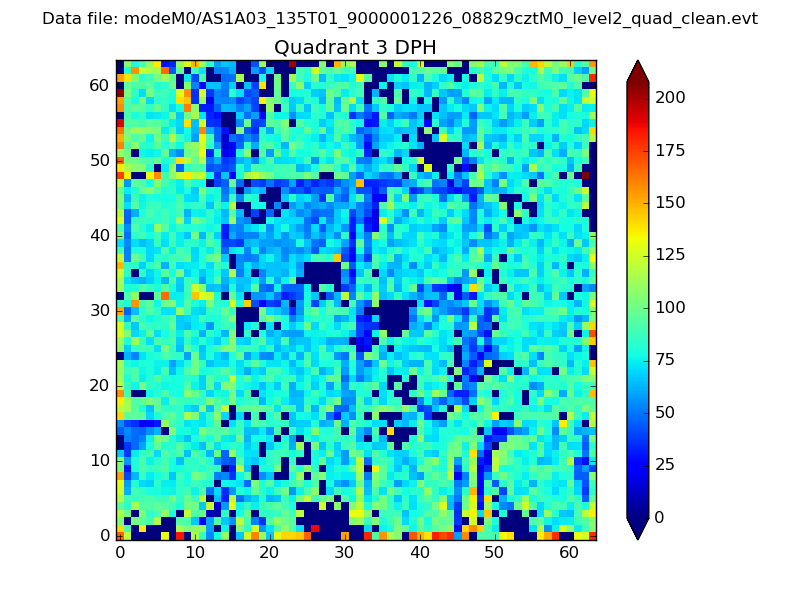 |
 |
Quadrant C |
| Plot type | Count rate plots | Images |
|---|---|---|
| Comparison with Poisson distribution Blue bars denote a histogram of data divided into 1 sec bins. Red curve is a Poisson curve with rate = median count rate of data. |
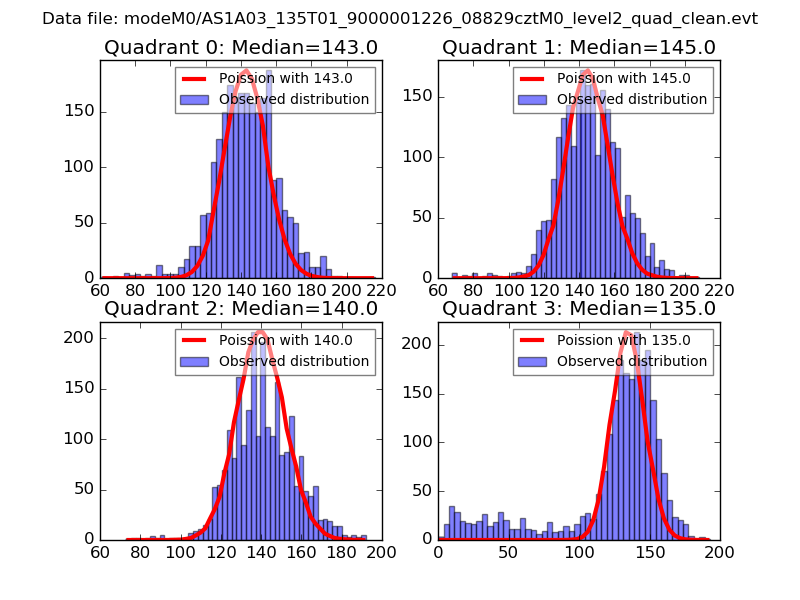 |
 |
| Quadrant-wise count rates Data is divided into 100 sec bins |
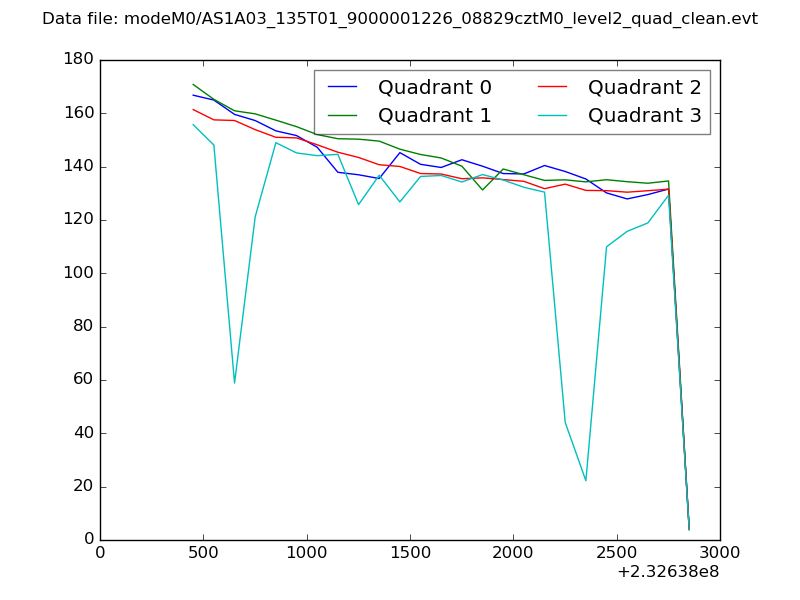 |
|
| Module-wise count rates for Quadrant A Data is divided into 100 sec bins |
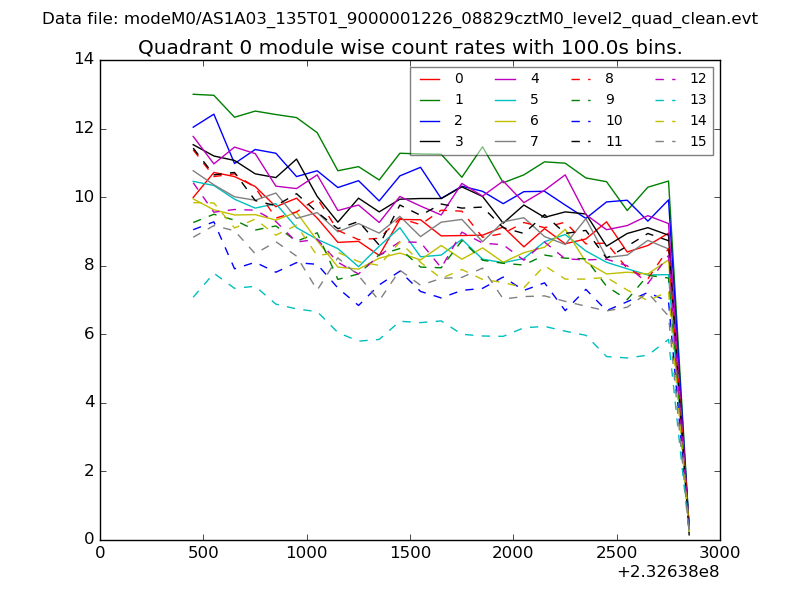 |
 |
| Module-wise count rates for Quadrant B Data is divided into 100 sec bins |
 |
 |
| Module-wise count rates for Quadrant C Data is divided into 100 sec bins |
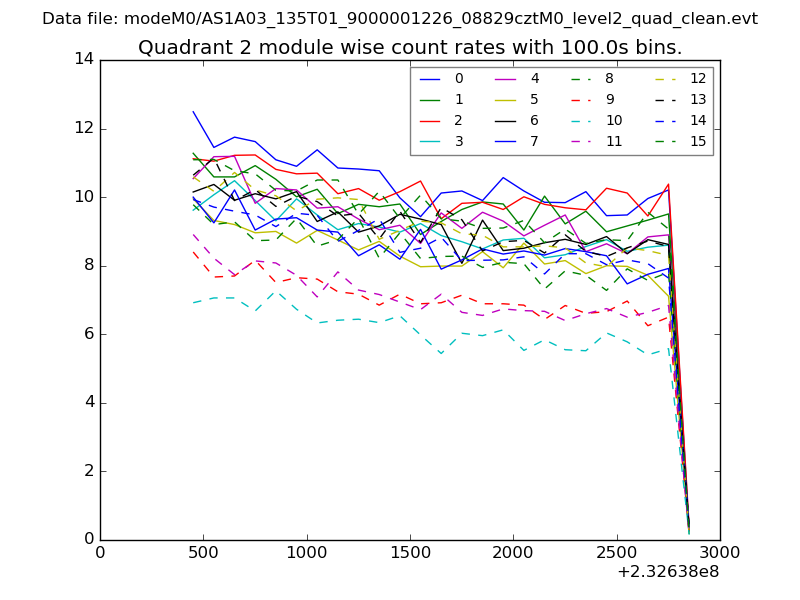 |
 |
| Module-wise count rates for Quadrant D Data is divided into 100 sec bins |
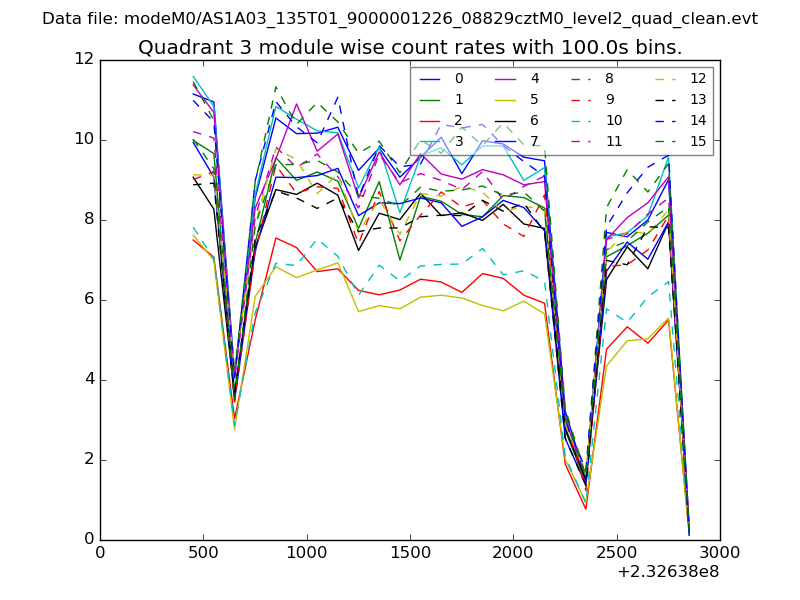 |
 |
| Parameter | Plot |
|---|---|
| CZT HV Monitor | 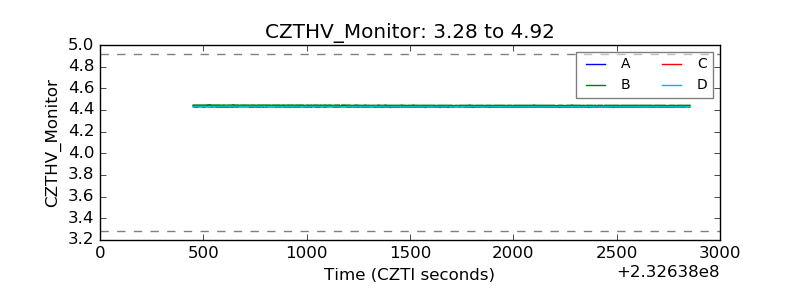 |
| D_VDD | 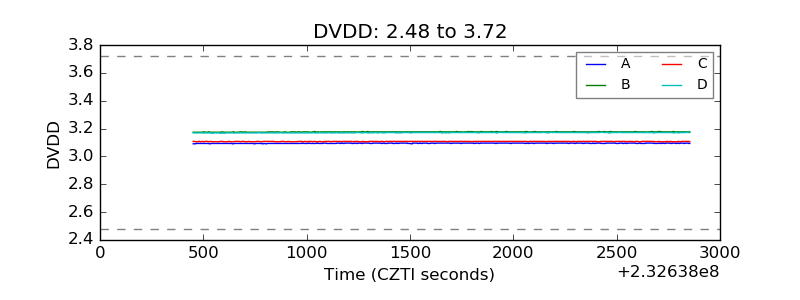 |
| Temperature 1 | 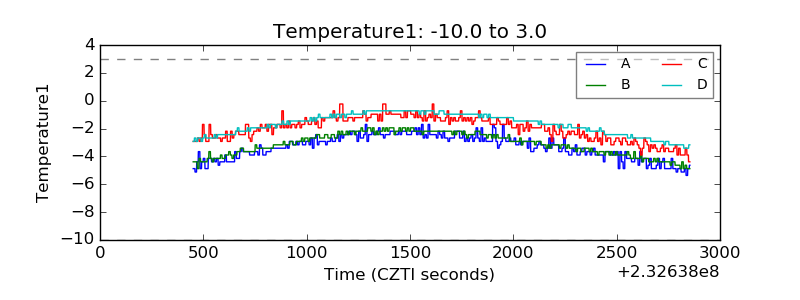 |
| Veto HV Monitor | 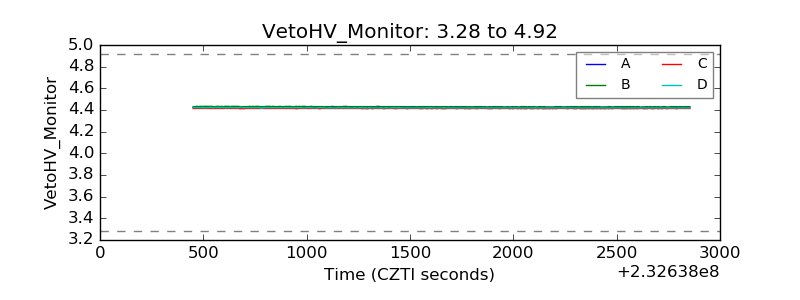 |
| Veto LLD | 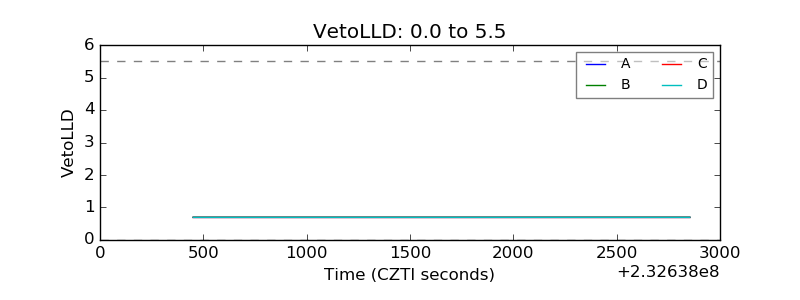 |
| Alpha Counter | 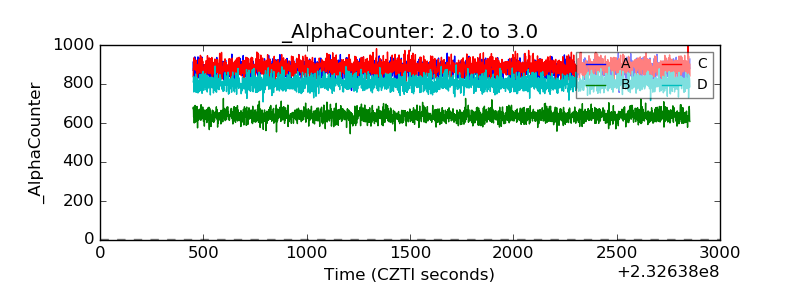 |
| _CPM_Rate | 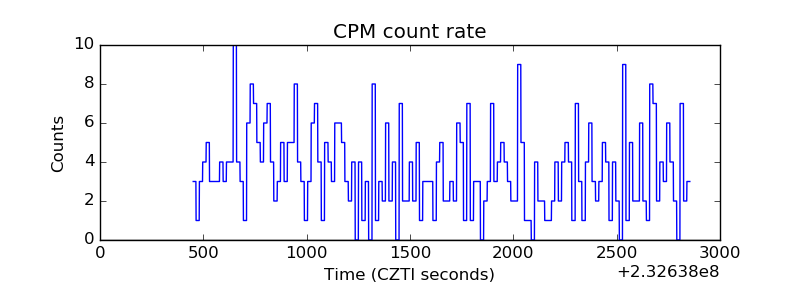 |
| CZT Counter | 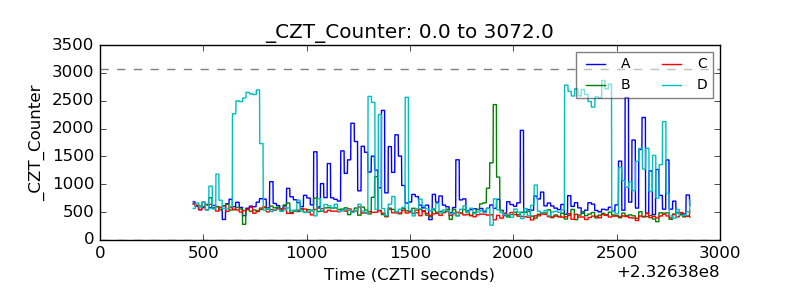 |
| +2.5 Volts monitor |  |
| +5 Volts monitor | 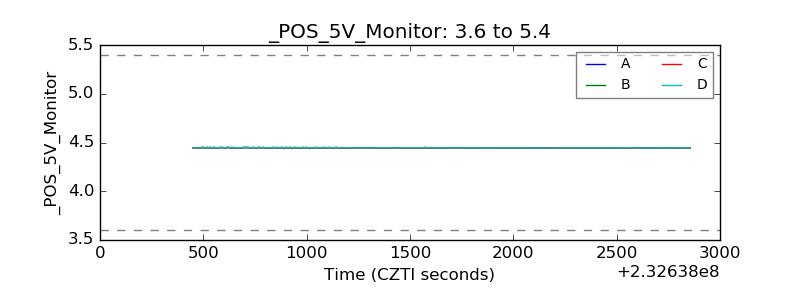 |
| _ROLL_ROT | 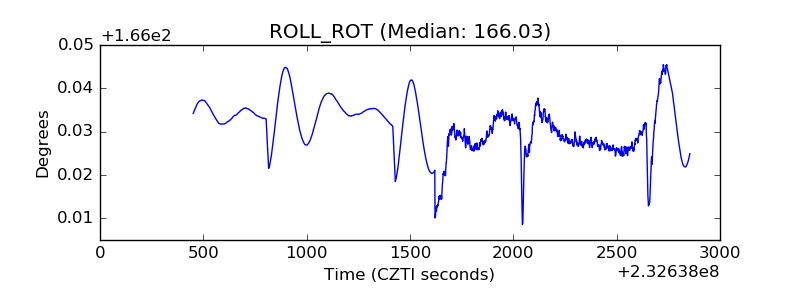 |
| _Roll_DEC | 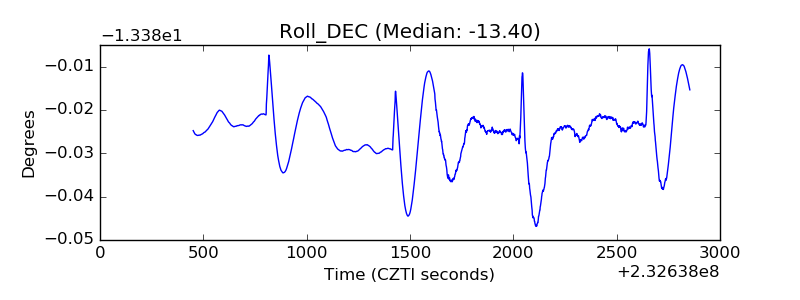 |
| _Roll_RA | 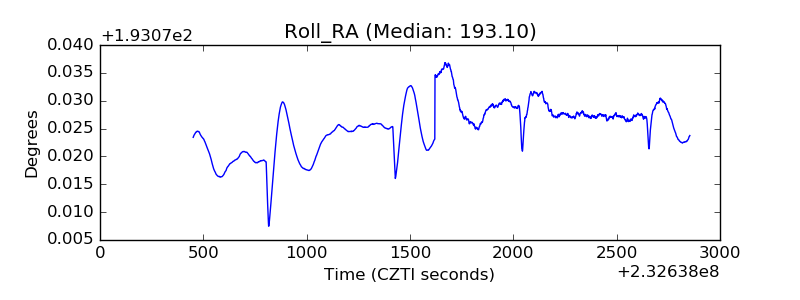 |
| Veto Counter | 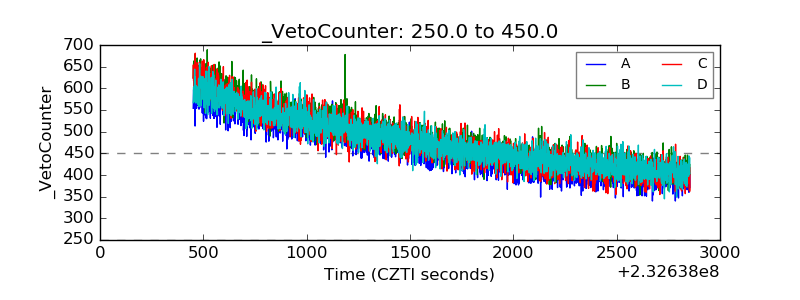 |