| Param | Original file | Final file |
|---|---|---|
| Filename | modeM0/AS1G07_087T01_9000001228cztM0_level2.fits | modeM0/AS1G07_087T01_9000001228cztM0_level2_quad_clean.evt |
| Size (bytes) | 703,992,960 | 748,428,480 |
| Size | 671.4 MB | 713.8 MB |
| Events in quadrant A | 4,291,442 | 4,640,362 |
| Events in quadrant B | 4,174,656 | 4,637,441 |
| Events in quadrant C | 4,231,156 | 4,357,133 |
| Events in quadrant D | 3,475,466 | 3,887,808 |
| Mode M0 | |||
|---|---|---|---|
| Quadrant | BADHDUFLAG | Total packets | Discarded packets |
| A | 0 | 180386 | 0 |
| B | 0 | 165019 | 0 |
| C | 0 | 154249 | 0 |
| D | 0 | 207954 | 0 |
| Mode M9 | |||
|---|---|---|---|
| Quadrant | BADHDUFLAG | Total packets | Discarded packets |
| A | 0 | 138 | 0 |
| B | 0 | 138 | 0 |
| C | 0 | 138 | 0 |
| D | 0 | 138 | 0 |
| Mode SS | |||
|---|---|---|---|
| Quadrant | BADHDUFLAG | Total packets | Discarded packets |
| A | 0 | 1538 | 0 |
| B | 0 | 1532 | 0 |
| C | 0 | 1536 | 0 |
| D | 0 | 1536 | 0 |
| Quadrant | Total seconds | Saturated seconds | Saturation percentage |
|---|---|---|---|
| A | 74992 | 1820 | 2.426926% |
| B | 75016 | 1487 | 1.982244% |
| C | 75028 | 585 | 0.779709% |
| D | 75010 | 6099 | 8.130916% |
Noise dominated data is calculated using 1-second bins in cleaned event files. If a bin has >2000 counts, and if more than 50% of those come from <1% of pixels, then it is considered to be noise-dominated and hence unusable.
| Quadrant | # 1 sec bins | Bins with >0 counts | Bins with >2000 counts | High rate bins dominated by noise | Noise dominated (total time) | Noise dominated (detector-on time) | Marked lightcurve |
|---|---|---|---|---|---|---|---|
| A | 99490 | 75107 | 0 | 0 | 0.00% | 0.00% |  |
| B | 99490 | 75141 | 0 | 0 | 0.00% | 0.00% |  |
| C | 99490 | 75142 | 0 | 0 | 0.00% | 0.00% |  |
| D | 99490 | 73012 | 0 | 0 | 0.00% | 0.00% |  |
Top three noisy pixels from each quadrant. If the there are fewer than three noisy pixels in the level2.evt file, extra rows are filled as -1
| Pixel properties | Quadrant properties | ||||||
|---|---|---|---|---|---|---|---|
| Quadrant | DetID | PixID | Counts | Sigma | Mean | Median | Sigma |
| A | 0 | 29 | 4219 | 11.45 | 1119 | 1050 | 276.7 |
| A | 7 | 110 | 3529 | 8.96 | 1119 | 1050 | 276.7 |
| A | 0 | 30 | 3239 | 7.91 | 1119 | 1050 | 276.7 |
| B | 2 | 9 | 3524 | 11.47 | 1102 | 1053 | 215.5 |
| B | 12 | 226 | 2843 | 8.31 | 1102 | 1053 | 215.5 |
| B | 14 | 254 | 2709 | 7.69 | 1102 | 1053 | 215.5 |
| C | 1 | 81 | 3134 | 7.1 | 1118 | 1039 | 295.1 |
| C | 1 | 80 | 3058 | 6.84 | 1118 | 1039 | 295.1 |
| C | 12 | 241 | 2965 | 6.53 | 1118 | 1039 | 295.1 |
| D | 3 | 14 | 2640 | 6.63 | 989 | 901 | 262.3 |
| D | 6 | 231 | 2513 | 6.15 | 989 | 901 | 262.3 |
| D | 1 | 3 | 2498 | 6.09 | 989 | 901 | 262.3 |
Histogram calculated using DETX and DETY for each event in the final _common_clean file
| Quadrant A | 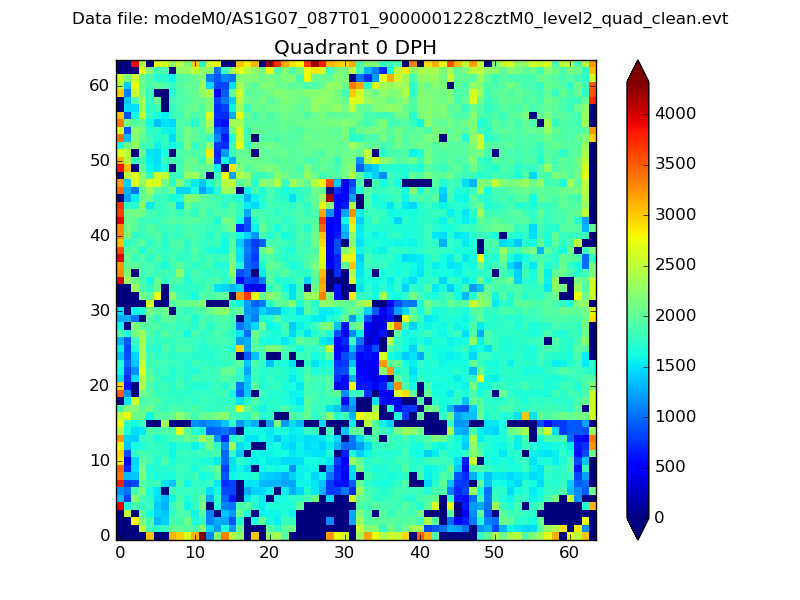 |
 |
Quadrant B |
|---|---|---|---|
| Quadrant D |  |
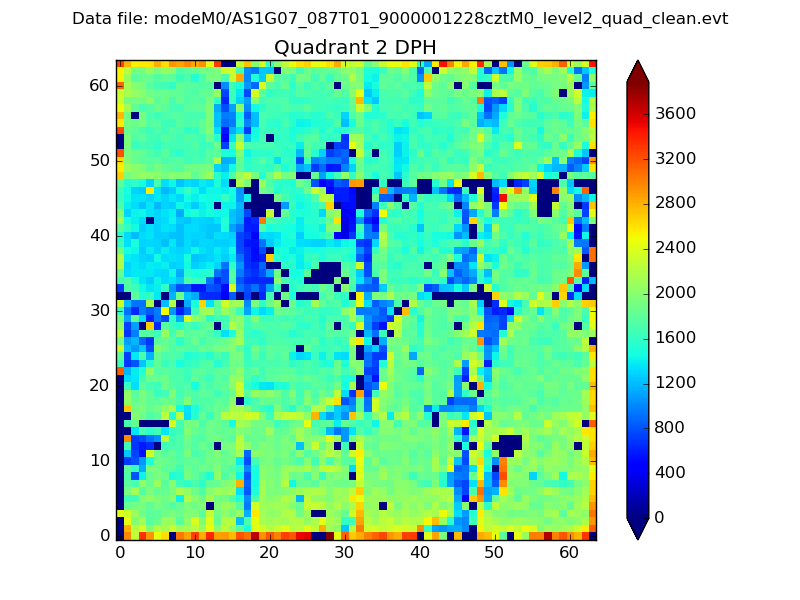 |
Quadrant C |
| Plot type | Count rate plots | Images |
|---|---|---|
| Comparison with Poisson distribution Blue bars denote a histogram of data divided into 1 sec bins. Red curve is a Poisson curve with rate = median count rate of data. |
 |
 |
| Quadrant-wise count rates Data is divided into 100 sec bins |
 |
|
| Module-wise count rates for Quadrant A Data is divided into 100 sec bins |
 |
 |
| Module-wise count rates for Quadrant B Data is divided into 100 sec bins |
 |
 |
| Module-wise count rates for Quadrant C Data is divided into 100 sec bins |
 |
 |
| Module-wise count rates for Quadrant D Data is divided into 100 sec bins |
 |
 |
| Parameter | Plot |
|---|---|
| CZT HV Monitor |  |
| D_VDD |  |
| Temperature 1 |  |
| Veto HV Monitor |  |
| Veto LLD |  |
| Alpha Counter |  |
| _CPM_Rate |  |
| CZT Counter |  |
| +2.5 Volts monitor |  |
| +5 Volts monitor |  |
| _ROLL_ROT |  |
| _Roll_DEC |  |
| _Roll_RA |  |
| Veto Counter |  |