| Param | Original file | Final file |
|---|---|---|
| Filename | modeM0/AS1G07_087T01_9000001228_08829cztM0_level2.evt | modeM0/AS1G07_087T01_9000001228_08829cztM0_level2_quad_clean.evt |
| Size (bytes) | 252,846,720 | 52,165,440 |
| Size | 241.1 MB | 49.7 MB |
| Events in quadrant A | 2,067,355 | 343,412 |
| Events in quadrant B | 1,777,809 | 352,208 |
| Events in quadrant C | 1,536,179 | 336,333 |
| Events in quadrant D | 2,062,806 | 325,837 |
| Mode M0 | |||
|---|---|---|---|
| Quadrant | BADHDUFLAG | Total packets | Discarded packets |
| A | 0 | 8240 | 2 |
| B | 0 | 7279 | 1 |
| C | 0 | 6589 | 1 |
| D | 0 | 8166 | 1 |
| Mode M9 | |||
|---|---|---|---|
| Quadrant | BADHDUFLAG | Total packets | Discarded packets |
| A | 0 | 13 | 0 |
| B | 0 | 13 | 0 |
| C | 0 | 13 | 0 |
| D | 0 | 13 | 0 |
| Mode SS | |||
|---|---|---|---|
| Quadrant | BADHDUFLAG | Total packets | Discarded packets |
| A | 0 | 64 | 0 |
| B | 0 | 64 | 0 |
| C | 0 | 64 | 0 |
| D | 0 | 64 | 0 |
| Quadrant | Total seconds | Saturated seconds | Saturation percentage |
|---|---|---|---|
| A | 3117 | 122 | 3.914020% |
| B | 3117 | 85 | 2.726981% |
| C | 3117 | 37 | 1.187039% |
| D | 3117 | 186 | 5.967276% |
Noise dominated data is calculated using 1-second bins in cleaned event files. If a bin has >2000 counts, and if more than 50% of those come from <1% of pixels, then it is considered to be noise-dominated and hence unusable.
| Quadrant | # 1 sec bins | Bins with >0 counts | Bins with >2000 counts | High rate bins dominated by noise | Noise dominated (total time) | Noise dominated (detector-on time) | Marked lightcurve |
|---|---|---|---|---|---|---|---|
| A | 4442 | 3117 | 24 | 24 | 0.54% | 0.77% | 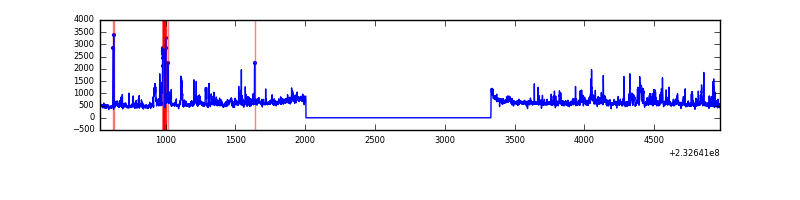 |
| B | 4442 | 3117 | 20 | 20 | 0.45% | 0.64% | 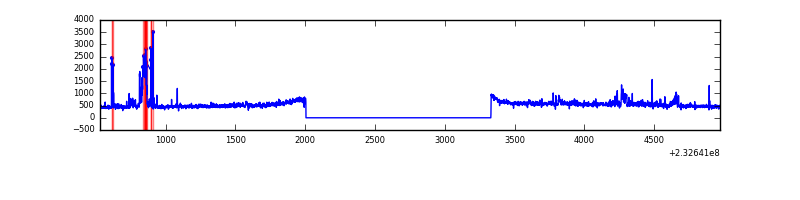 |
| C | 4442 | 3117 | 0 | 0 | 0.00% | 0.00% | 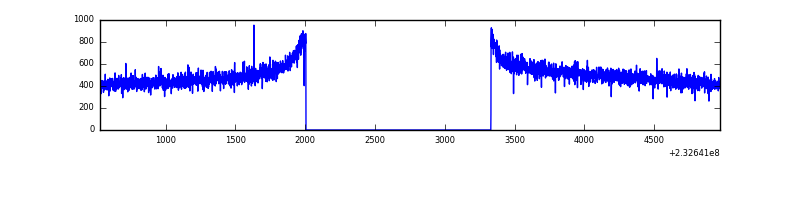 |
| D | 4442 | 3117 | 117 | 117 | 2.63% | 3.75% | 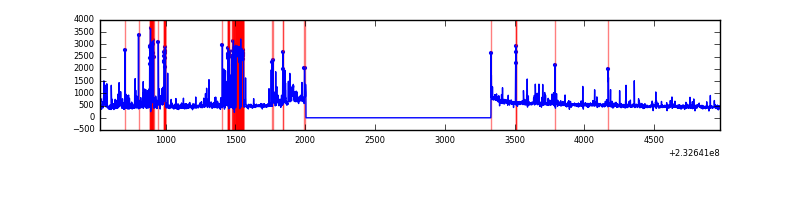 |
Top three noisy pixels from each quadrant. If the there are fewer than three noisy pixels in the level2.evt file, extra rows are filled as -1
| Pixel properties | Quadrant properties | ||||||
|---|---|---|---|---|---|---|---|
| Quadrant | DetID | PixID | Counts | Sigma | Mean | Median | Sigma |
| A | 8 | 5 | 248534 | 2939.42 | 411 | 403 | 84.4 |
| A | 15 | 223 | 106370 | 1255.31 | 411 | 403 | 84.4 |
| A | 15 | 239 | 38080 | 446.33 | 411 | 403 | 84.4 |
| B | 10 | 16 | 142132 | 1784.93 | 413 | 403 | 79.4 |
| B | 0 | 214 | 24006 | 297.26 | 413 | 403 | 79.4 |
| B | 5 | 255 | 8385 | 100.52 | 413 | 403 | 79.4 |
| C | 13 | 61 | 2990 | 28.3 | 393 | 395 | 91.7 |
| C | 12 | 4 | 1887 | 16.27 | 393 | 395 | 91.7 |
| C | 3 | 202 | 1001 | 6.61 | 393 | 395 | 91.7 |
| D | 2 | 16 | 392952 | 3918.23 | 386 | 376 | 100.2 |
| D | 2 | 152 | 75528 | 750.08 | 386 | 376 | 100.2 |
| D | 1 | 31 | 44670 | 442.09 | 386 | 376 | 100.2 |
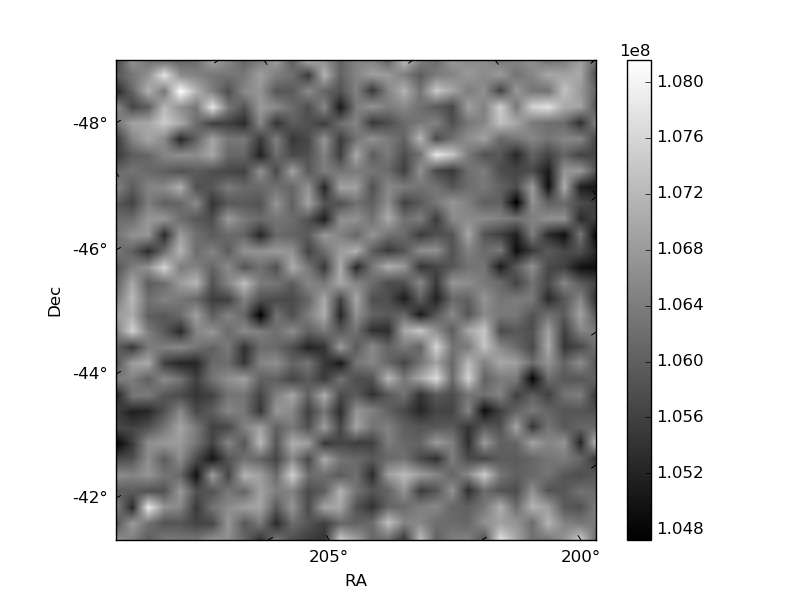
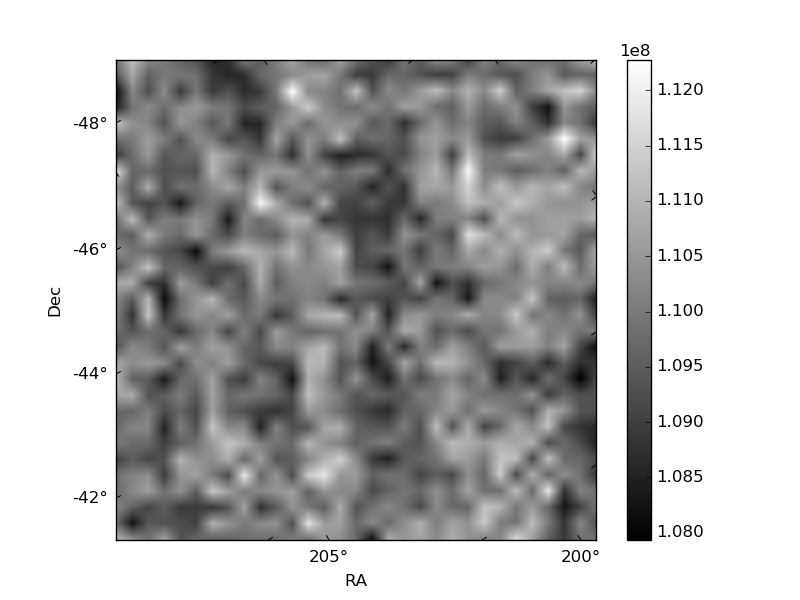
Histogram calculated using DETX and DETY for each event in the final _common_clean file
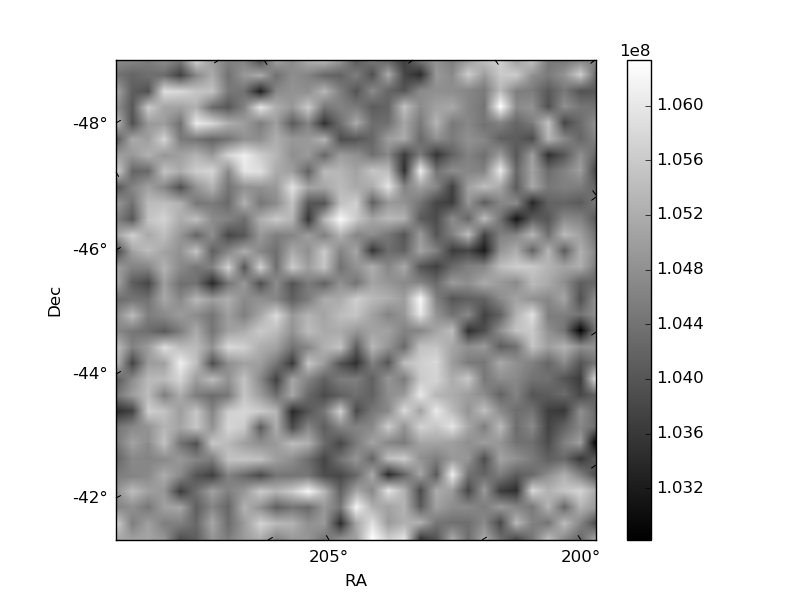
| Quadrant A | 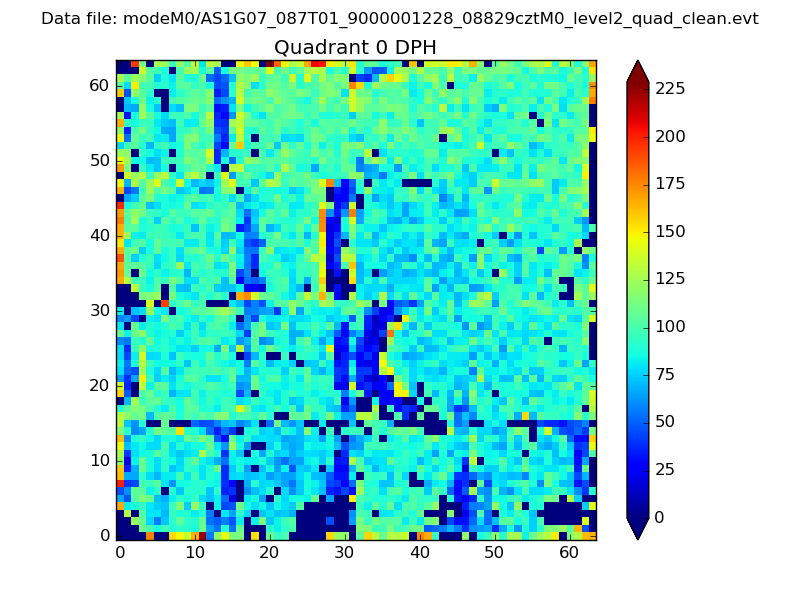 |
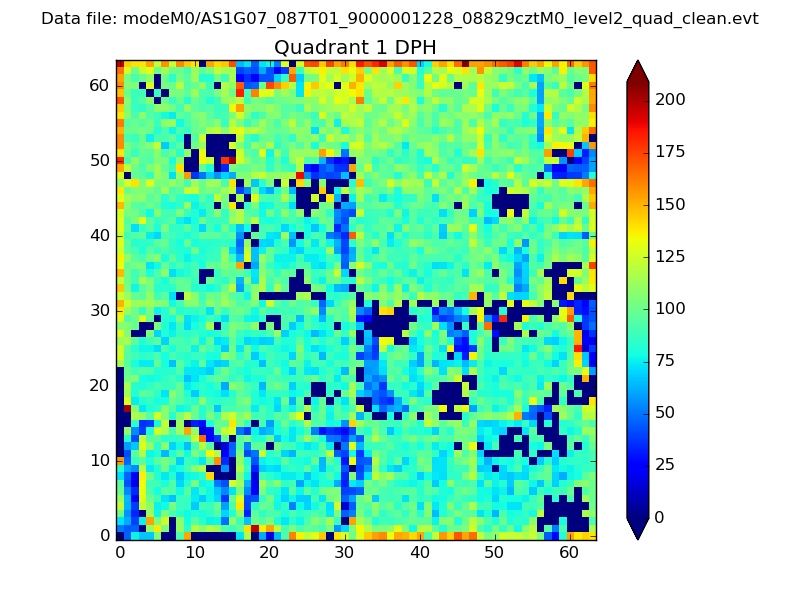 |
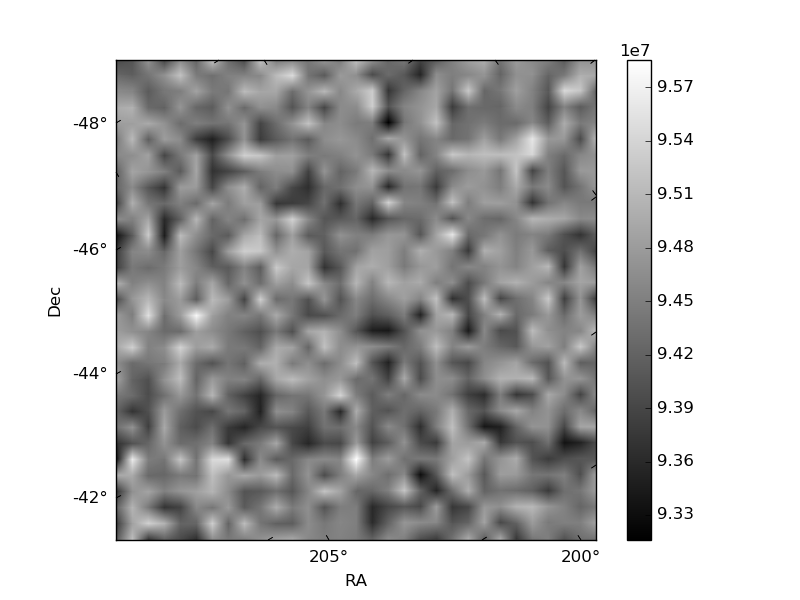
Quadrant B |
|---|---|---|---|
| Quadrant D | 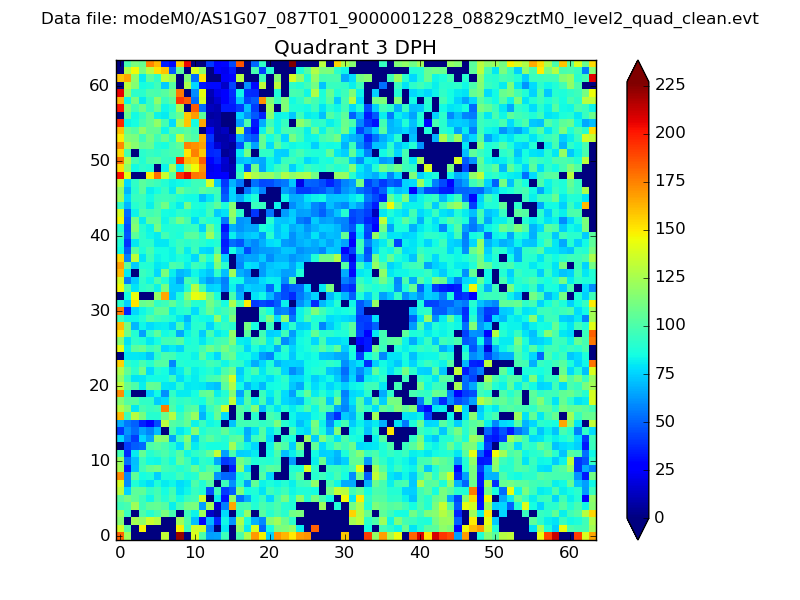 |
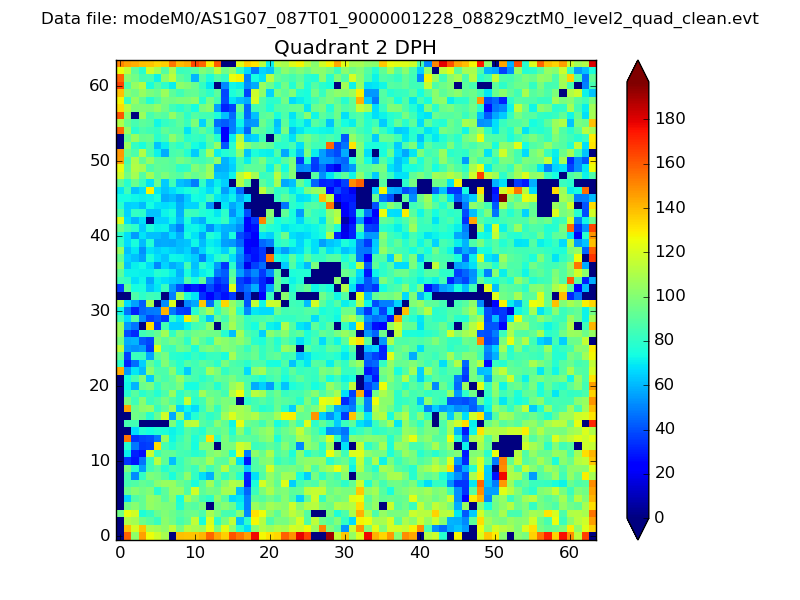 |
Quadrant C |
| Plot type | Count rate plots | Images |
|---|---|---|
| Comparison with Poisson distribution Blue bars denote a histogram of data divided into 1 sec bins. Red curve is a Poisson curve with rate = median count rate of data. |
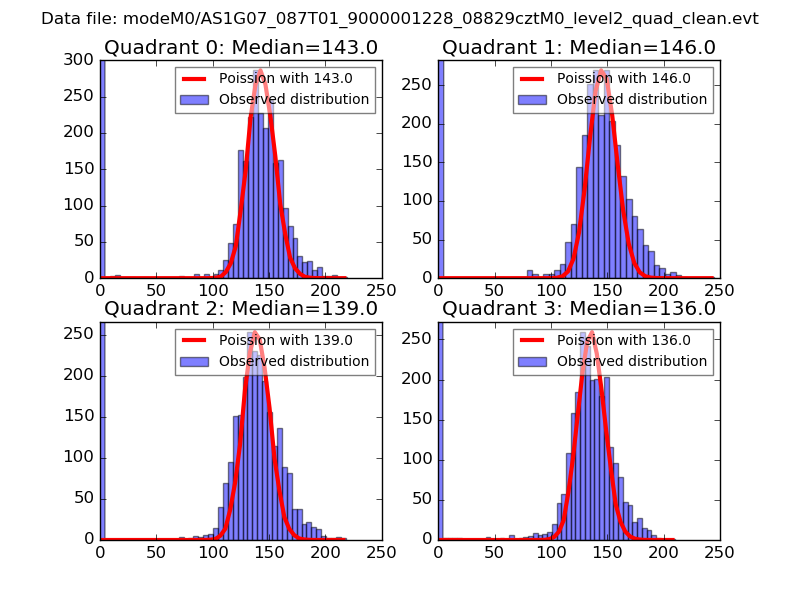 |
 |
| Quadrant-wise count rates Data is divided into 100 sec bins |
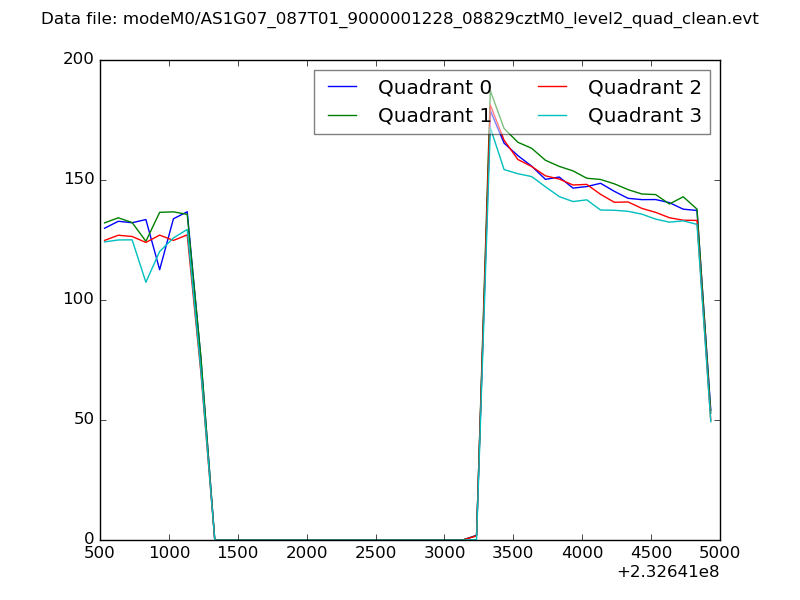 |
|
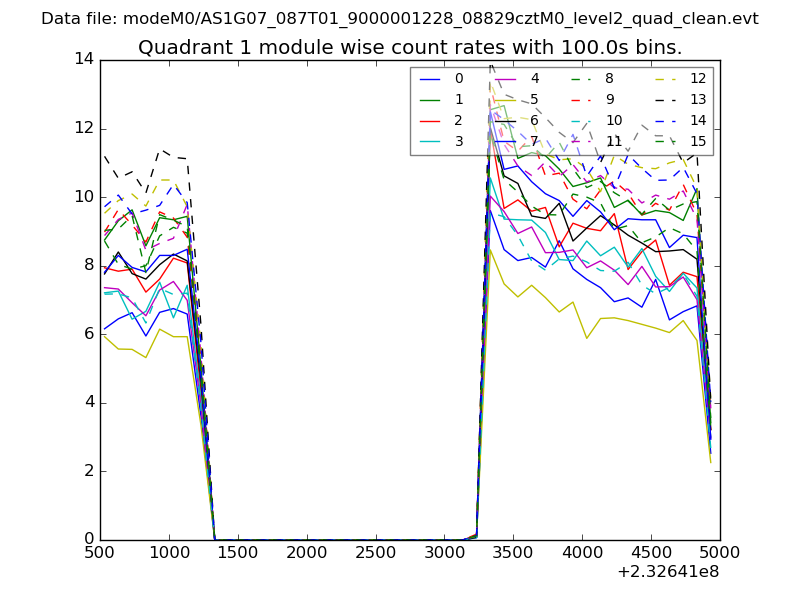
| Module-wise count rates for Quadrant A Data is divided into 100 sec bins |
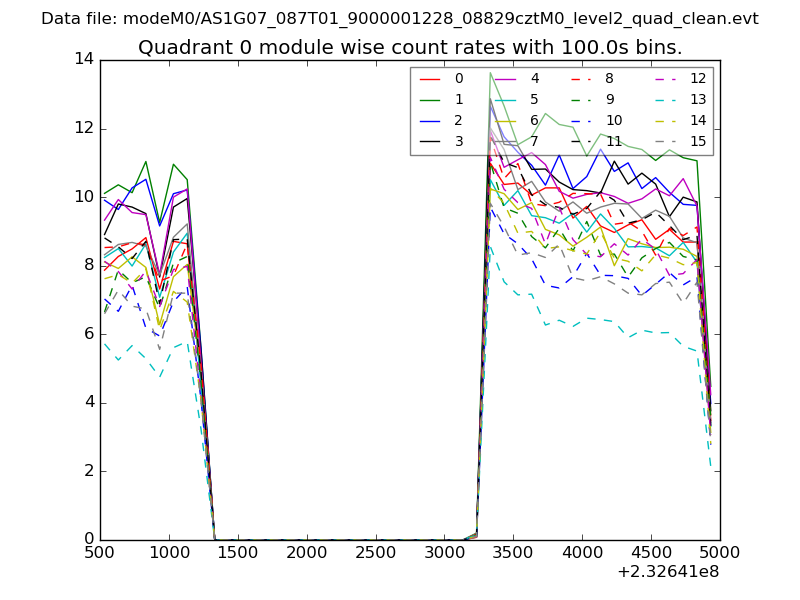 |
 |
| Module-wise count rates for Quadrant B Data is divided into 100 sec bins |
 |
 |
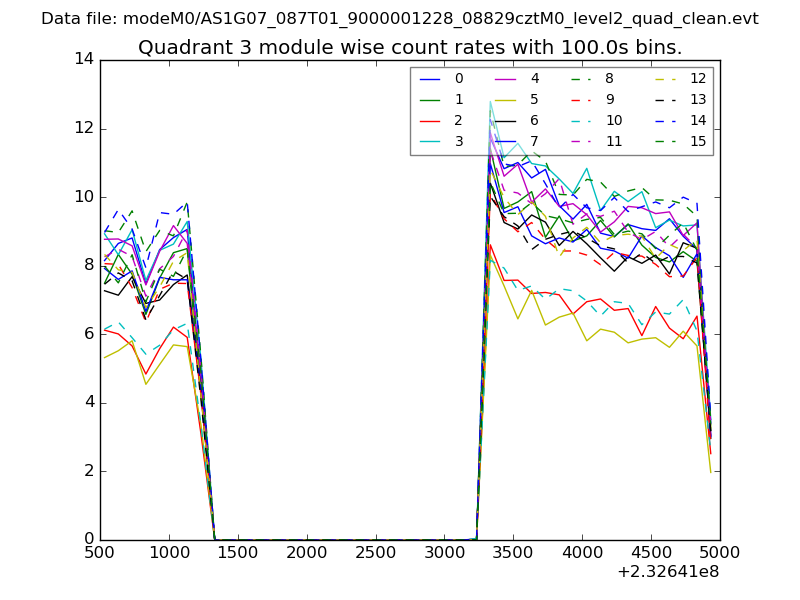
| Module-wise count rates for Quadrant C Data is divided into 100 sec bins |
 |
 |
| Module-wise count rates for Quadrant D Data is divided into 100 sec bins |
 |
 |
| Parameter | Plot |
|---|---|
| CZT HV Monitor | 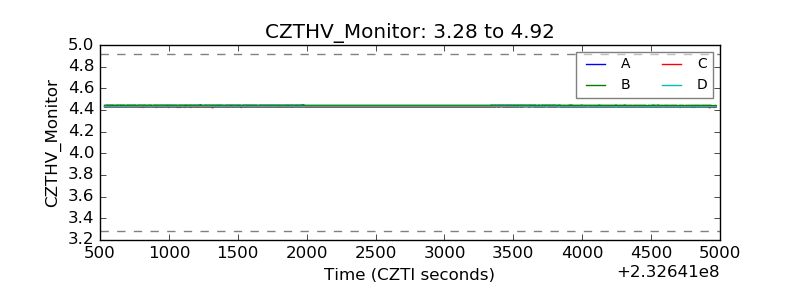 |
| D_VDD |  |
| Temperature 1 | 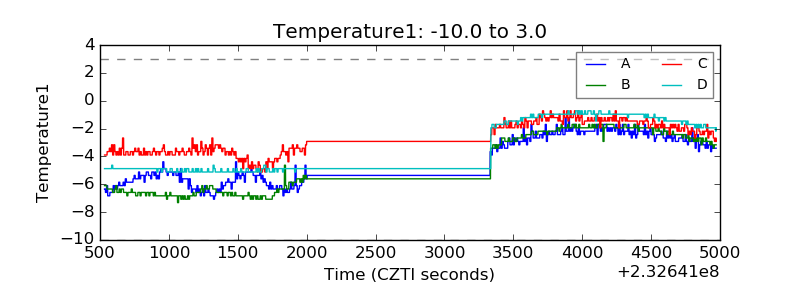 |
| Veto HV Monitor | 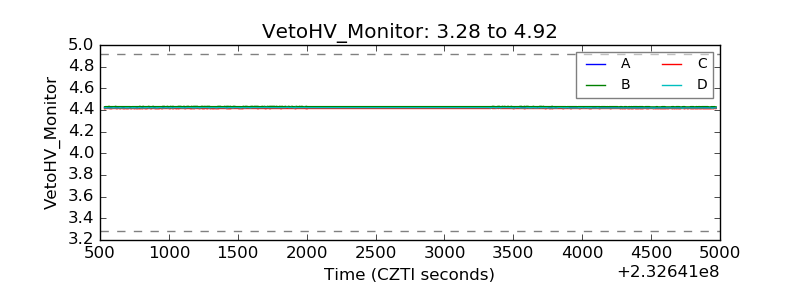 |
| Veto LLD | 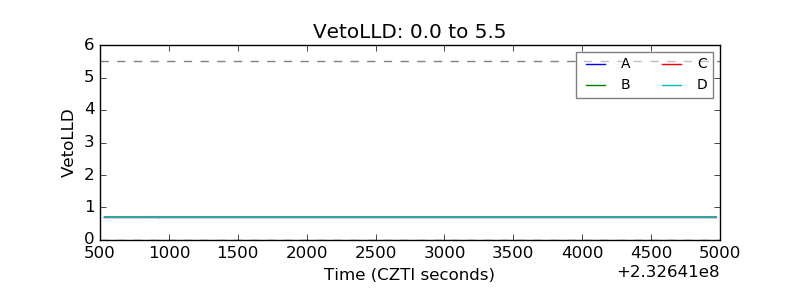 |
| Alpha Counter | 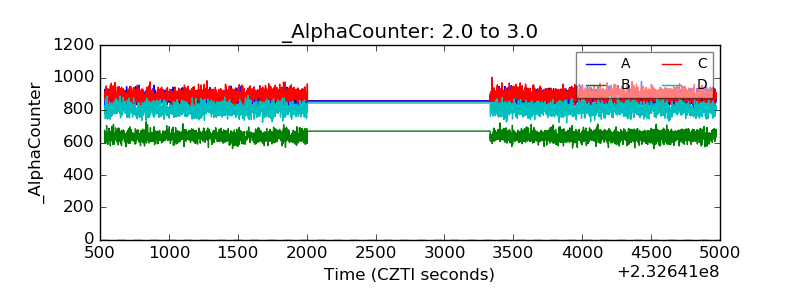 |
| _CPM_Rate | 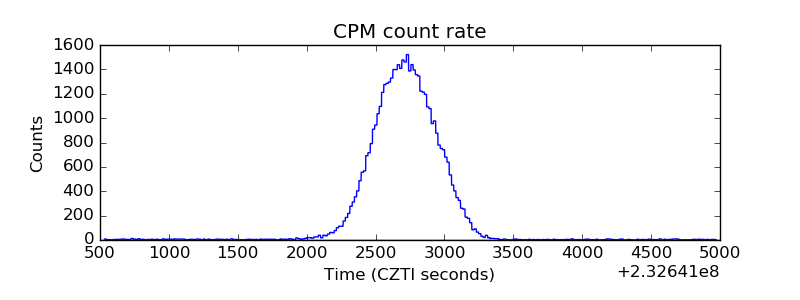 |
| CZT Counter | 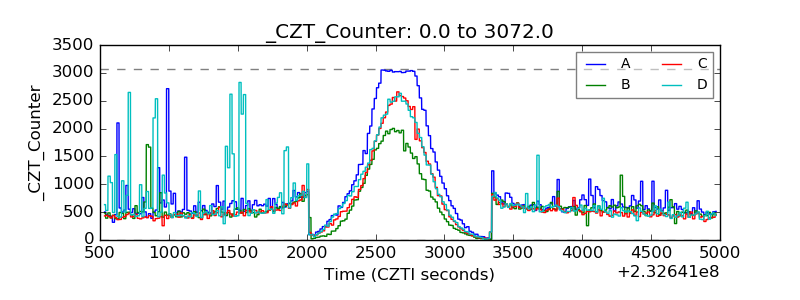 |
| +2.5 Volts monitor |  |
| +5 Volts monitor |  |
| _ROLL_ROT | 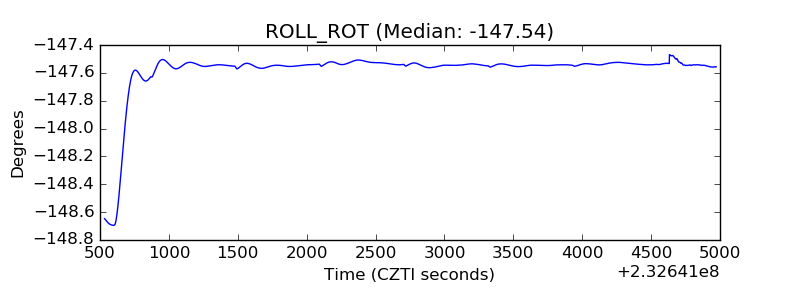 |
| _Roll_DEC | 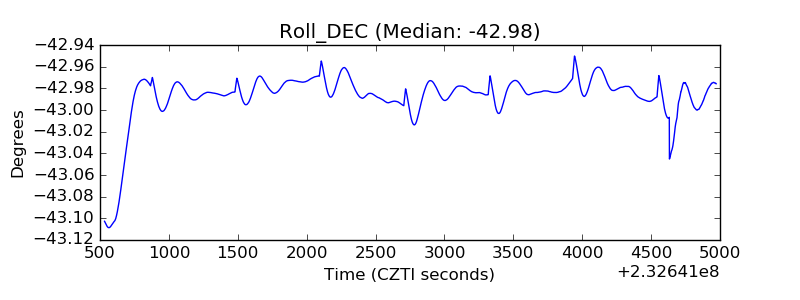 |
| _Roll_RA |  |
| Veto Counter | 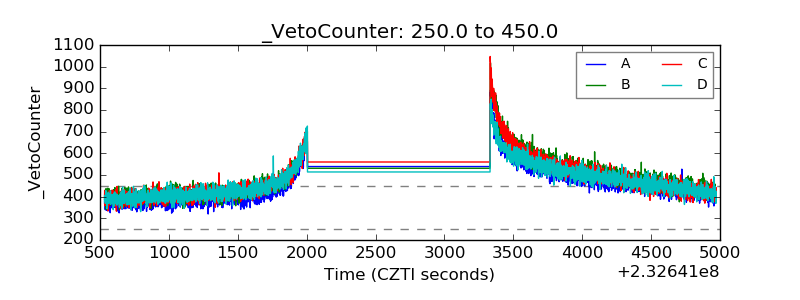 |