| Param | Original file | Final file |
|---|---|---|
| Filename | modeM0/AS1G07_087T01_9000001228_08833cztM0_level2.evt | modeM0/AS1G07_087T01_9000001228_08833cztM0_level2_quad_clean.evt |
| Size (bytes) | 561,432,960 | 105,341,760 |
| Size | 535.4 MB | 100.5 MB |
| Events in quadrant A | 5,265,873 | 674,131 |
| Events in quadrant B | 3,550,770 | 690,091 |
| Events in quadrant C | 3,294,107 | 663,068 |
| Events in quadrant D | 4,387,649 | 644,800 |
| Mode M0 | |||
|---|---|---|---|
| Quadrant | BADHDUFLAG | Total packets | Discarded packets |
| A | 0 | 20718 | 4 |
| B | 0 | 15649 | 3 |
| C | 0 | 15266 | 3 |
| D | 0 | 18181 | 3 |
| Mode M9 | |||
|---|---|---|---|
| Quadrant | BADHDUFLAG | Total packets | Discarded packets |
| A | 0 | 6 | 0 |
| B | 0 | 6 | 0 |
| C | 0 | 6 | 0 |
| D | 0 | 7 | 0 |
| Mode SS | |||
|---|---|---|---|
| Quadrant | BADHDUFLAG | Total packets | Discarded packets |
| A | 0 | 152 | 0 |
| B | 0 | 152 | 0 |
| C | 0 | 152 | 0 |
| D | 0 | 152 | 0 |
| Quadrant | Total seconds | Saturated seconds | Saturation percentage |
|---|---|---|---|
| A | 7441 | 159 | 2.136810% |
| B | 7441 | 59 | 0.792904% |
| C | 7441 | 33 | 0.443489% |
| D | 7441 | 93 | 1.249832% |
Noise dominated data is calculated using 1-second bins in cleaned event files. If a bin has >2000 counts, and if more than 50% of those come from <1% of pixels, then it is considered to be noise-dominated and hence unusable.
| Quadrant | # 1 sec bins | Bins with >0 counts | Bins with >2000 counts | High rate bins dominated by noise | Noise dominated (total time) | Noise dominated (detector-on time) | Marked lightcurve |
|---|---|---|---|---|---|---|---|
| A | 7706 | 7443 | 76 | 76 | 0.99% | 1.02% | 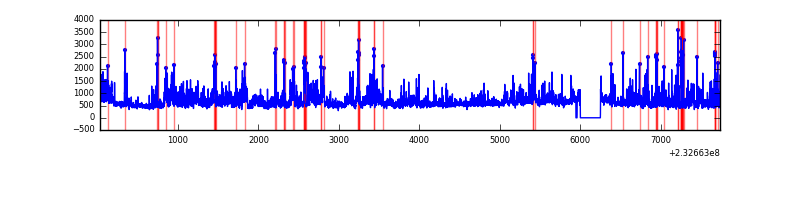 |
| B | 7706 | 7443 | 9 | 9 | 0.12% | 0.12% | 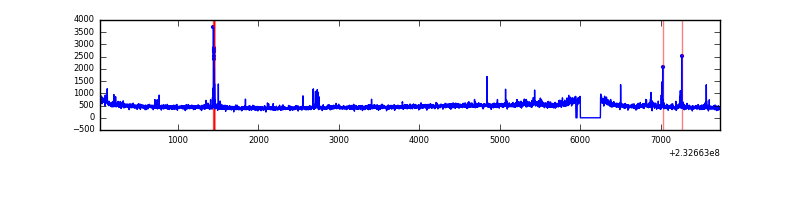 |
| C | 7706 | 7443 | 4 | 4 | 0.05% | 0.05% | 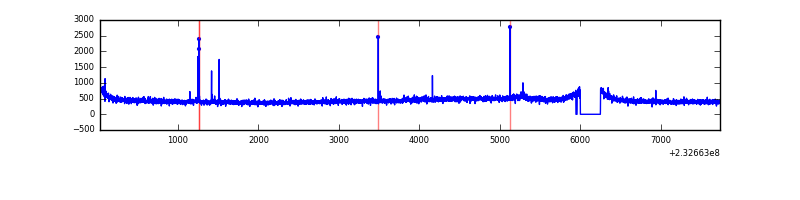 |
| D | 7706 | 7443 | 54 | 54 | 0.70% | 0.73% | 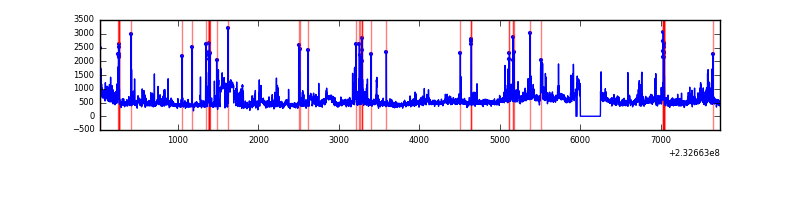 |
Top three noisy pixels from each quadrant. If the there are fewer than three noisy pixels in the level2.evt file, extra rows are filled as -1
| Pixel properties | Quadrant properties | ||||||
|---|---|---|---|---|---|---|---|
| Quadrant | DetID | PixID | Counts | Sigma | Mean | Median | Sigma |
| A | 8 | 5 | 1196386 | 6778.07 | 865 | 847 | 176.4 |
| A | 15 | 223 | 523297 | 2962.01 | 865 | 847 | 176.4 |
| A | 15 | 239 | 160495 | 905.12 | 865 | 847 | 176.4 |
| B | 0 | 214 | 64447 | 380.31 | 876 | 856 | 167.2 |
| B | 4 | 48 | 23316 | 134.33 | 876 | 856 | 167.2 |
| B | 5 | 255 | 20393 | 116.84 | 876 | 856 | 167.2 |
| C | 14 | 234 | 21374 | 106.56 | 830 | 834 | 192.8 |
| C | 1 | 3 | 18198 | 90.08 | 830 | 834 | 192.8 |
| C | 1 | 16 | 10693 | 51.15 | 830 | 834 | 192.8 |
| D | 1 | 52 | 387155 | 1782.68 | 825 | 803 | 216.7 |
| D | 2 | 152 | 232947 | 1071.14 | 825 | 803 | 216.7 |
| D | 8 | 195 | 229197 | 1053.84 | 825 | 803 | 216.7 |
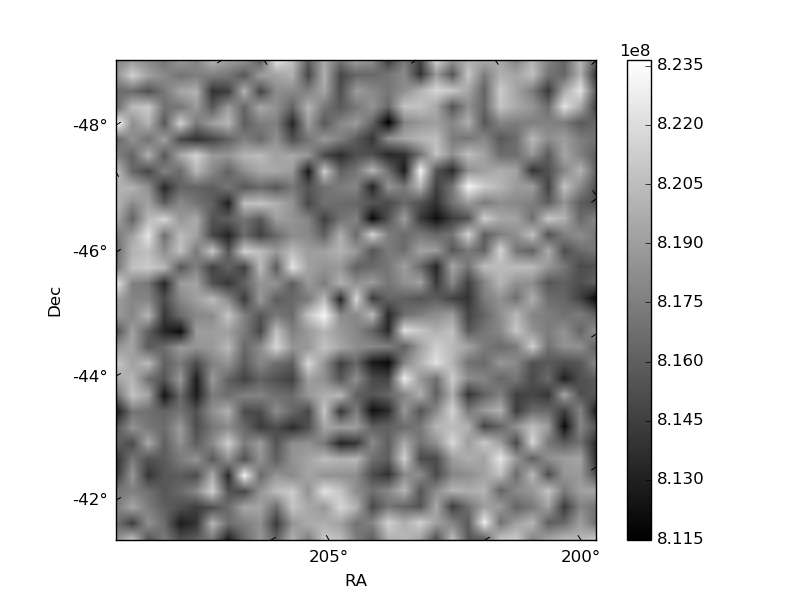
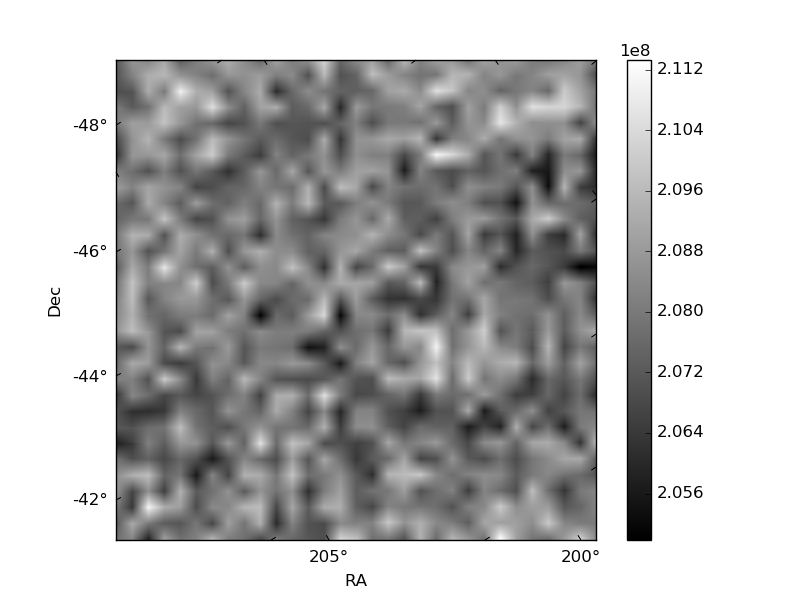
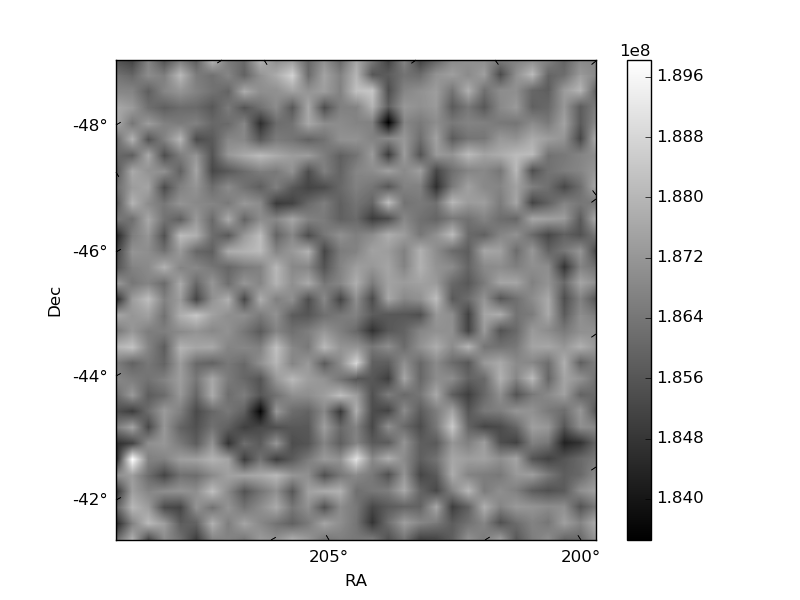
Histogram calculated using DETX and DETY for each event in the final _common_clean file
| Quadrant A | 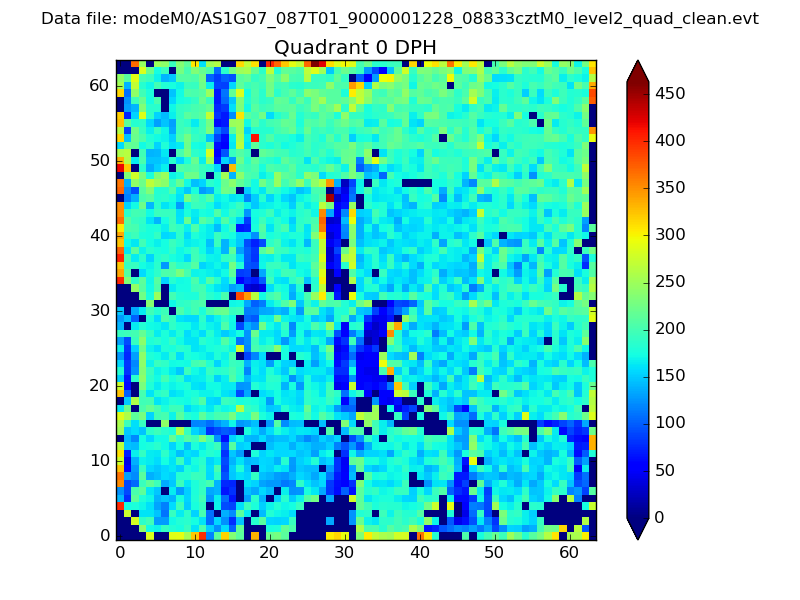 |
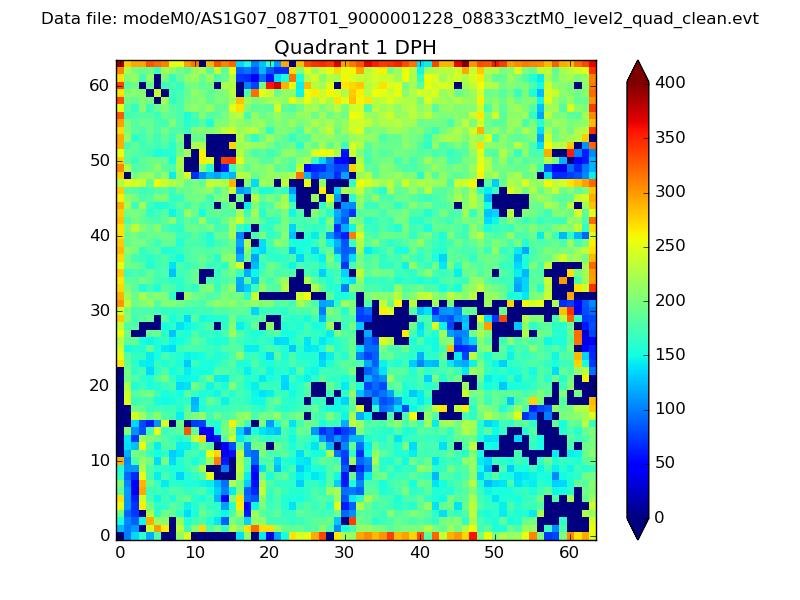 |
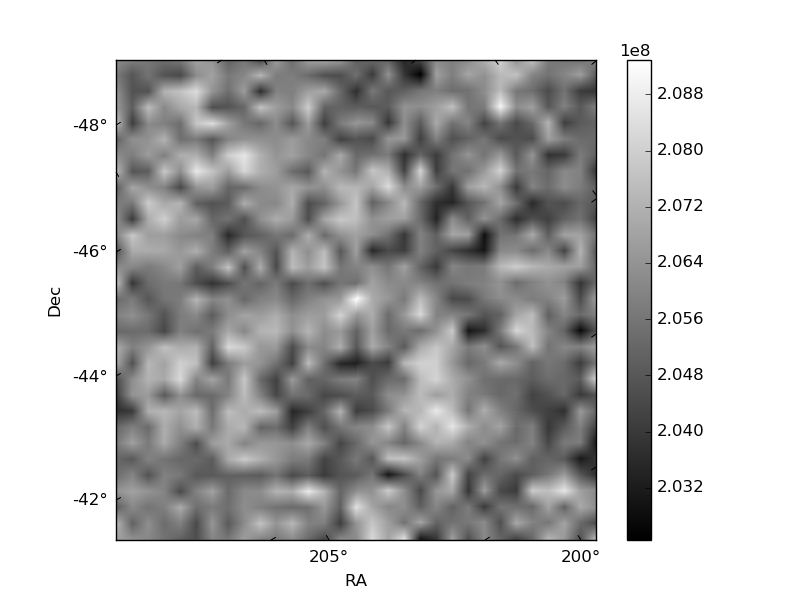
Quadrant B |
|---|---|---|---|
| Quadrant D | 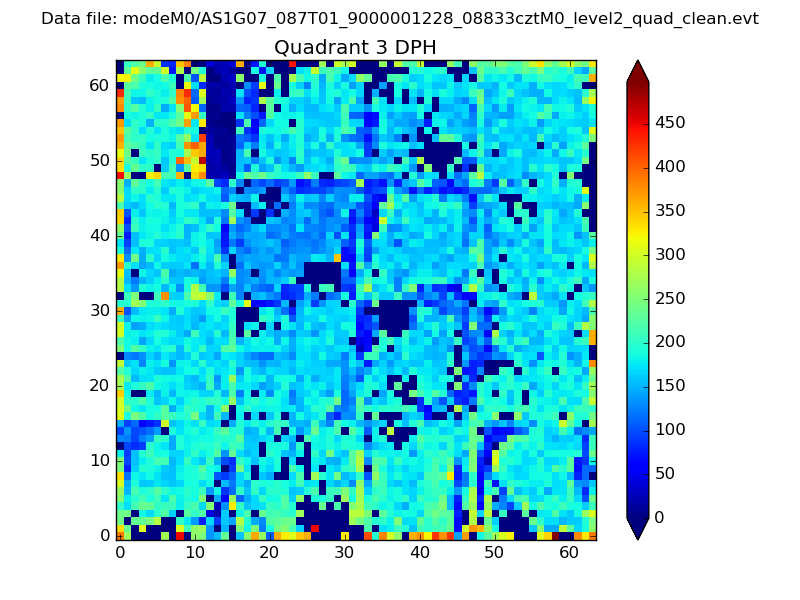 |
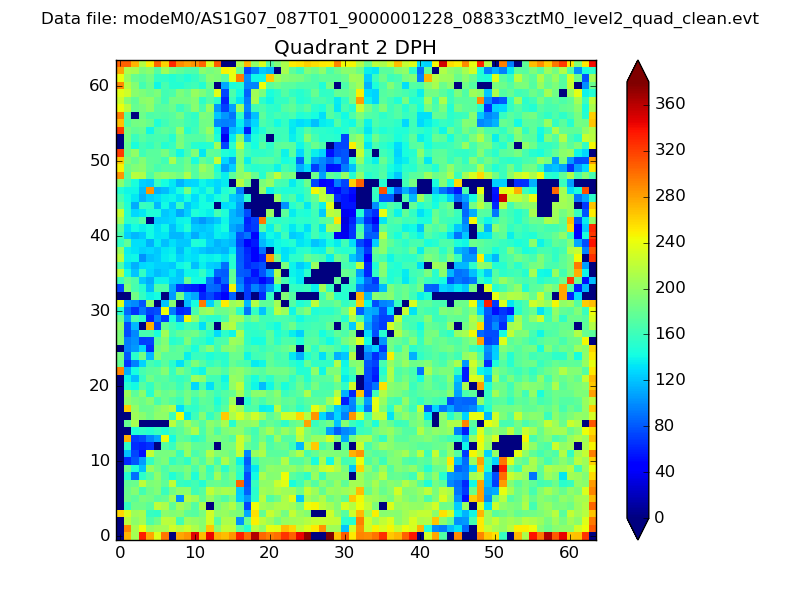 |
Quadrant C |
| Plot type | Count rate plots | Images |
|---|---|---|
| Comparison with Poisson distribution Blue bars denote a histogram of data divided into 1 sec bins. Red curve is a Poisson curve with rate = median count rate of data. |
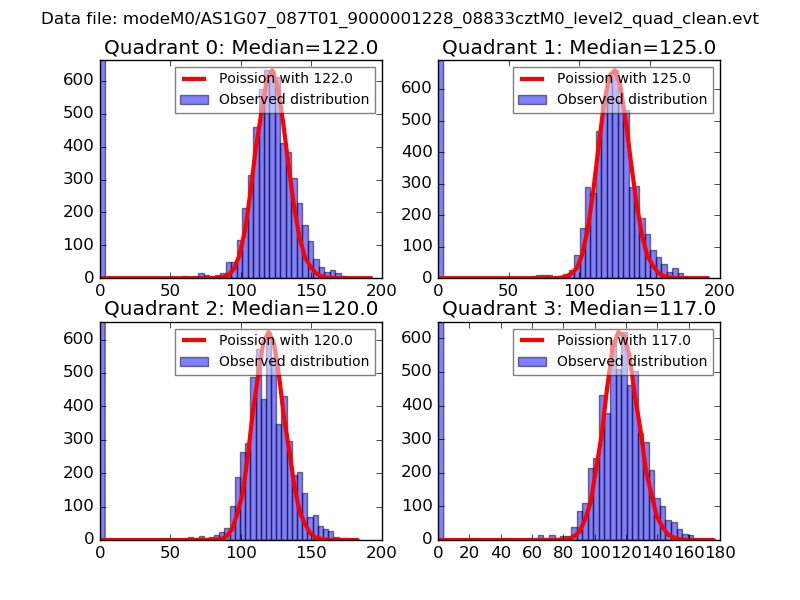 |
 |
| Quadrant-wise count rates Data is divided into 100 sec bins |
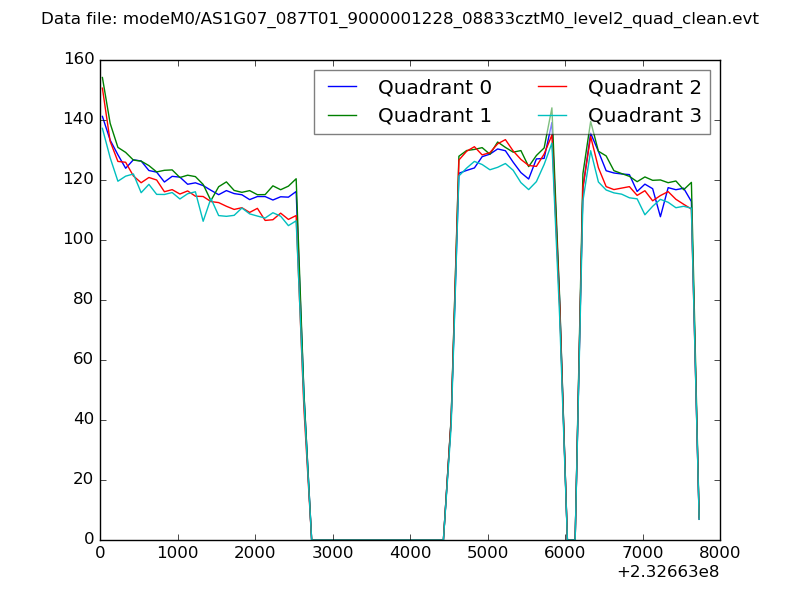 |
|
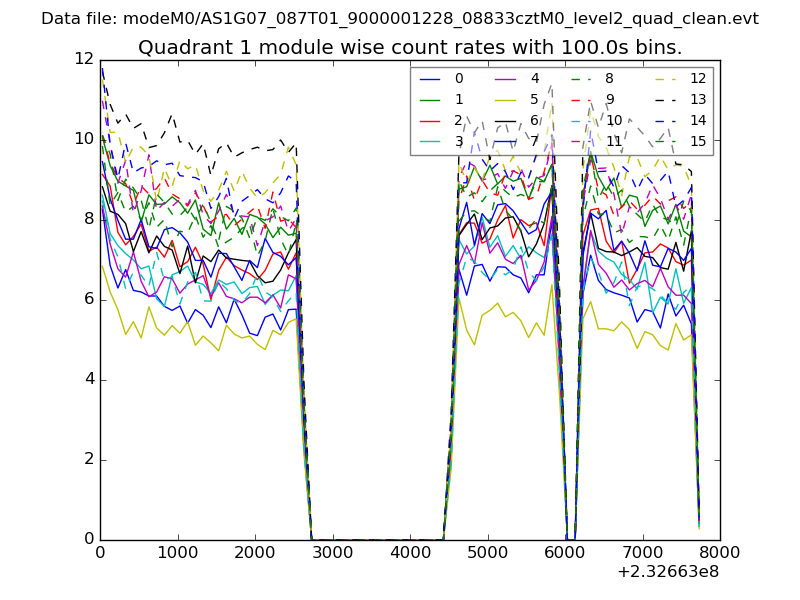
| Module-wise count rates for Quadrant A Data is divided into 100 sec bins |
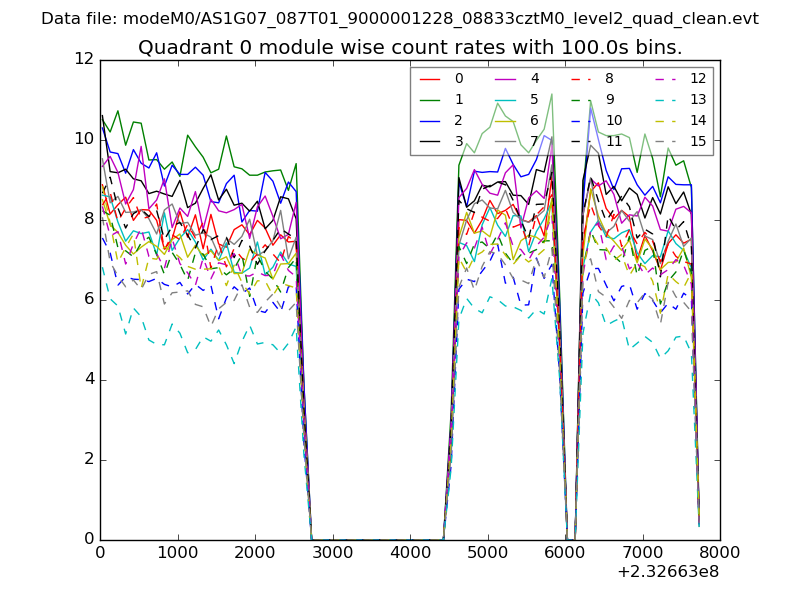 |
 |
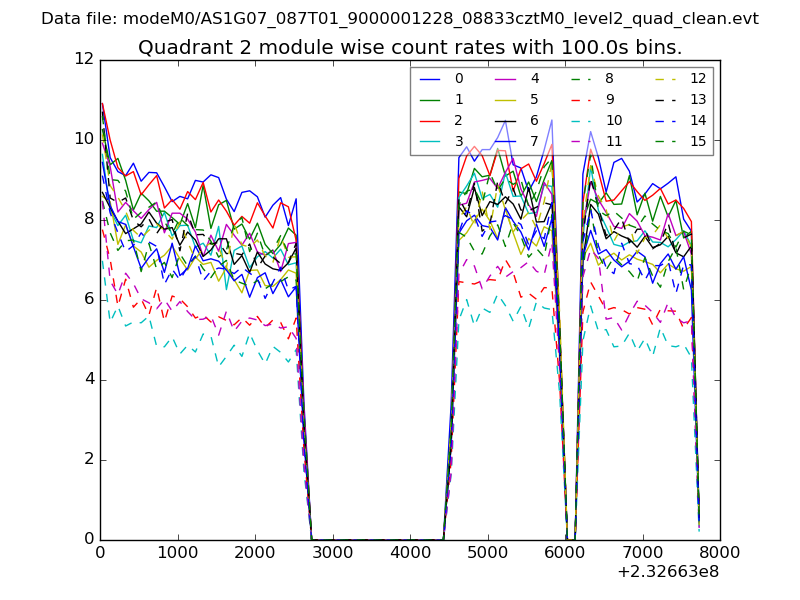
| Module-wise count rates for Quadrant B Data is divided into 100 sec bins |
 |
 |
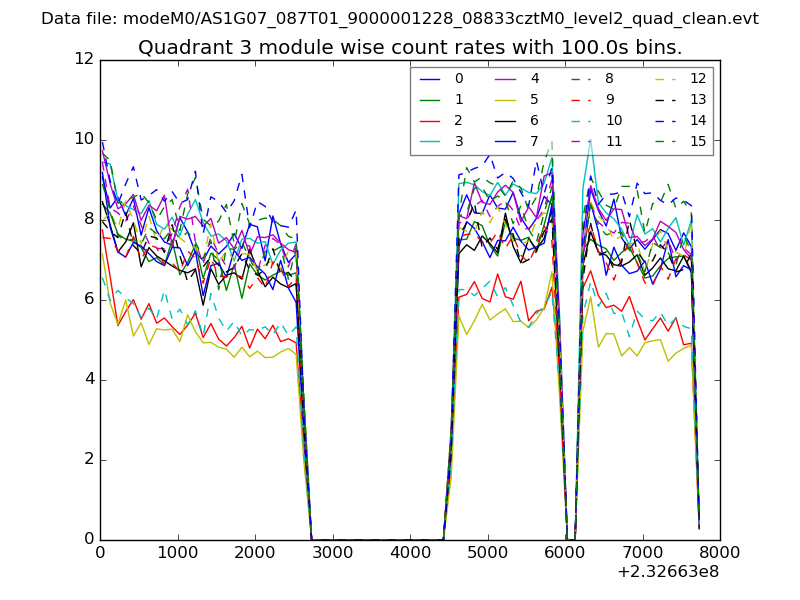
| Module-wise count rates for Quadrant C Data is divided into 100 sec bins |
 |
 |
| Module-wise count rates for Quadrant D Data is divided into 100 sec bins |
 |
 |
| Parameter | Plot |
|---|---|
| CZT HV Monitor | 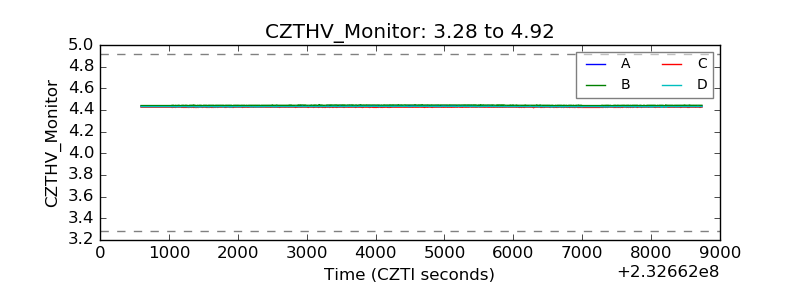 |
| D_VDD |  |
| Temperature 1 | 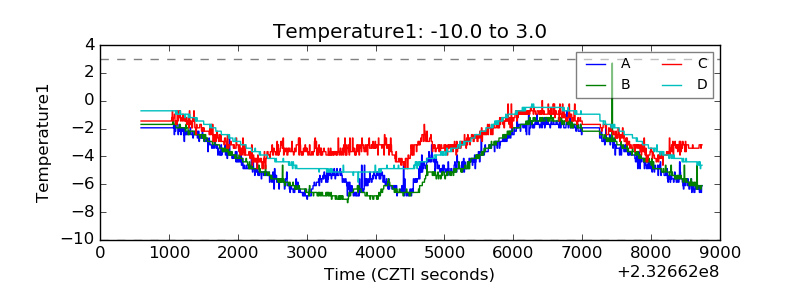 |
| Veto HV Monitor |  |
| Veto LLD | 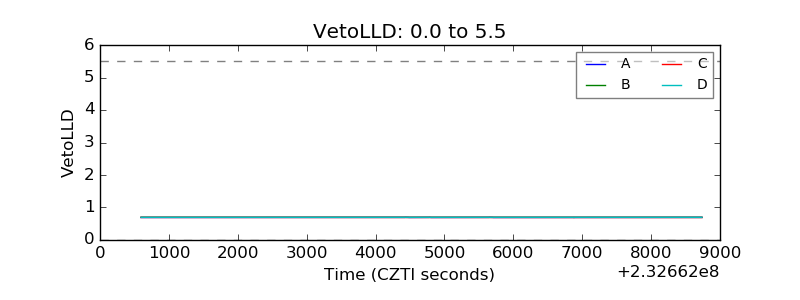 |
| Alpha Counter | 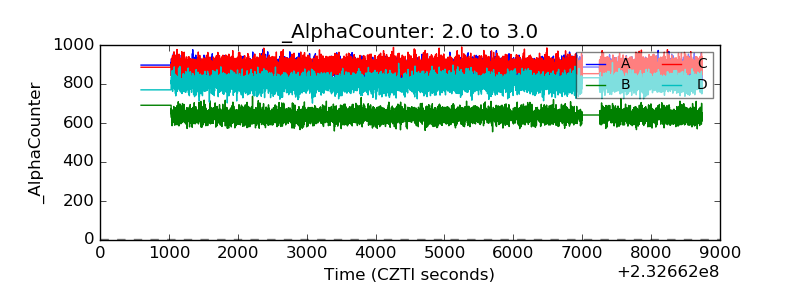 |
| _CPM_Rate | 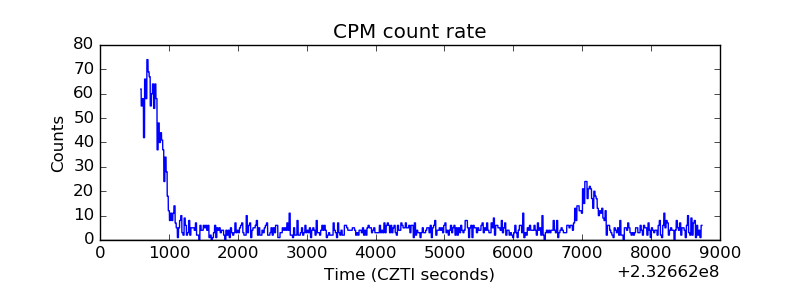 |
| CZT Counter | 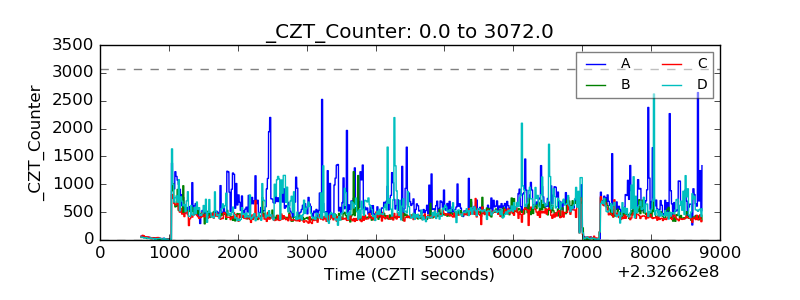 |
| +2.5 Volts monitor |  |
| +5 Volts monitor |  |
| _ROLL_ROT | 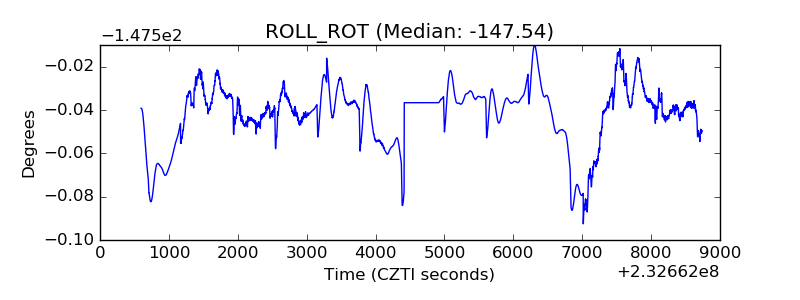 |
| _Roll_DEC | 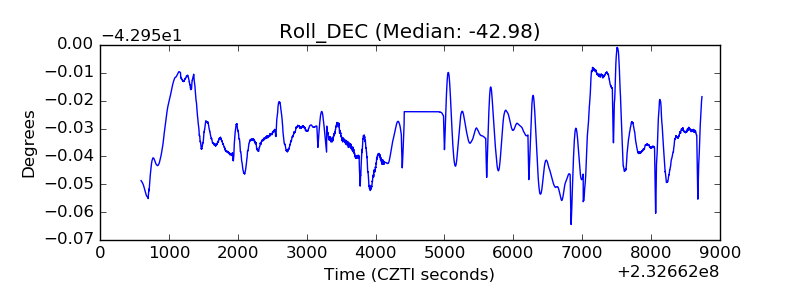 |
| _Roll_RA |  |
| Veto Counter | 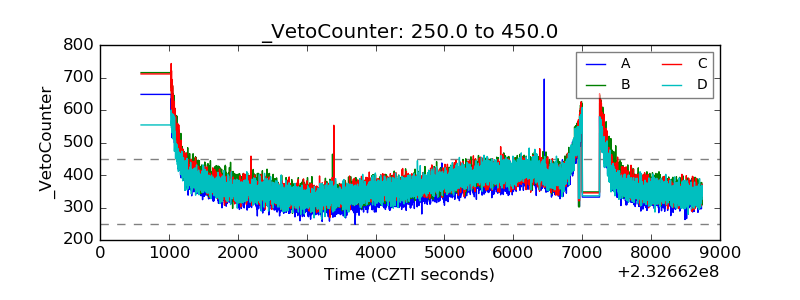 |