| Param | Original file | Final file |
|---|---|---|
| Filename | modeM0/AS1G07_087T01_9000001228_08834cztM0_level2.evt | modeM0/AS1G07_087T01_9000001228_08834cztM0_level2_quad_clean.evt |
| Size (bytes) | 1,736,058,240 | 303,488,640 |
| Size | 1.6 GB | 289.4 MB |
| Events in quadrant A | 14,393,819 | 2,002,075 |
| Events in quadrant B | 10,700,544 | 2,053,247 |
| Events in quadrant C | 9,703,993 | 1,957,893 |
| Events in quadrant D | 16,339,006 | 1,709,627 |
| Mode M0 | |||
|---|---|---|---|
| Quadrant | BADHDUFLAG | Total packets | Discarded packets |
| A | 0 | 57398 | 149 |
| B | 0 | 46240 | 105 |
| C | 0 | 44202 | 106 |
| D | 0 | 63169 | 137 |
| Mode M9 | |||
|---|---|---|---|
| Quadrant | BADHDUFLAG | Total packets | Discarded packets |
| A | 0 | 40 | 0 |
| B | 0 | 40 | 0 |
| C | 0 | 40 | 0 |
| D | 0 | 40 | 0 |
| Mode SS | |||
|---|---|---|---|
| Quadrant | BADHDUFLAG | Total packets | Discarded packets |
| A | 0 | 440 | 0 |
| B | 0 | 440 | 0 |
| C | 0 | 440 | 0 |
| D | 0 | 440 | 0 |
| Quadrant | Total seconds | Saturated seconds | Saturation percentage |
|---|---|---|---|
| A | 21315 | 803 | 3.767300% |
| B | 21323 | 348 | 1.632041% |
| C | 21323 | 171 | 0.801951% |
| D | 21320 | 2246 | 10.534709% |
Noise dominated data is calculated using 1-second bins in cleaned event files. If a bin has >2000 counts, and if more than 50% of those come from <1% of pixels, then it is considered to be noise-dominated and hence unusable.
| Quadrant | # 1 sec bins | Bins with >0 counts | Bins with >2000 counts | High rate bins dominated by noise | Noise dominated (total time) | Noise dominated (detector-on time) | Marked lightcurve |
|---|---|---|---|---|---|---|---|
| A | 35712 | 21343 | 360 | 360 | 1.01% | 1.69% | 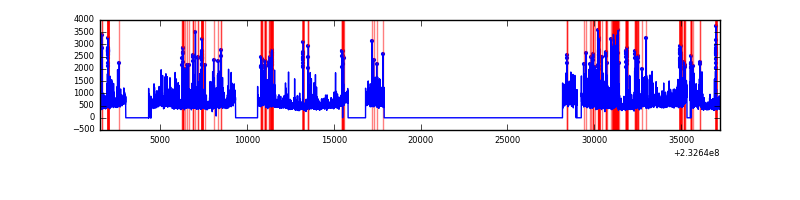 |
| B | 35712 | 21350 | 37 | 37 | 0.10% | 0.17% | 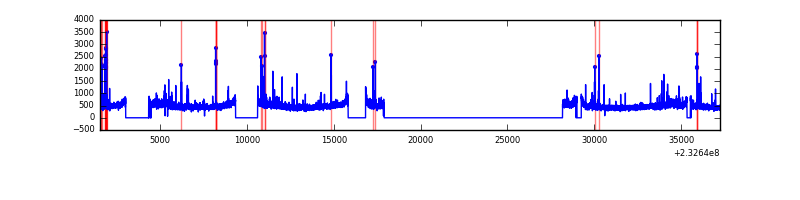 |
| C | 35712 | 21355 | 2 | 2 | 0.01% | 0.01% | 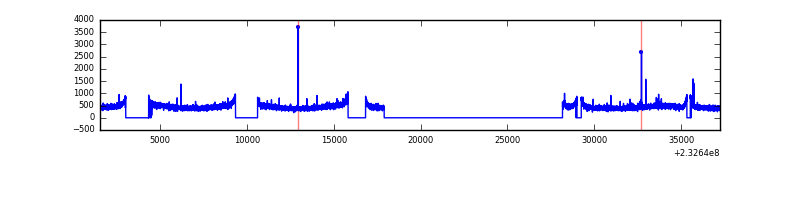 |
| D | 35711 | 21347 | 1993 | 1993 | 5.58% | 9.34% | 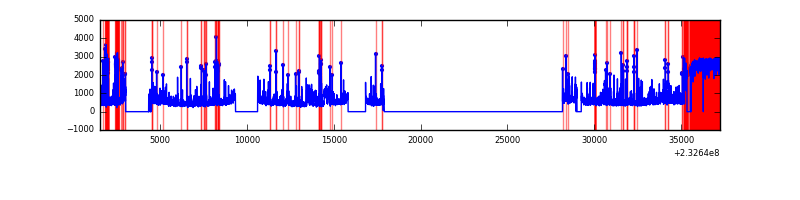 |
Top three noisy pixels from each quadrant. If the there are fewer than three noisy pixels in the level2.evt file, extra rows are filled as -1
| Pixel properties | Quadrant properties | ||||||
|---|---|---|---|---|---|---|---|
| Quadrant | DetID | PixID | Counts | Sigma | Mean | Median | Sigma |
| A | 8 | 5 | 2669566 | 5190.99 | 2559 | 2512 | 513.8 |
| A | 15 | 223 | 1057199 | 2052.78 | 2559 | 2512 | 513.8 |
| A | 15 | 239 | 402284 | 778.09 | 2559 | 2512 | 513.8 |
| B | 10 | 16 | 310296 | 632.48 | 2594 | 2536 | 486.6 |
| B | 0 | 214 | 174653 | 353.72 | 2594 | 2536 | 486.6 |
| B | 5 | 255 | 66835 | 132.14 | 2594 | 2536 | 486.6 |
| C | 14 | 234 | 33899 | 55.54 | 2466 | 2474 | 565.8 |
| C | 13 | 61 | 19114 | 29.41 | 2466 | 2474 | 565.8 |
| C | 12 | 4 | 15260 | 22.6 | 2466 | 2474 | 565.8 |
| D | 2 | 16 | 5320816 | 9067.21 | 2267 | 2209 | 586.6 |
| D | 1 | 52 | 853648 | 1451.54 | 2267 | 2209 | 586.6 |
| D | 8 | 195 | 449486 | 762.52 | 2267 | 2209 | 586.6 |
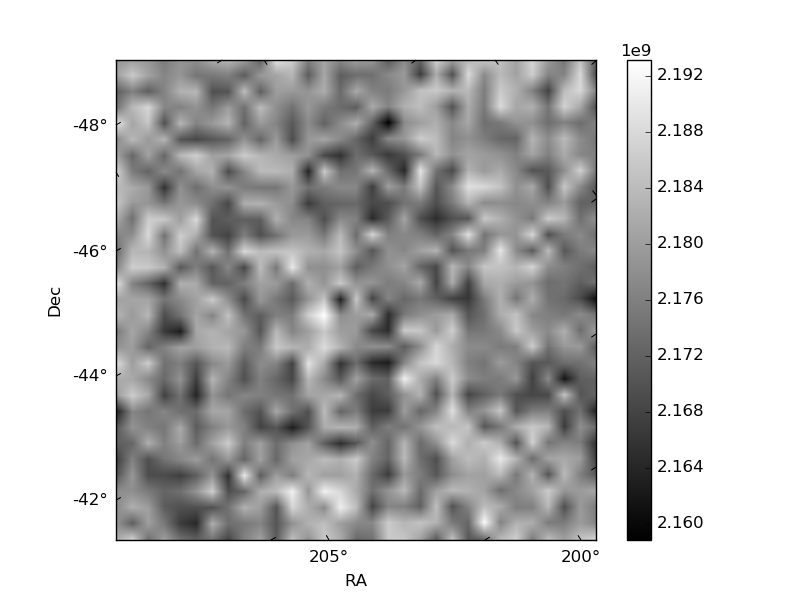
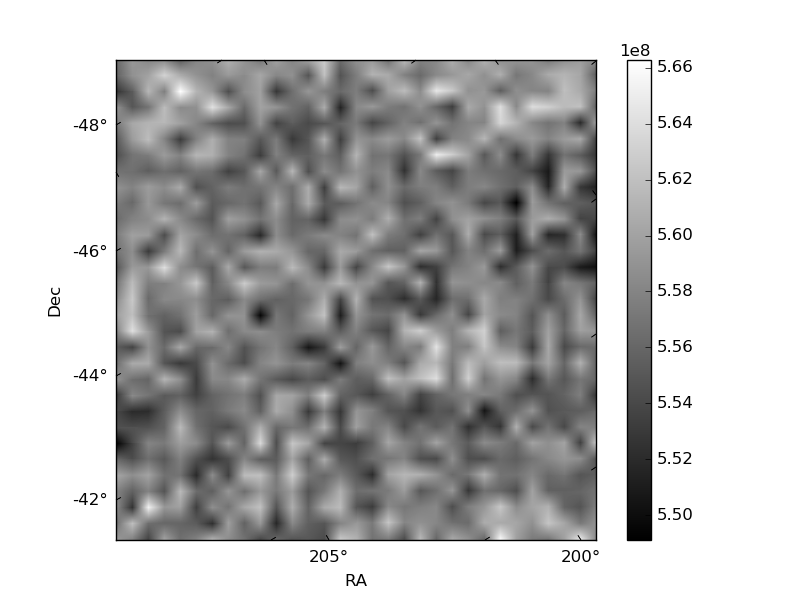
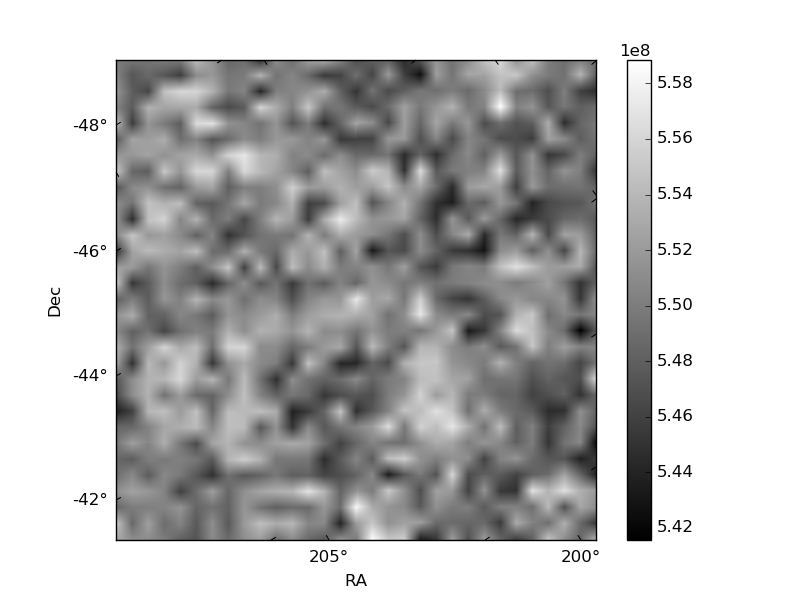
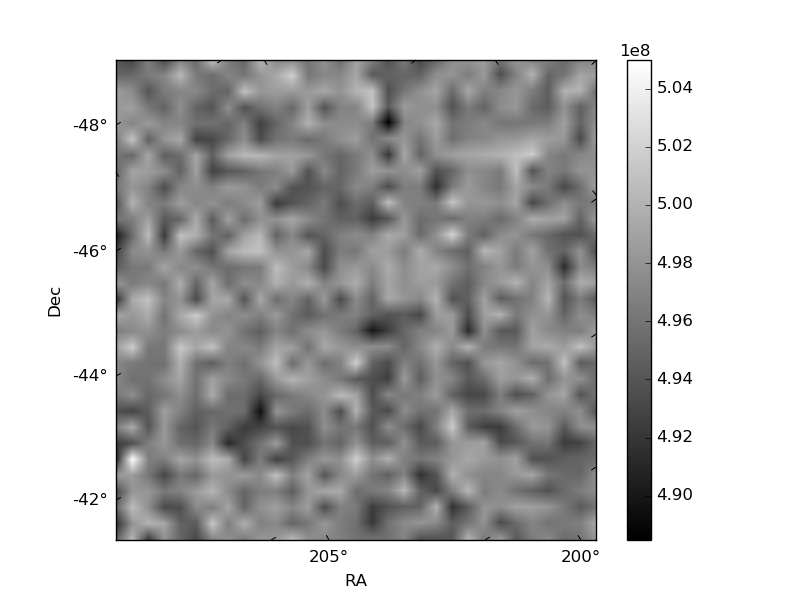
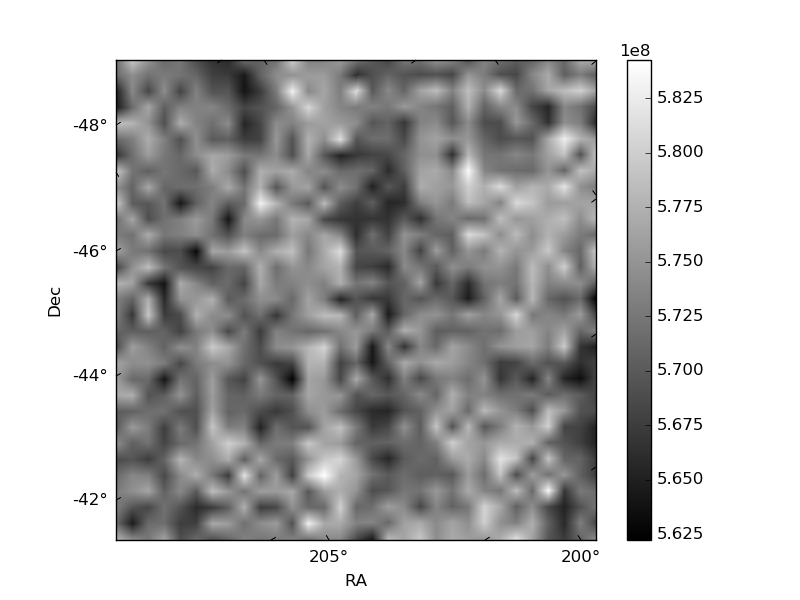
Histogram calculated using DETX and DETY for each event in the final _common_clean file
| Quadrant A | 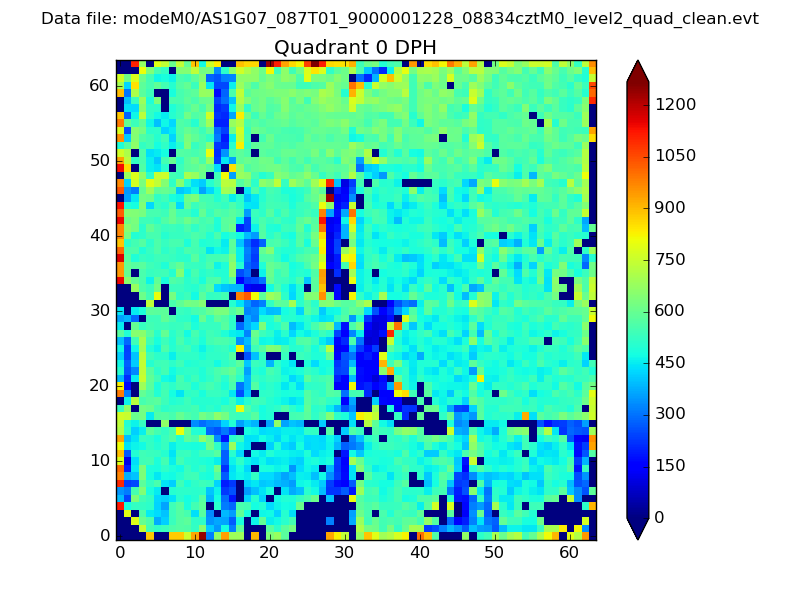 |
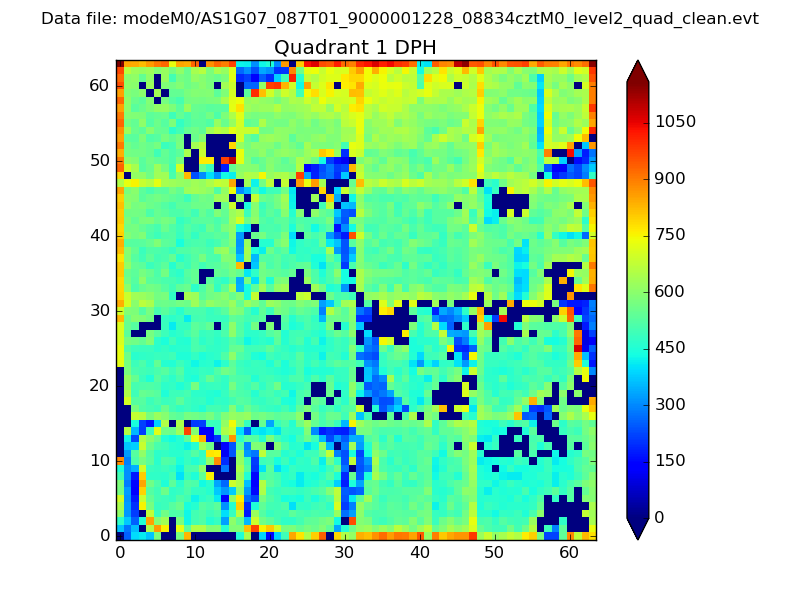 |
Quadrant B |
|---|---|---|---|
| Quadrant D | 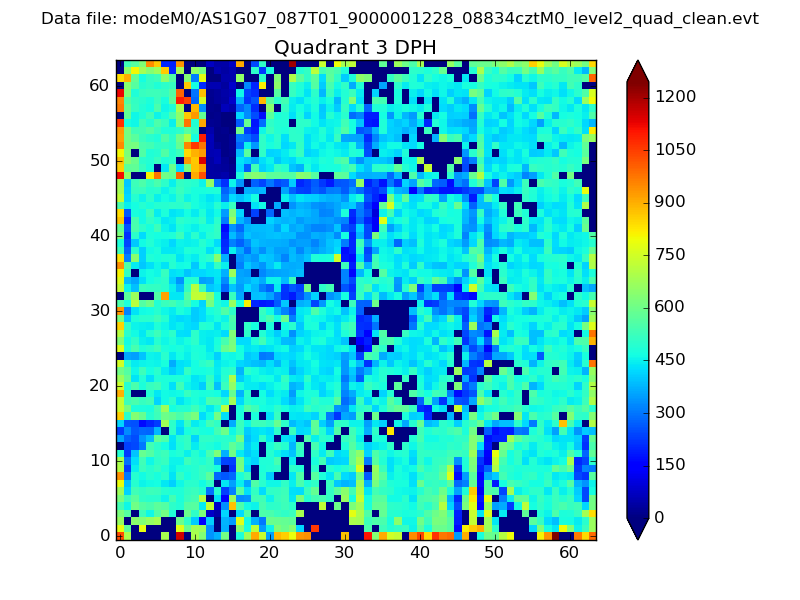 |
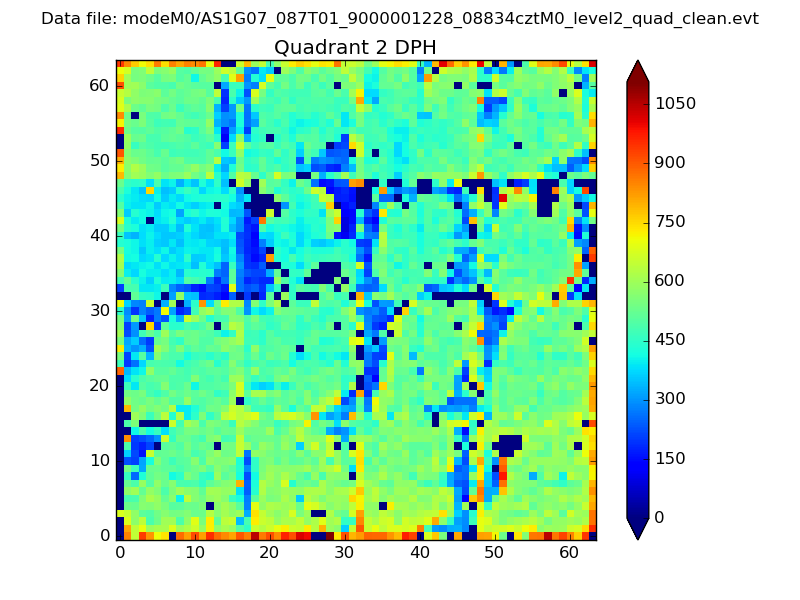 |
Quadrant C |
| Plot type | Count rate plots | Images |
|---|---|---|
| Comparison with Poisson distribution Blue bars denote a histogram of data divided into 1 sec bins. Red curve is a Poisson curve with rate = median count rate of data. |
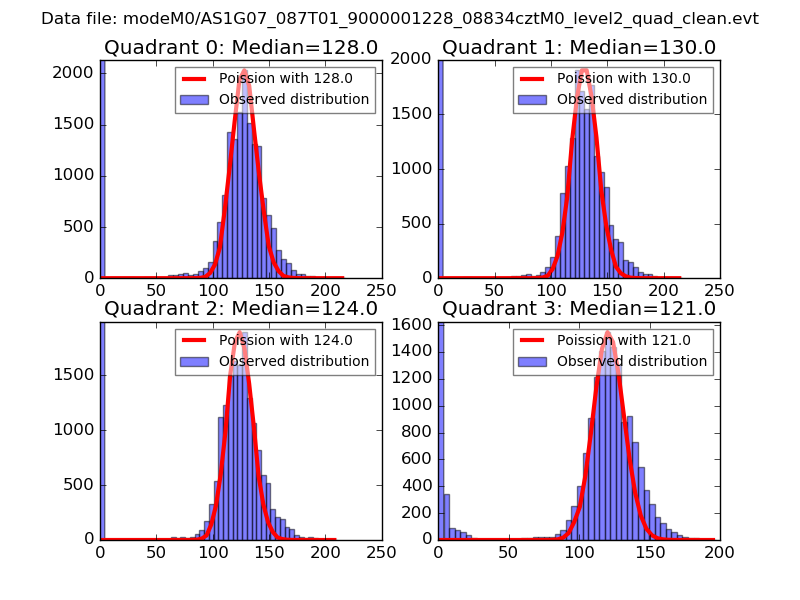 |
 |
| Quadrant-wise count rates Data is divided into 100 sec bins |
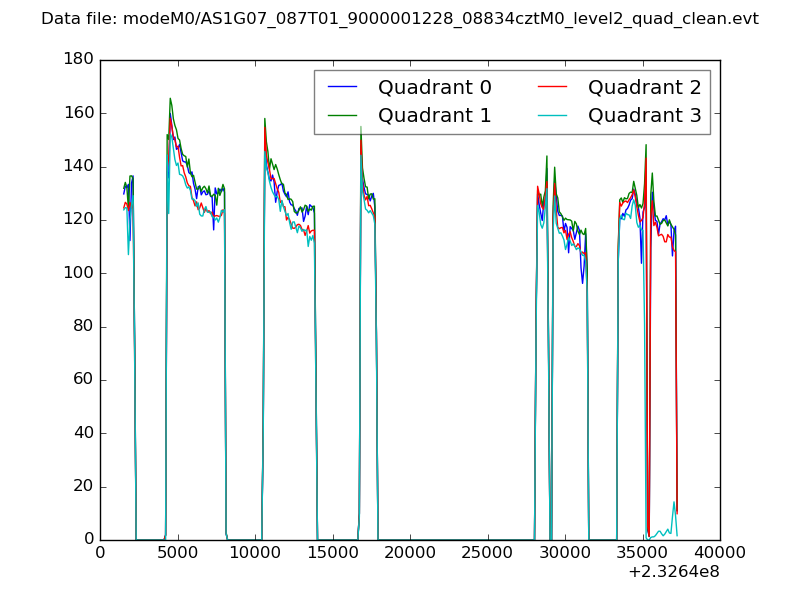 |
|
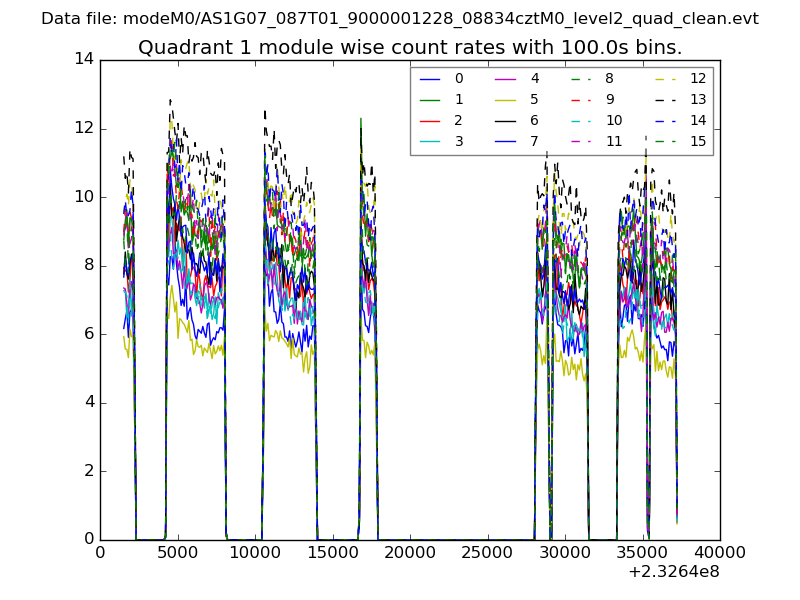
| Module-wise count rates for Quadrant A Data is divided into 100 sec bins |
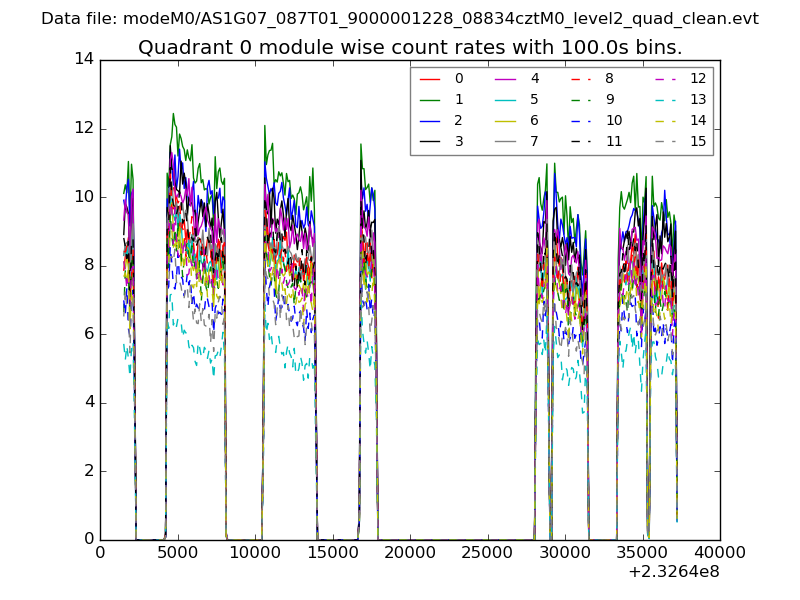 |
 |
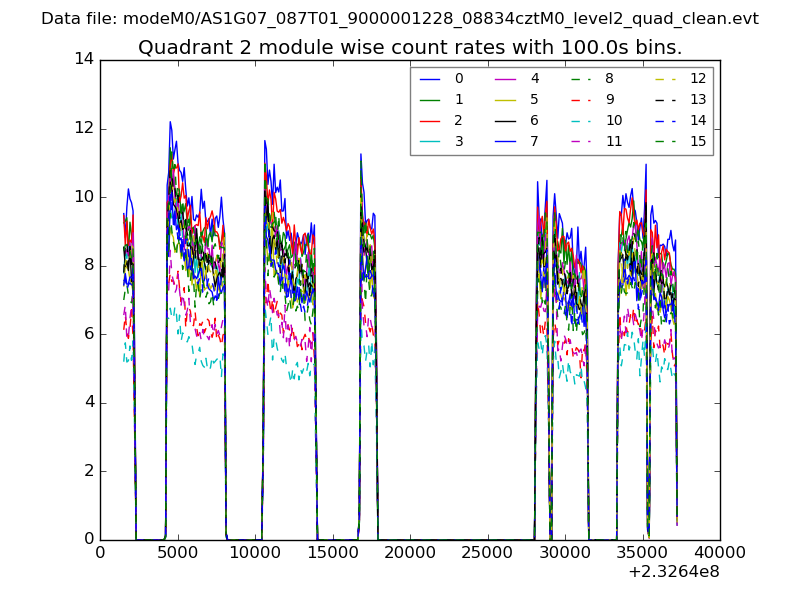
| Module-wise count rates for Quadrant B Data is divided into 100 sec bins |
 |
 |
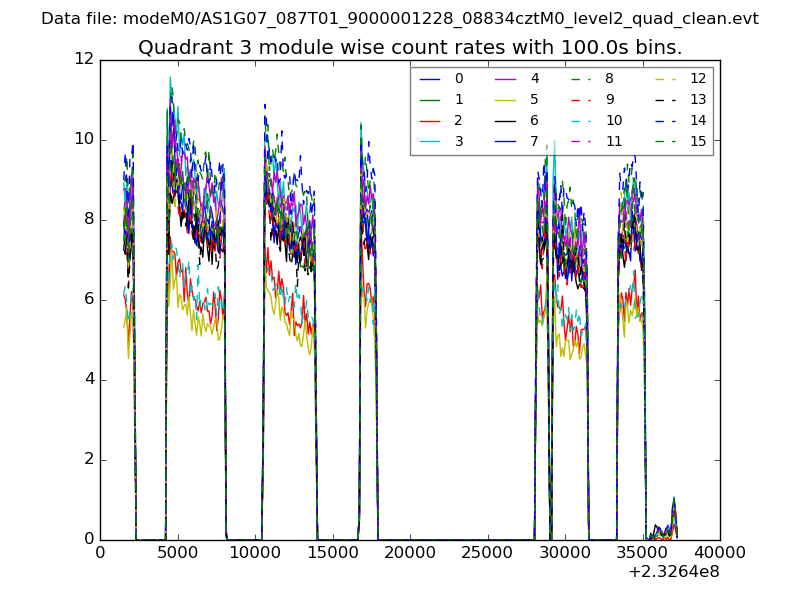
| Module-wise count rates for Quadrant C Data is divided into 100 sec bins |
 |
 |
| Module-wise count rates for Quadrant D Data is divided into 100 sec bins |
 |
 |
| Parameter | Plot |
|---|---|
| CZT HV Monitor | 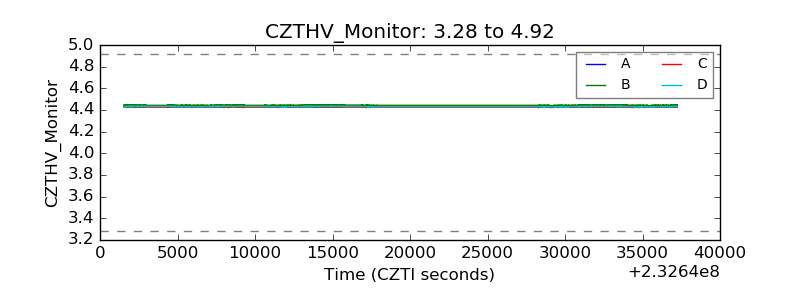 |
| D_VDD | 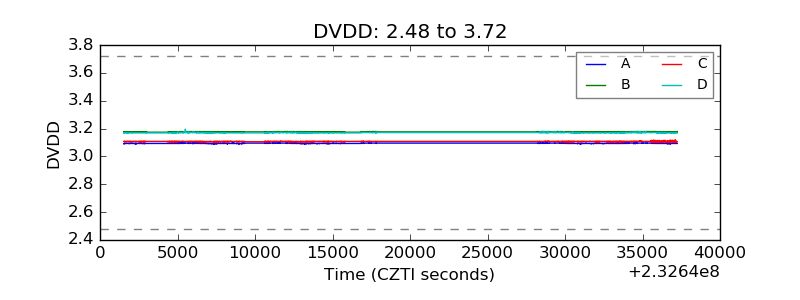 |
| Temperature 1 | 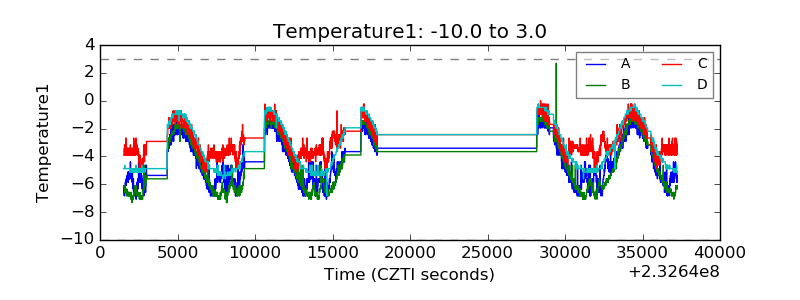 |
| Veto HV Monitor | 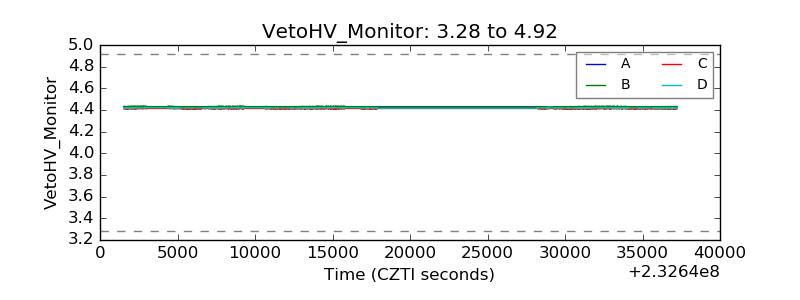 |
| Veto LLD | 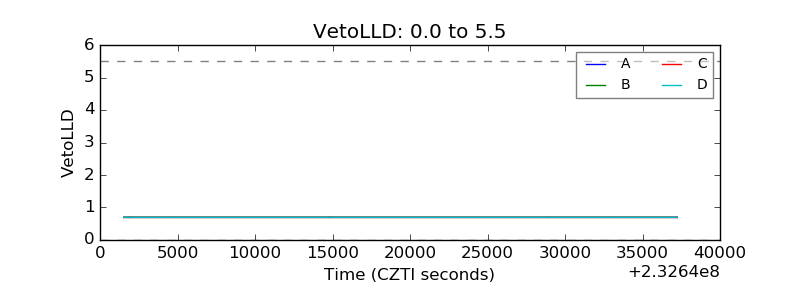 |
| Alpha Counter | 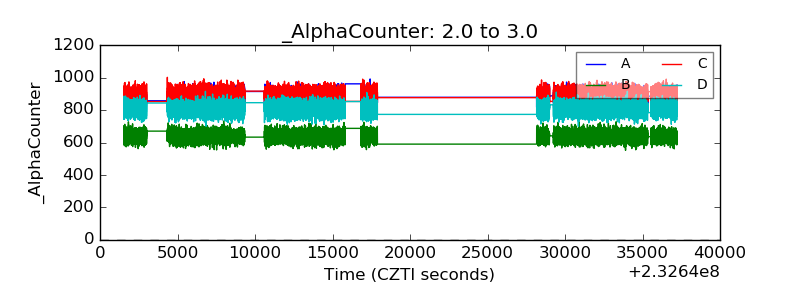 |
| _CPM_Rate | 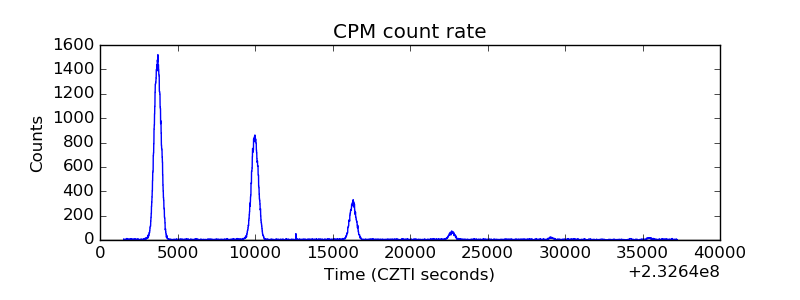 |
| CZT Counter | 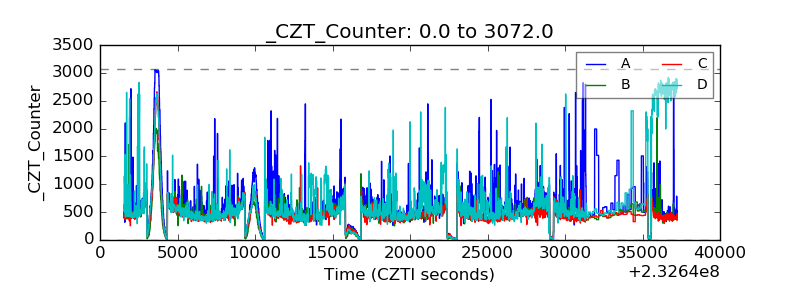 |
| +2.5 Volts monitor |  |
| +5 Volts monitor |  |
| _ROLL_ROT | 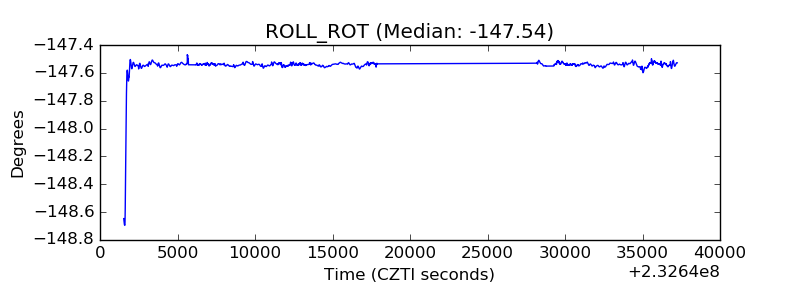 |
| _Roll_DEC | 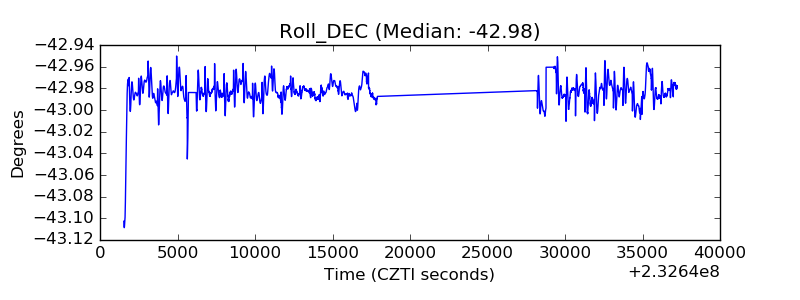 |
| _Roll_RA | 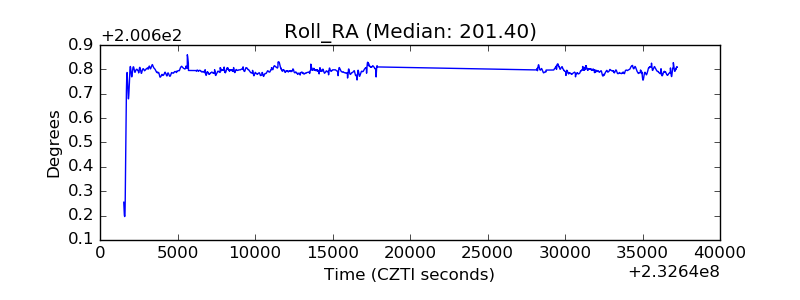 |
| Veto Counter | 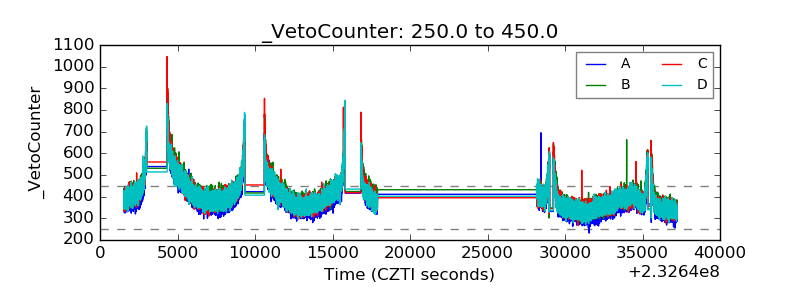 |