| Param | Original file | Final file |
|---|---|---|
| Filename | modeM0/AS1G07_087T01_9000001228_08838cztM0_level2.evt | modeM0/AS1G07_087T01_9000001228_08838cztM0_level2_quad_clean.evt |
| Size (bytes) | 543,254,400 | 75,965,760 |
| Size | 518.1 MB | 72.4 MB |
| Events in quadrant A | 4,408,392 | 449,676 |
| Events in quadrant B | 3,762,922 | 464,383 |
| Events in quadrant C | 3,201,743 | 454,850 |
| Events in quadrant D | 4,599,629 | 438,563 |
| Mode M0 | |||
|---|---|---|---|
| Quadrant | BADHDUFLAG | Total packets | Discarded packets |
| A | 0 | 17645 | 34 |
| B | 0 | 15815 | 27 |
| C | 0 | 14503 | 34 |
| D | 0 | 18414 | 21 |
| Mode M9 | |||
|---|---|---|---|
| Quadrant | BADHDUFLAG | Total packets | Discarded packets |
| A | 0 | 16 | 0 |
| B | 0 | 16 | 0 |
| C | 0 | 16 | 0 |
| D | 0 | 16 | 0 |
| Mode SS | |||
|---|---|---|---|
| Quadrant | BADHDUFLAG | Total packets | Discarded packets |
| A | 0 | 146 | 0 |
| B | 0 | 146 | 2 |
| C | 0 | 146 | 0 |
| D | 0 | 146 | 0 |
| Quadrant | Total seconds | Saturated seconds | Saturation percentage |
|---|---|---|---|
| A | 7075 | 261 | 3.689046% |
| B | 7074 | 148 | 2.092169% |
| C | 7068 | 72 | 1.018676% |
| D | 7076 | 380 | 5.370266% |
Noise dominated data is calculated using 1-second bins in cleaned event files. If a bin has >2000 counts, and if more than 50% of those come from <1% of pixels, then it is considered to be noise-dominated and hence unusable.
| Quadrant | # 1 sec bins | Bins with >0 counts | Bins with >2000 counts | High rate bins dominated by noise | Noise dominated (total time) | Noise dominated (detector-on time) | Marked lightcurve |
|---|---|---|---|---|---|---|---|
| A | 8723 | 7083 | 111 | 111 | 1.27% | 1.57% | 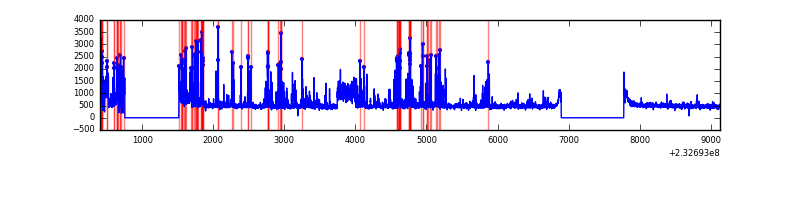 |
| B | 8723 | 7082 | 45 | 45 | 0.52% | 0.64% | 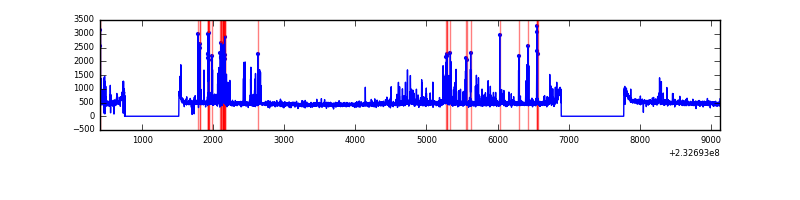 |
| C | 8723 | 7082 | 0 | 0 | 0.00% | 0.00% |  |
| D | 8723 | 7082 | 295 | 295 | 3.38% | 4.17% | 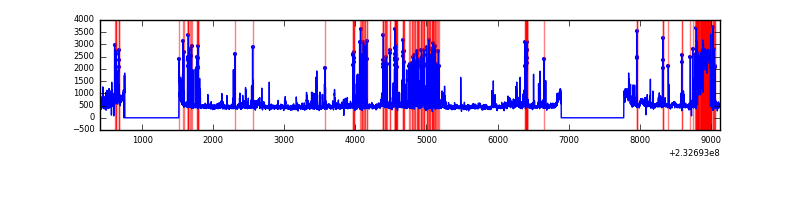 |
Top three noisy pixels from each quadrant. If the there are fewer than three noisy pixels in the level2.evt file, extra rows are filled as -1
| Pixel properties | Quadrant properties | ||||||
|---|---|---|---|---|---|---|---|
| Quadrant | DetID | PixID | Counts | Sigma | Mean | Median | Sigma |
| A | 15 | 223 | 476378 | 2842.26 | 829 | 810 | 167.3 |
| A | 8 | 5 | 302462 | 1802.84 | 829 | 810 | 167.3 |
| A | 15 | 239 | 236644 | 1409.47 | 829 | 810 | 167.3 |
| B | 4 | 48 | 432588 | 2673.88 | 844 | 824 | 161.5 |
| B | 7 | 202 | 20815 | 123.8 | 844 | 824 | 161.5 |
| B | 12 | 111 | 17770 | 104.95 | 844 | 824 | 161.5 |
| C | 1 | 16 | 7482 | 34.85 | 817 | 819 | 191.2 |
| C | 13 | 61 | 6243 | 28.37 | 817 | 819 | 191.2 |
| C | 12 | 4 | 5653 | 25.28 | 817 | 819 | 191.2 |
| D | 1 | 52 | 868677 | 4452.22 | 797 | 777 | 194.9 |
| D | 2 | 14 | 509020 | 2607.23 | 797 | 777 | 194.9 |
| D | 8 | 195 | 92632 | 471.2 | 797 | 777 | 194.9 |
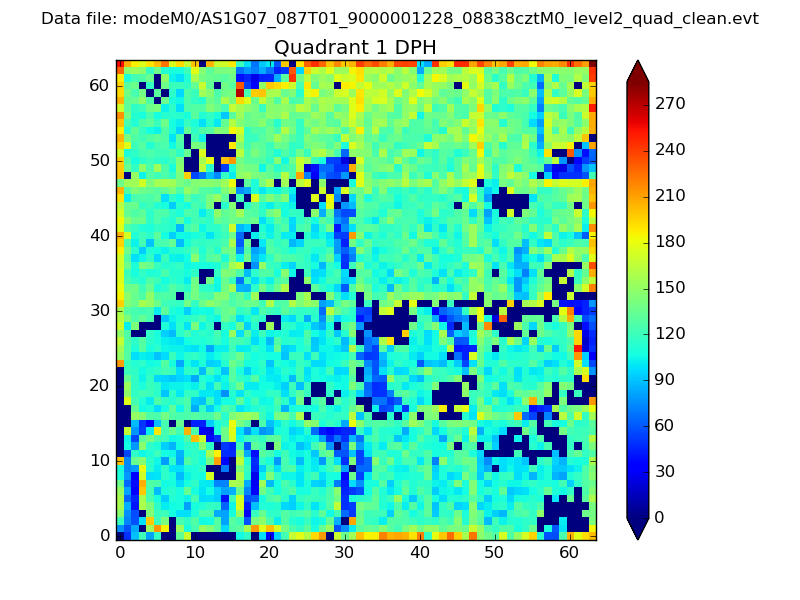
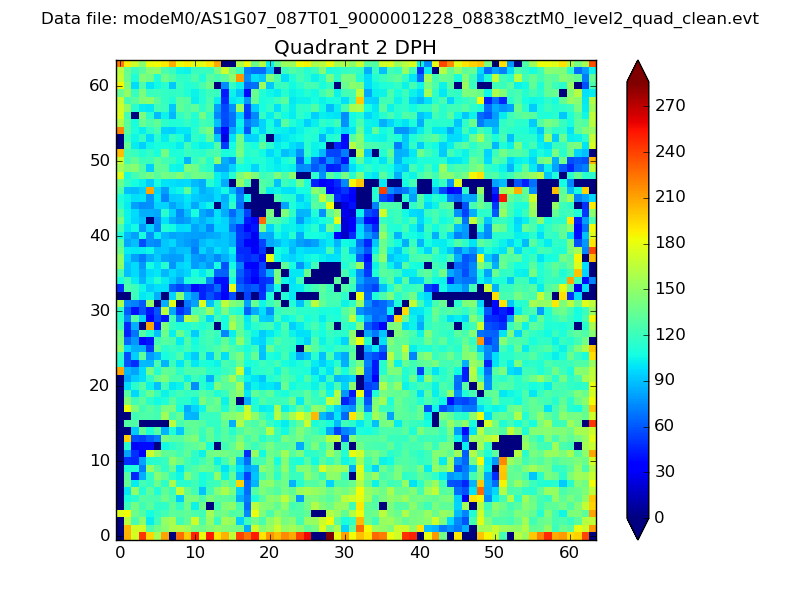
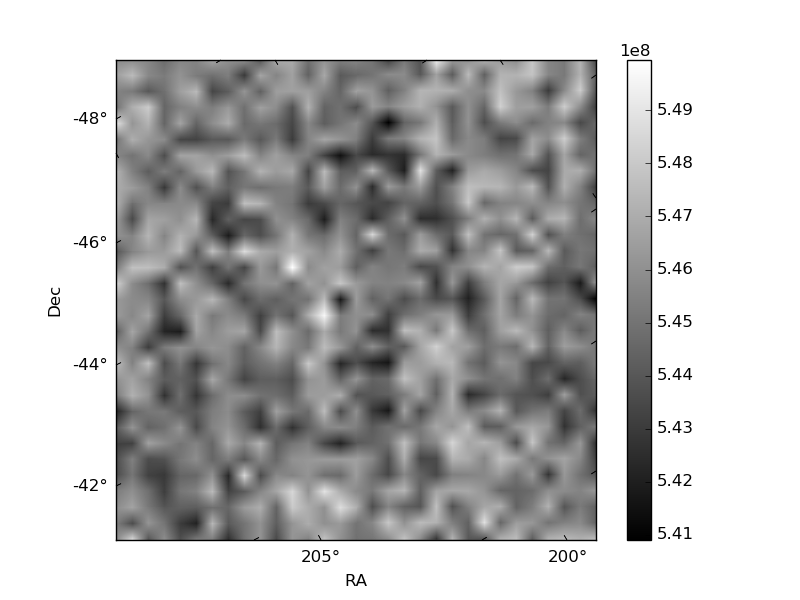
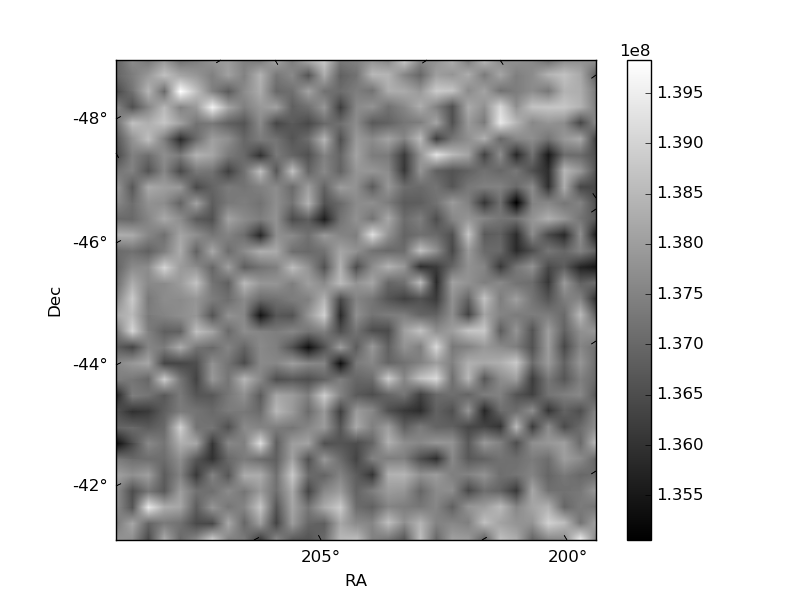
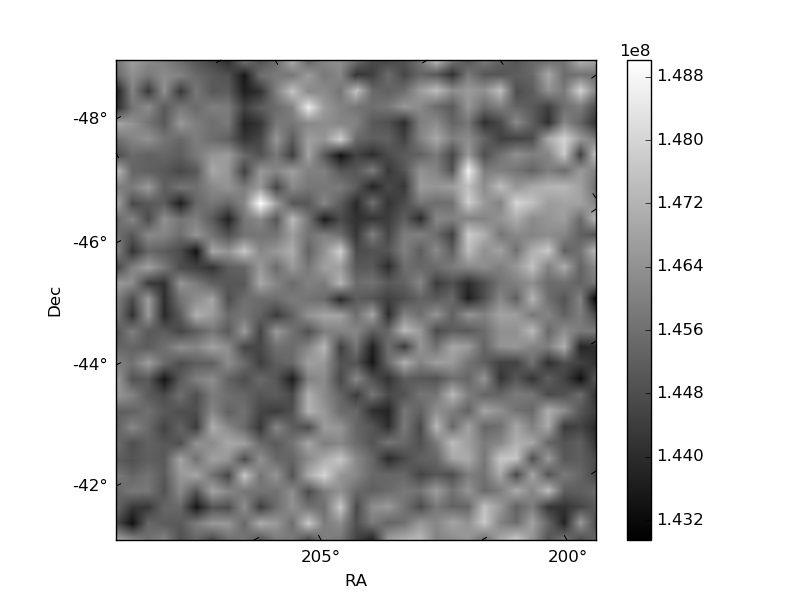
Histogram calculated using DETX and DETY for each event in the final _common_clean file
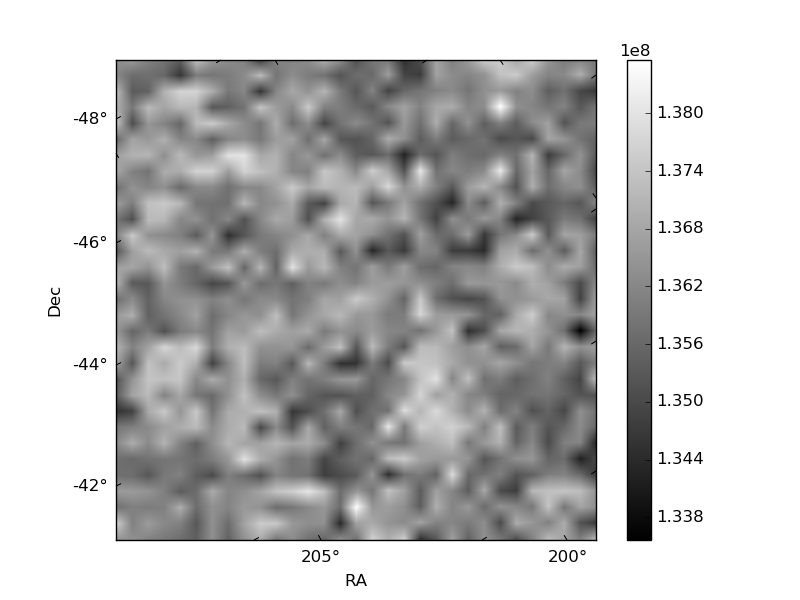
| Quadrant A | 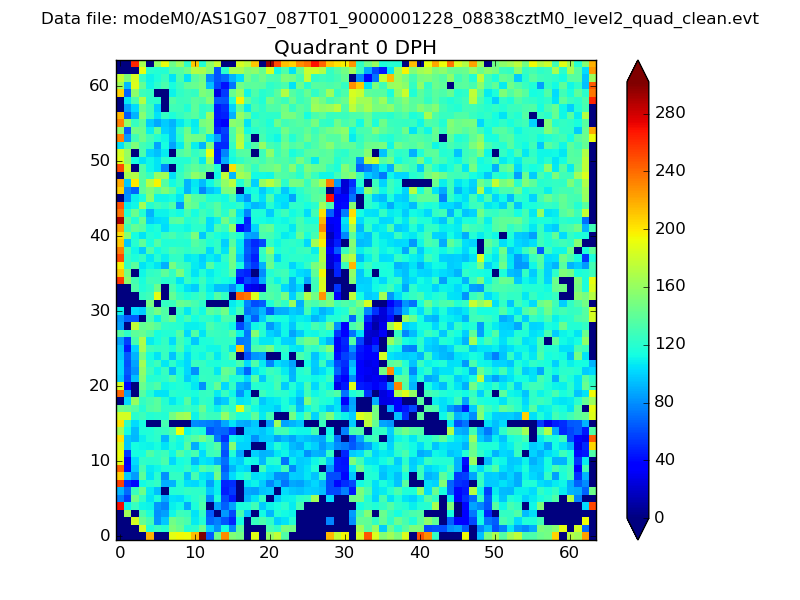 |
 |
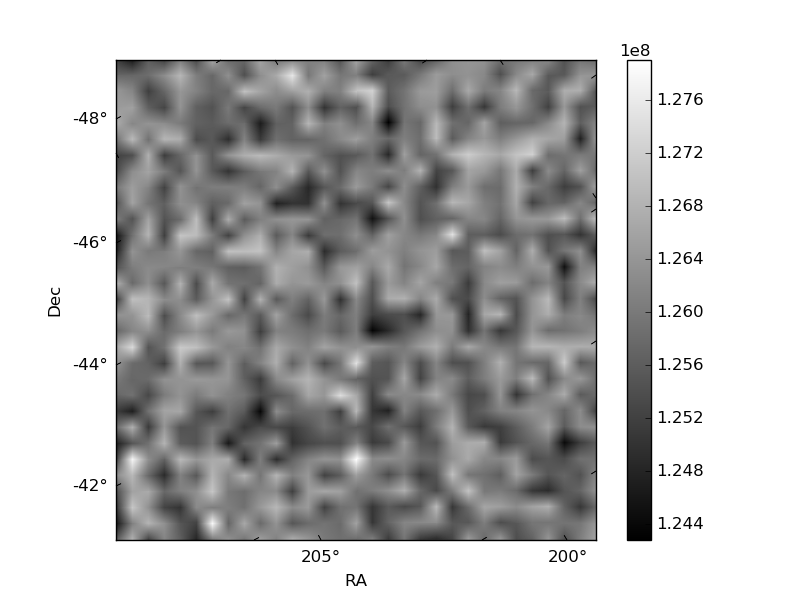
Quadrant B |
|---|---|---|---|
| Quadrant D | 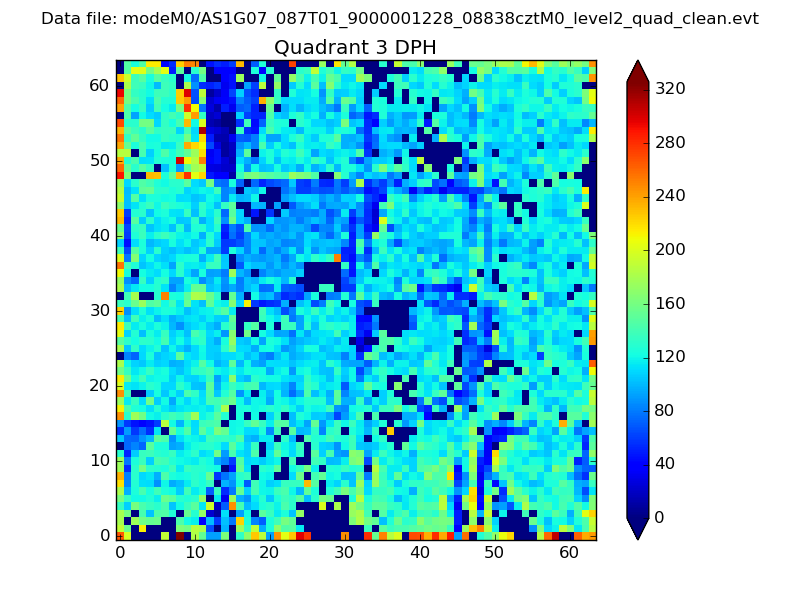 |
 |
Quadrant C |
| Plot type | Count rate plots | Images |
|---|---|---|
| Comparison with Poisson distribution Blue bars denote a histogram of data divided into 1 sec bins. Red curve is a Poisson curve with rate = median count rate of data. |
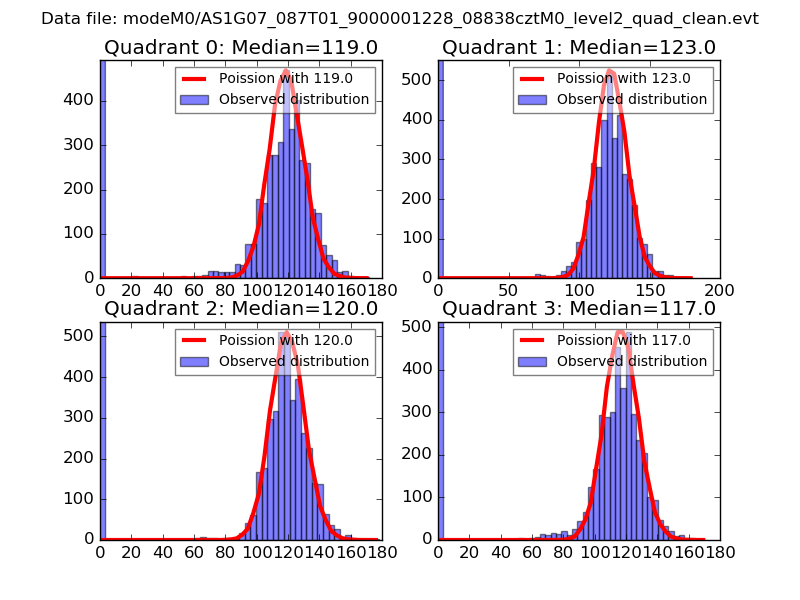 |
 |
| Quadrant-wise count rates Data is divided into 100 sec bins |
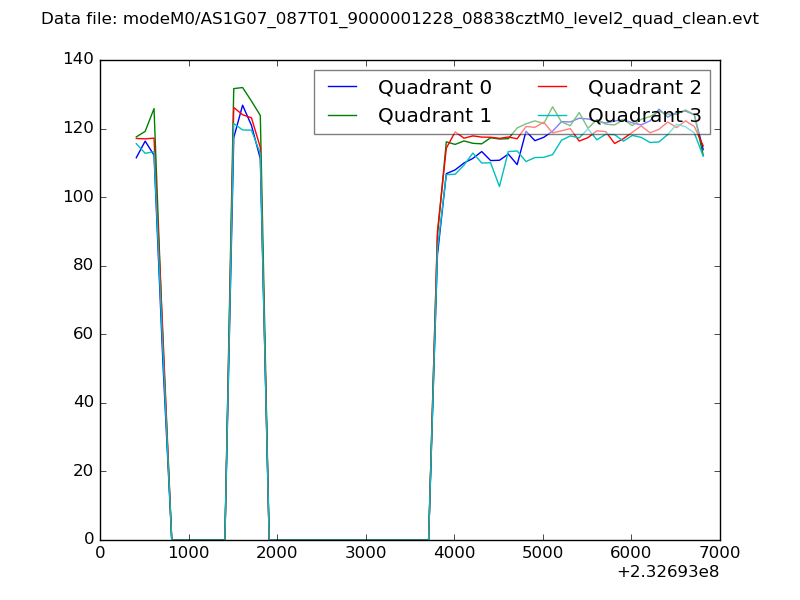 |
|
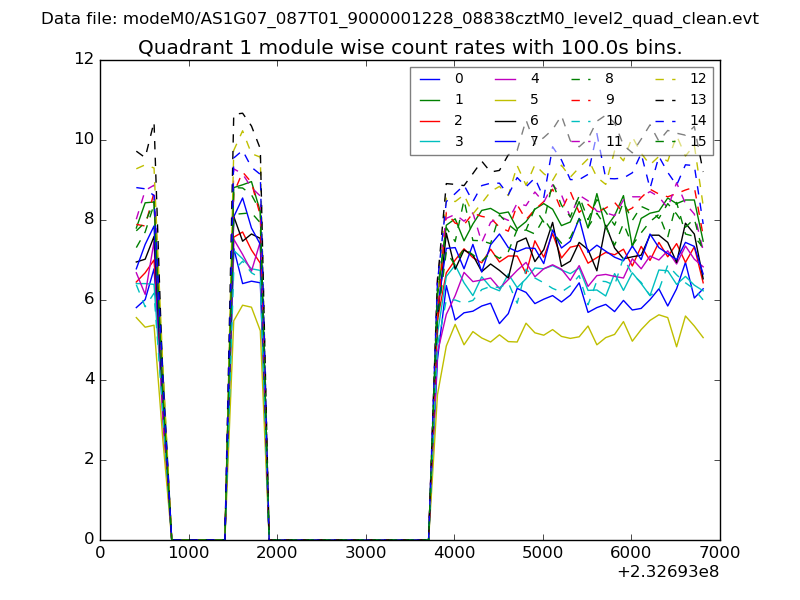
| Module-wise count rates for Quadrant A Data is divided into 100 sec bins |
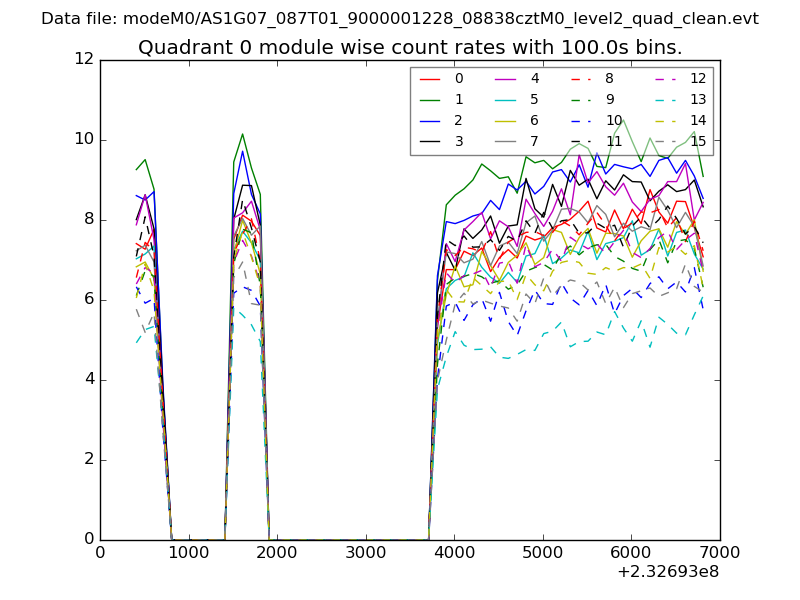 |
 |
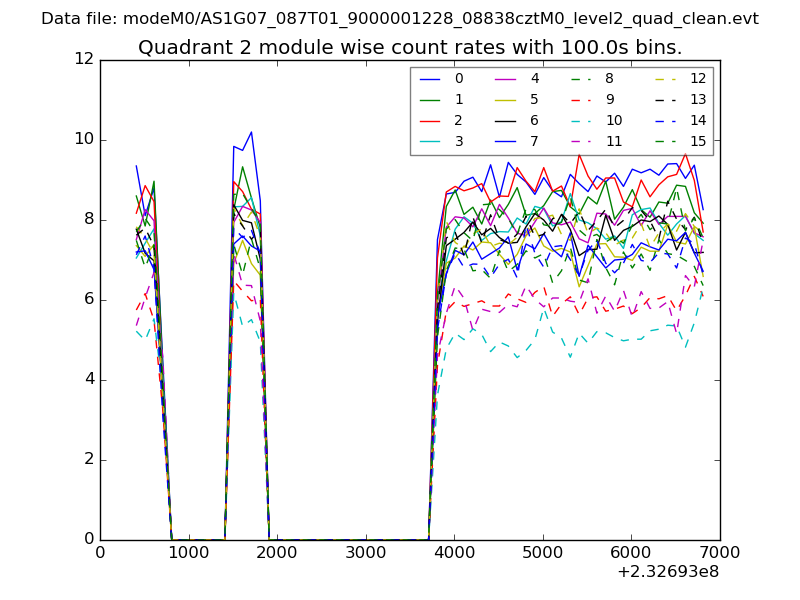
| Module-wise count rates for Quadrant B Data is divided into 100 sec bins |
 |
 |
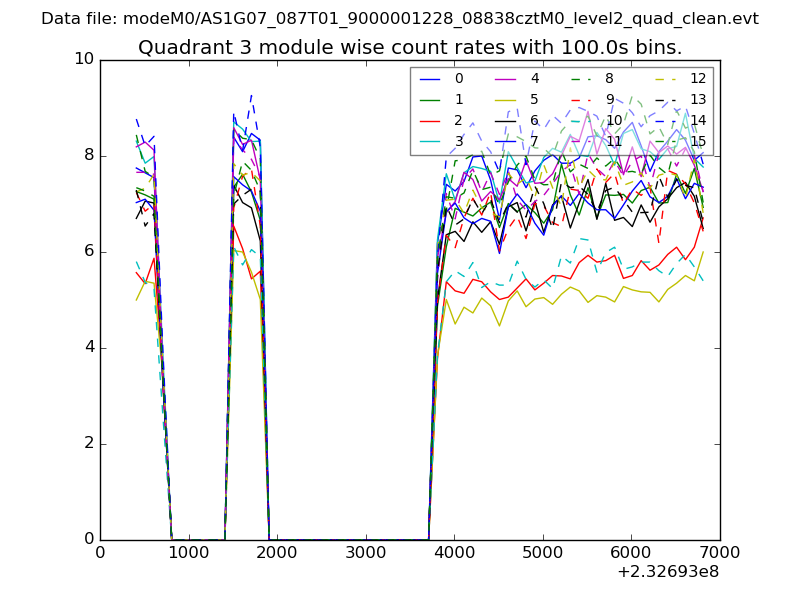
| Module-wise count rates for Quadrant C Data is divided into 100 sec bins |
 |
 |
| Module-wise count rates for Quadrant D Data is divided into 100 sec bins |
 |
 |
| Parameter | Plot |
|---|---|
| CZT HV Monitor | 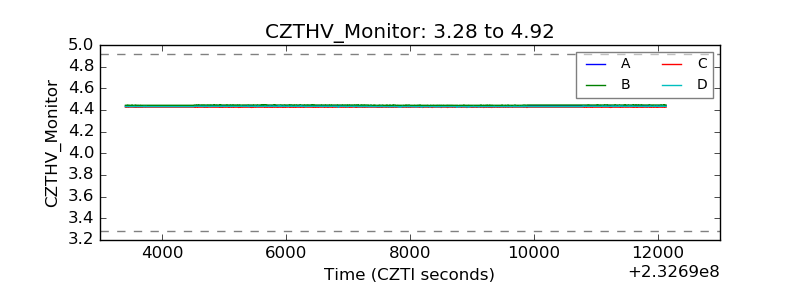 |
| D_VDD | 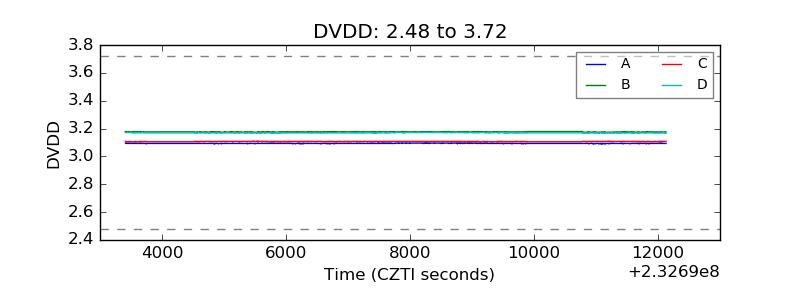 |
| Temperature 1 | 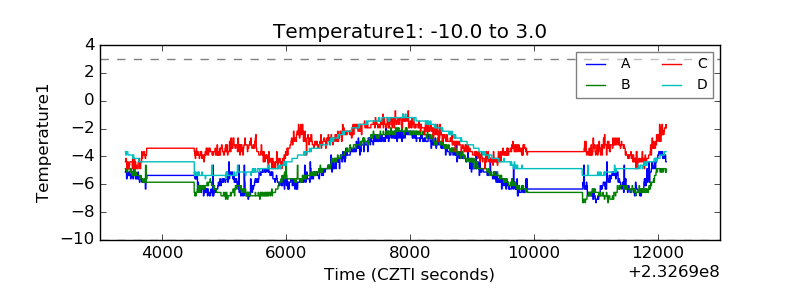 |
| Veto HV Monitor | 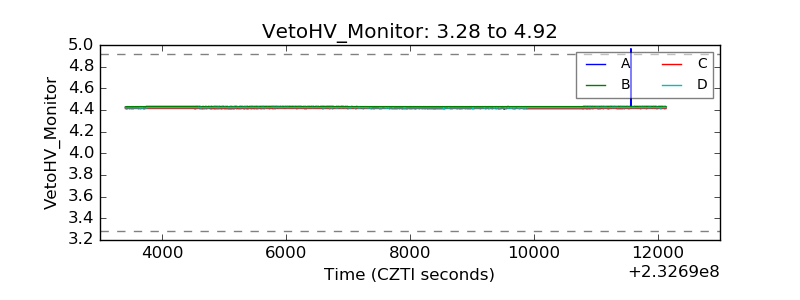 |
| Veto LLD | 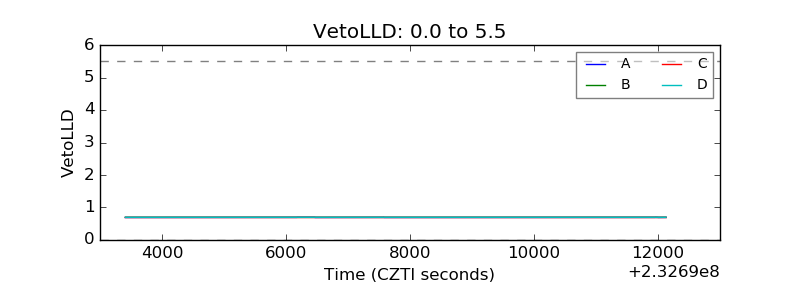 |
| Alpha Counter | 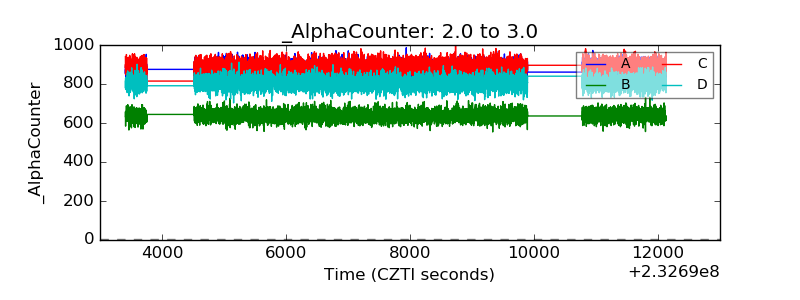 |
| _CPM_Rate | 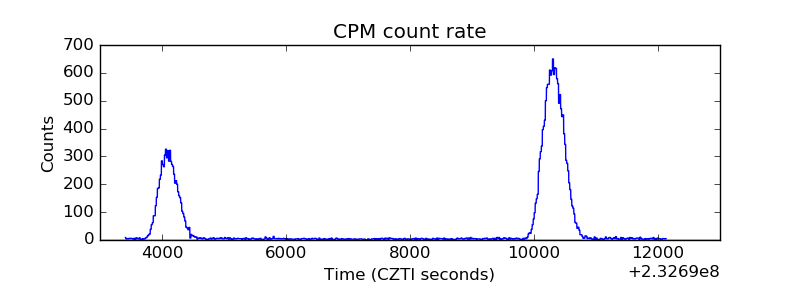 |
| CZT Counter | 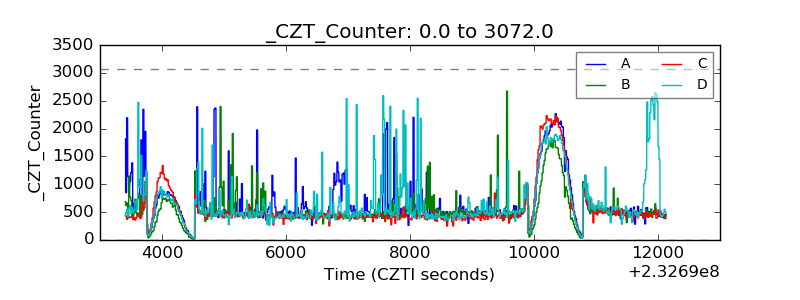 |
| +2.5 Volts monitor |  |
| +5 Volts monitor |  |
| _ROLL_ROT | 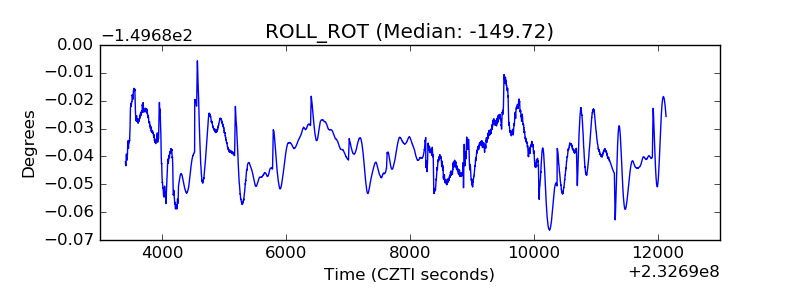 |
| _Roll_DEC | 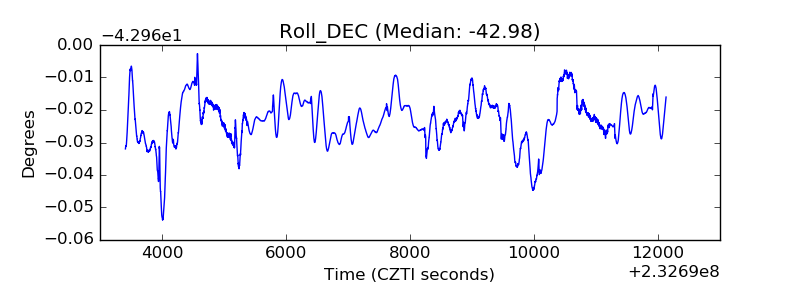 |
| _Roll_RA | 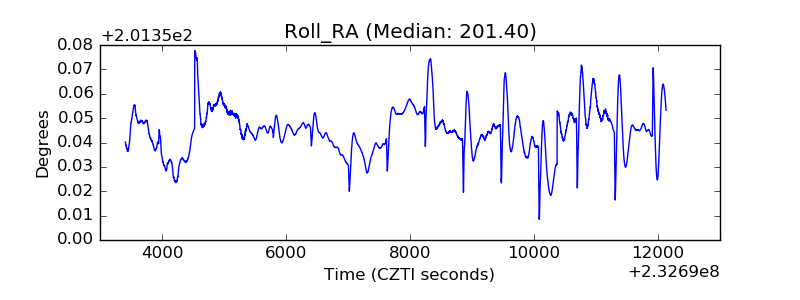 |
| Veto Counter | 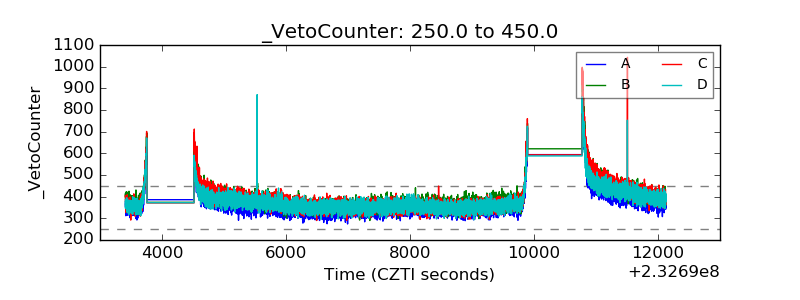 |