| Param | Original file | Final file |
|---|---|---|
| Filename | modeM0/AS1G07_087T01_9000001228_08839cztM0_level2.evt | modeM0/AS1G07_087T01_9000001228_08839cztM0_level2_quad_clean.evt |
| Size (bytes) | 522,961,920 | 67,812,480 |
| Size | 498.7 MB | 64.7 MB |
| Events in quadrant A | 3,351,499 | 407,583 |
| Events in quadrant B | 4,461,484 | 388,492 |
| Events in quadrant C | 3,087,716 | 401,656 |
| Events in quadrant D | 4,482,982 | 388,642 |
| Mode M0 | |||
|---|---|---|---|
| Quadrant | BADHDUFLAG | Total packets | Discarded packets |
| A | 0 | 14270 | 17 |
| B | 0 | 17543 | 8 |
| C | 0 | 13768 | 8 |
| D | 0 | 17602 | 21 |
| Mode M9 | |||
|---|---|---|---|
| Quadrant | BADHDUFLAG | Total packets | Discarded packets |
| A | 0 | 14 | 0 |
| B | 0 | 14 | 0 |
| C | 0 | 14 | 0 |
| D | 0 | 15 | 0 |
| Mode SS | |||
|---|---|---|---|
| Quadrant | BADHDUFLAG | Total packets | Discarded packets |
| A | 0 | 138 | 0 |
| B | 0 | 138 | 0 |
| C | 0 | 138 | 0 |
| D | 0 | 138 | 0 |
| Quadrant | Total seconds | Saturated seconds | Saturation percentage |
|---|---|---|---|
| A | 6683 | 80 | 1.197067% |
| B | 6686 | 464 | 6.939874% |
| C | 6686 | 68 | 1.017051% |
| D | 6684 | 294 | 4.398564% |
Noise dominated data is calculated using 1-second bins in cleaned event files. If a bin has >2000 counts, and if more than 50% of those come from <1% of pixels, then it is considered to be noise-dominated and hence unusable.
| Quadrant | # 1 sec bins | Bins with >0 counts | Bins with >2000 counts | High rate bins dominated by noise | Noise dominated (total time) | Noise dominated (detector-on time) | Marked lightcurve |
|---|---|---|---|---|---|---|---|
| A | 7734 | 6688 | 1 | 1 | 0.01% | 0.01% | 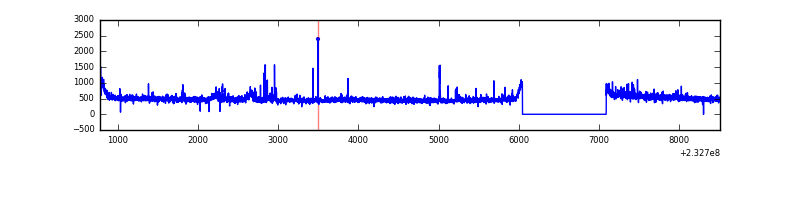 |
| B | 7733 | 6688 | 312 | 312 | 4.03% | 4.67% | 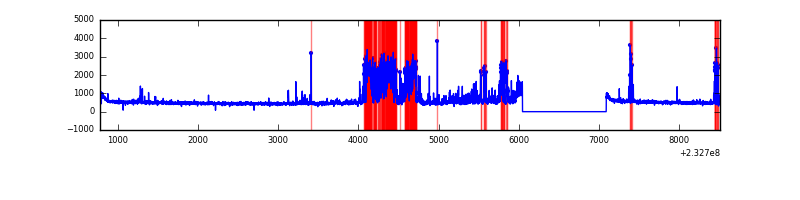 |
| C | 7734 | 6689 | 0 | 0 | 0.00% | 0.00% | 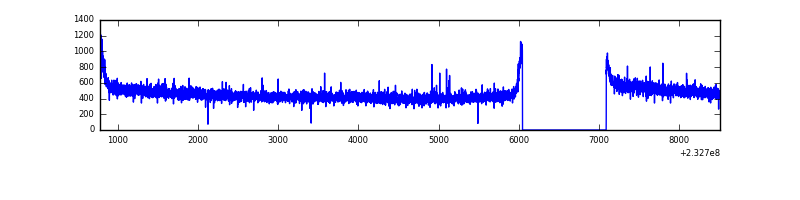 |
| D | 7734 | 6688 | 215 | 215 | 2.78% | 3.21% | 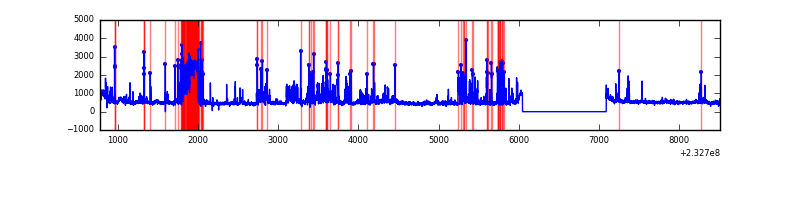 |
Top three noisy pixels from each quadrant. If the there are fewer than three noisy pixels in the level2.evt file, extra rows are filled as -1
| Pixel properties | Quadrant properties | ||||||
|---|---|---|---|---|---|---|---|
| Quadrant | DetID | PixID | Counts | Sigma | Mean | Median | Sigma |
| A | 8 | 5 | 126471 | 766.1 | 810 | 793 | 164.0 |
| A | 15 | 174 | 58531 | 351.96 | 810 | 793 | 164.0 |
| A | 13 | 248 | 15162 | 87.59 | 810 | 793 | 164.0 |
| B | 4 | 48 | 1216755 | 8045.32 | 797 | 779 | 151.1 |
| B | 4 | 80 | 71952 | 470.91 | 797 | 779 | 151.1 |
| B | 0 | 214 | 31140 | 200.88 | 797 | 779 | 151.1 |
| C | 13 | 61 | 6015 | 28.4 | 789 | 793 | 183.9 |
| C | 12 | 4 | 5056 | 23.18 | 789 | 793 | 183.9 |
| C | 1 | 16 | 4401 | 19.62 | 789 | 793 | 183.9 |
| D | 1 | 52 | 705149 | 3797.58 | 774 | 755 | 185.5 |
| D | 2 | 14 | 531768 | 2862.84 | 774 | 755 | 185.5 |
| D | 8 | 195 | 206423 | 1108.81 | 774 | 755 | 185.5 |
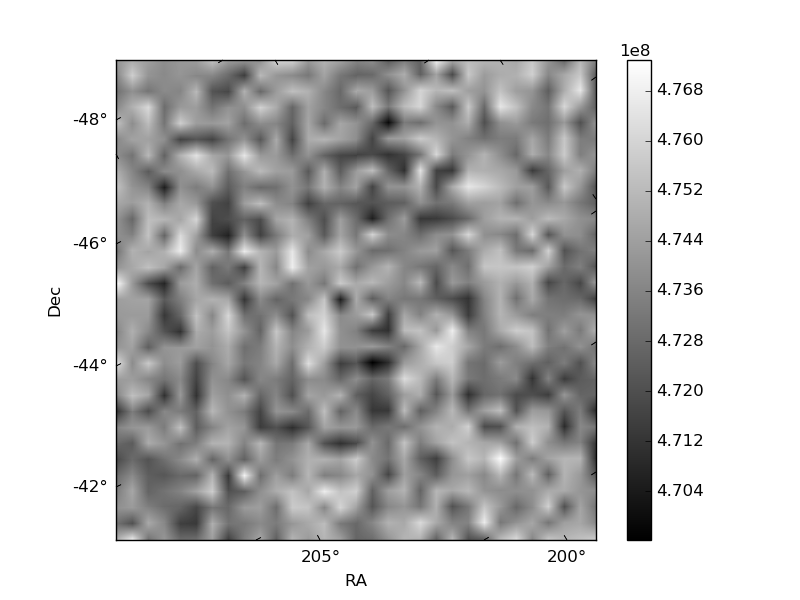
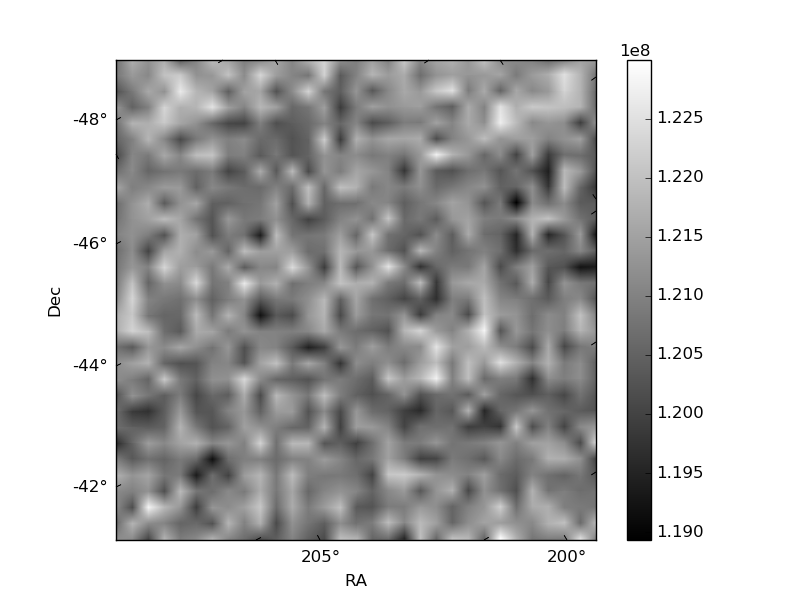
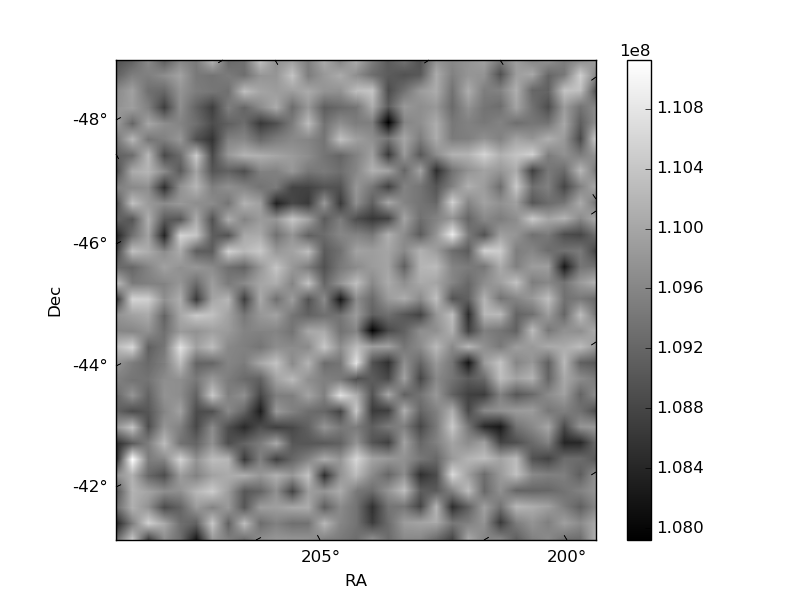
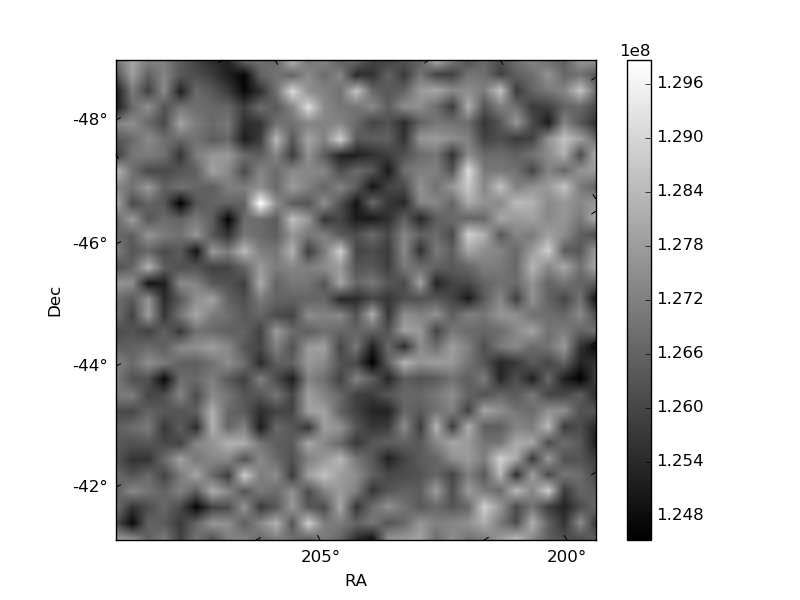
Histogram calculated using DETX and DETY for each event in the final _common_clean file
| Quadrant A | 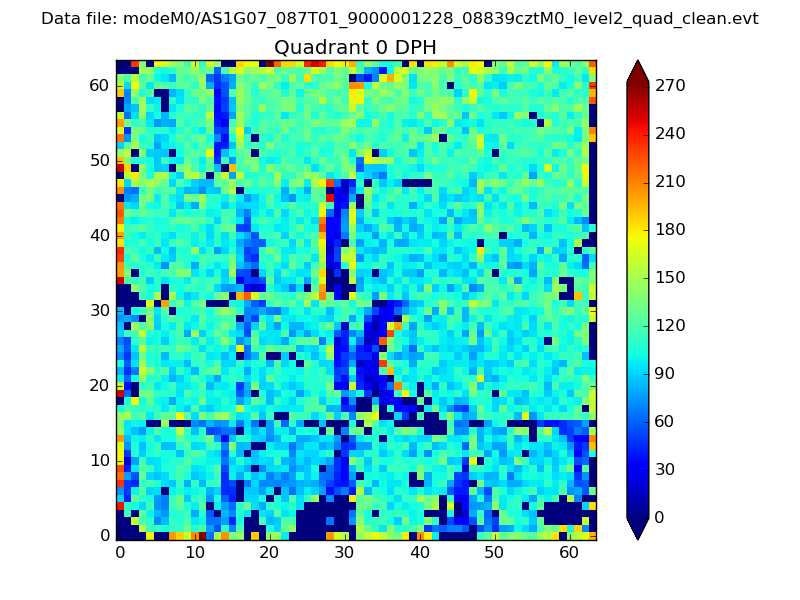 |
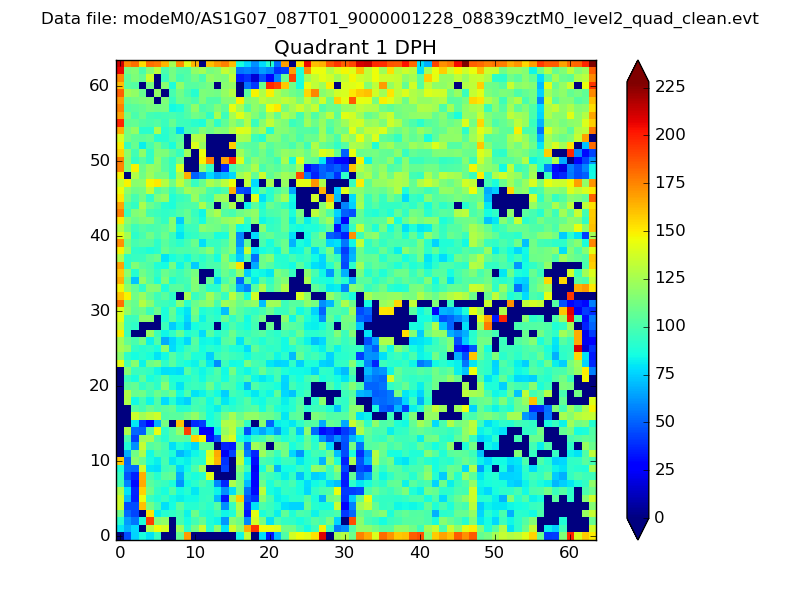 |
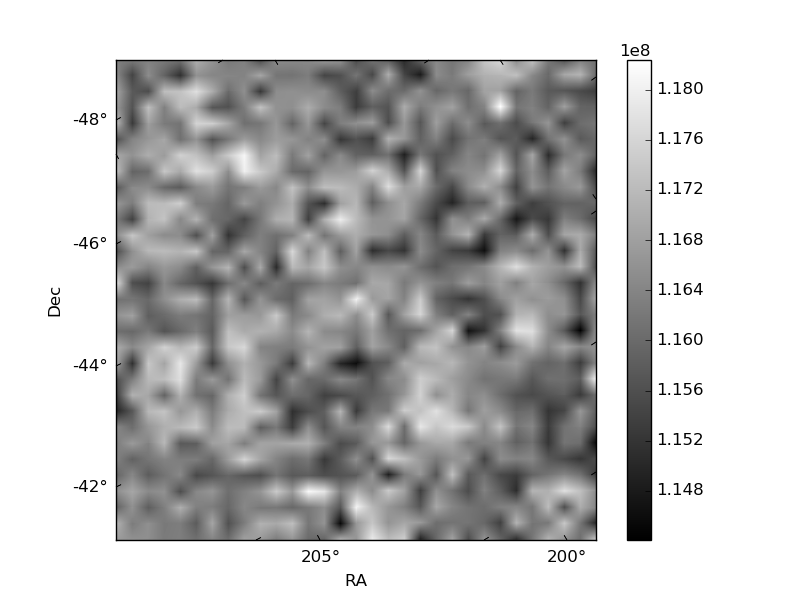
Quadrant B |
|---|---|---|---|
| Quadrant D | 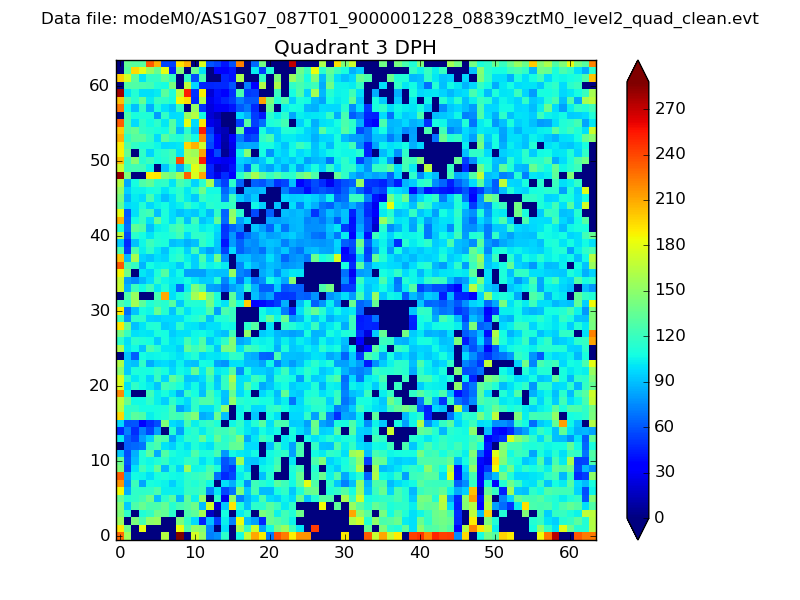 |
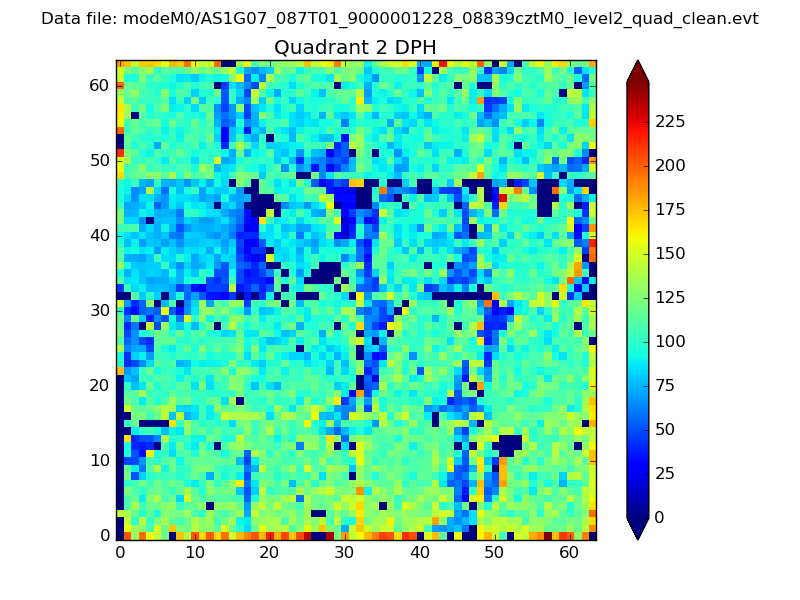 |
Quadrant C |
| Plot type | Count rate plots | Images |
|---|---|---|
| Comparison with Poisson distribution Blue bars denote a histogram of data divided into 1 sec bins. Red curve is a Poisson curve with rate = median count rate of data. |
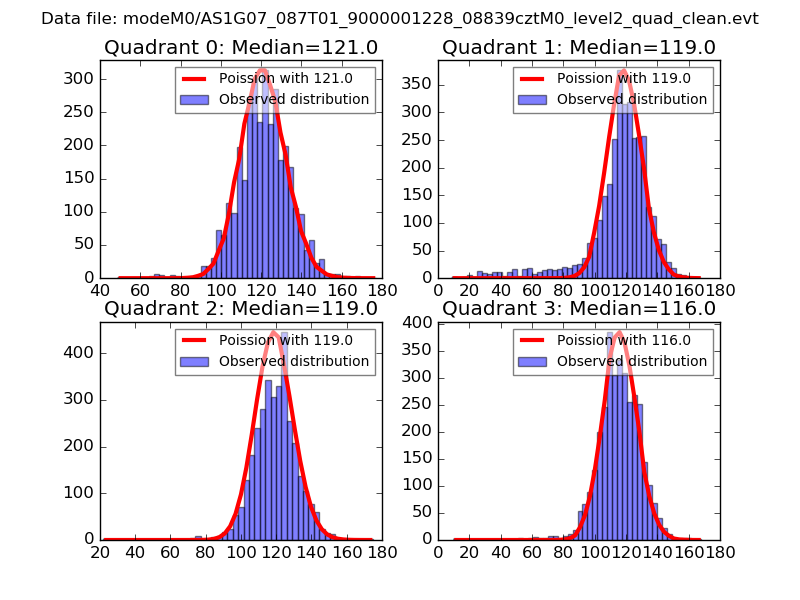 |
 |
| Quadrant-wise count rates Data is divided into 100 sec bins |
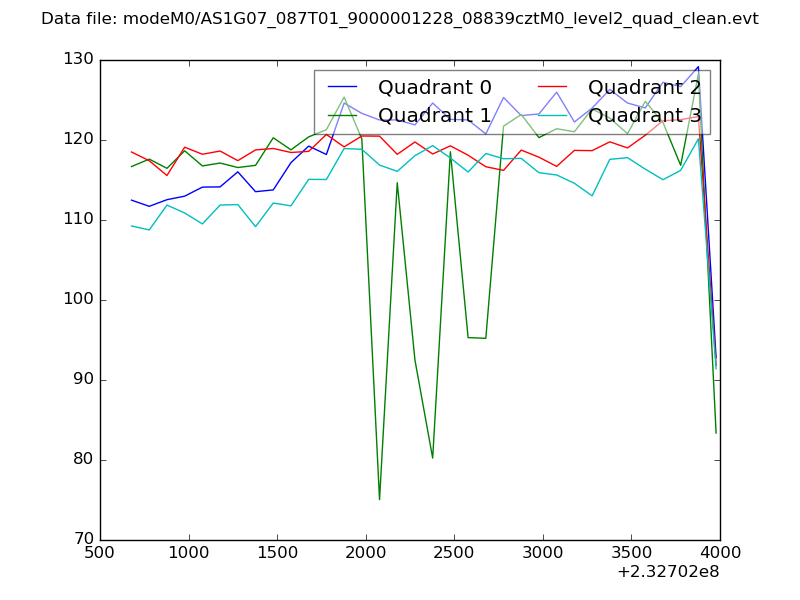 |
|
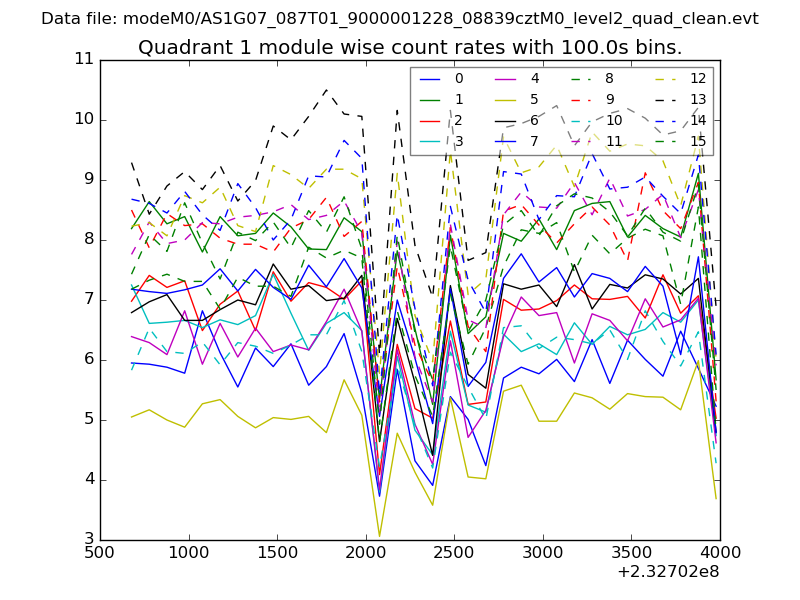
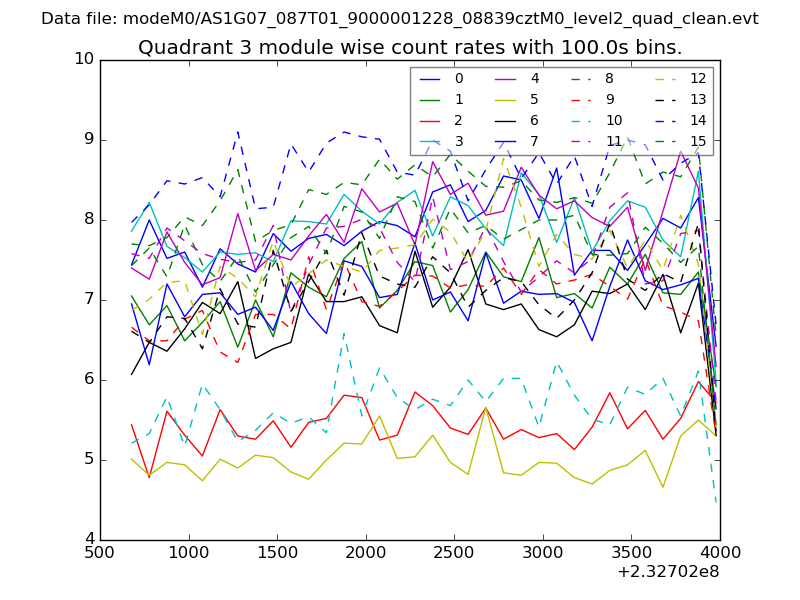
| Module-wise count rates for Quadrant A Data is divided into 100 sec bins |
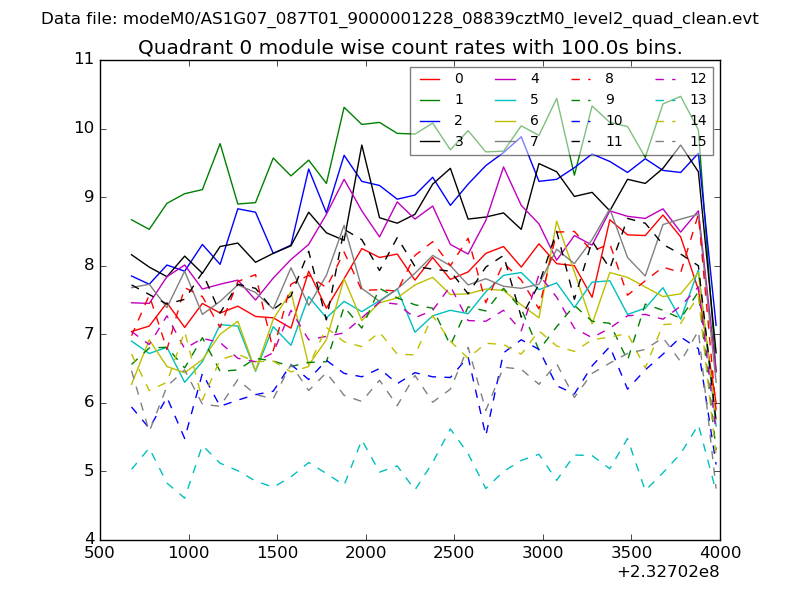 |
 |
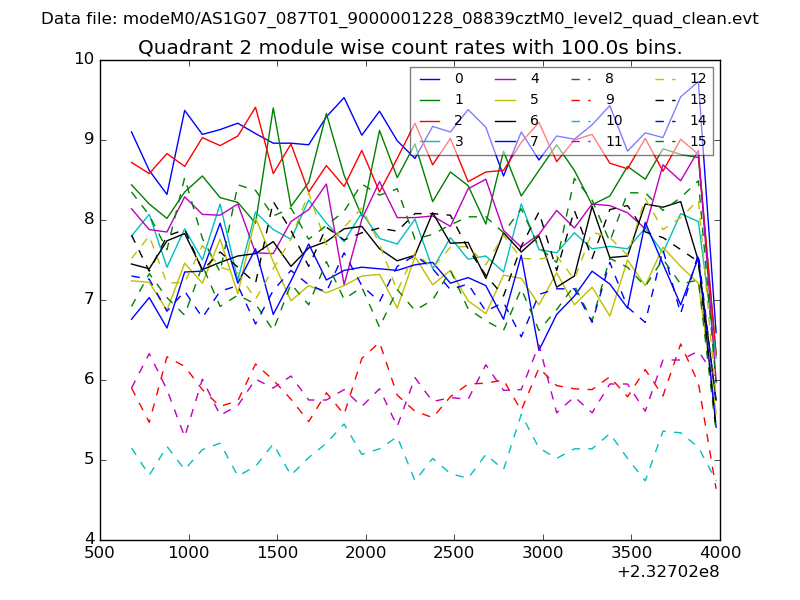
| Module-wise count rates for Quadrant B Data is divided into 100 sec bins |
 |
 |
| Module-wise count rates for Quadrant C Data is divided into 100 sec bins |
 |
 |
| Module-wise count rates for Quadrant D Data is divided into 100 sec bins |
 |
 |
| Parameter | Plot |
|---|---|
| CZT HV Monitor | 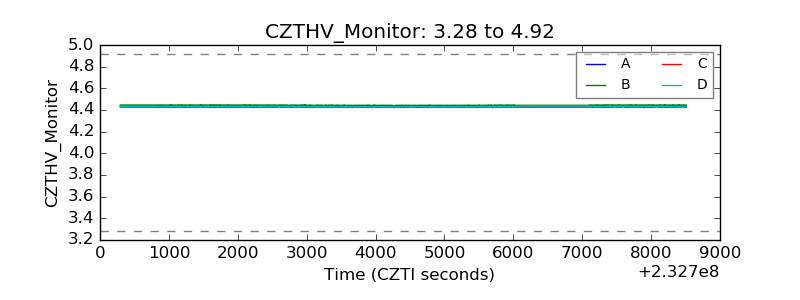 |
| D_VDD | 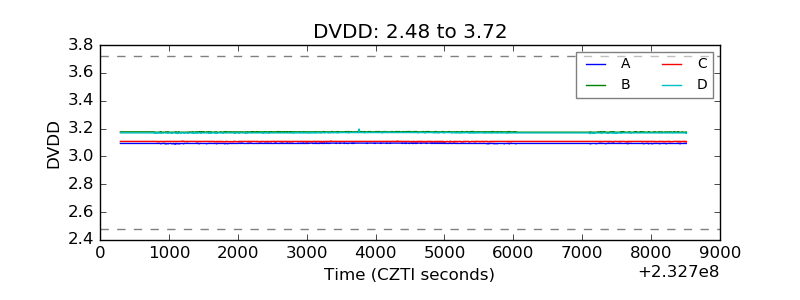 |
| Temperature 1 | 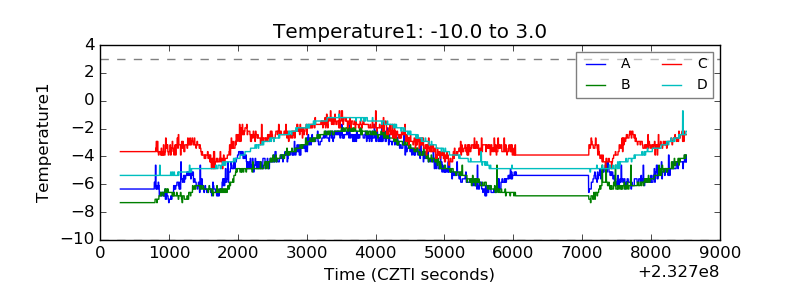 |
| Veto HV Monitor | 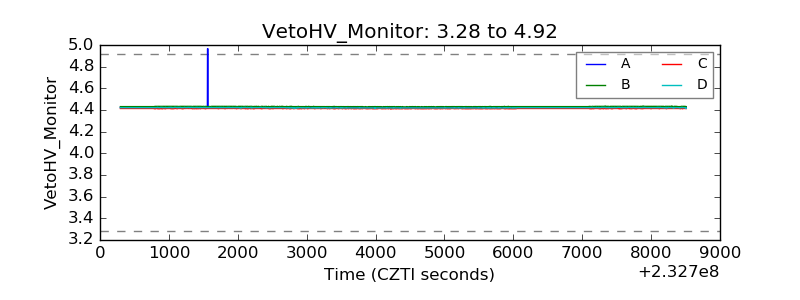 |
| Veto LLD | 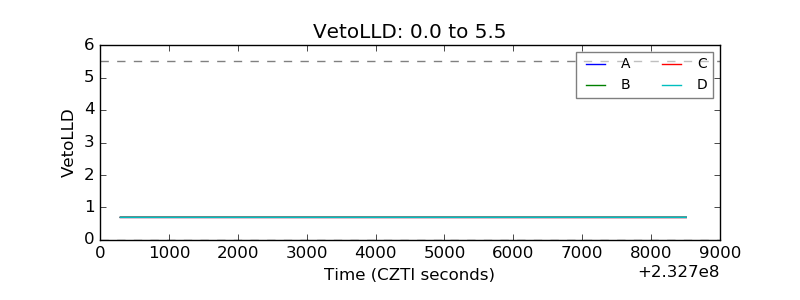 |
| Alpha Counter | 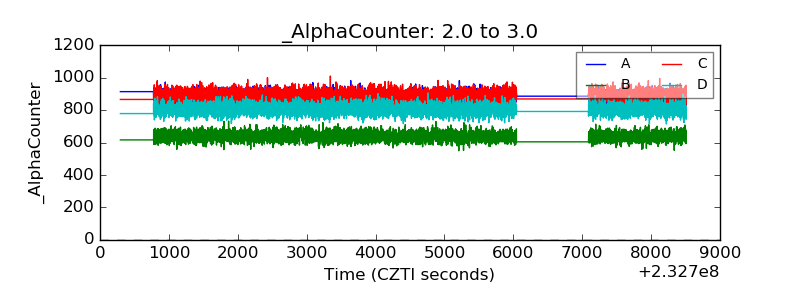 |
| _CPM_Rate | 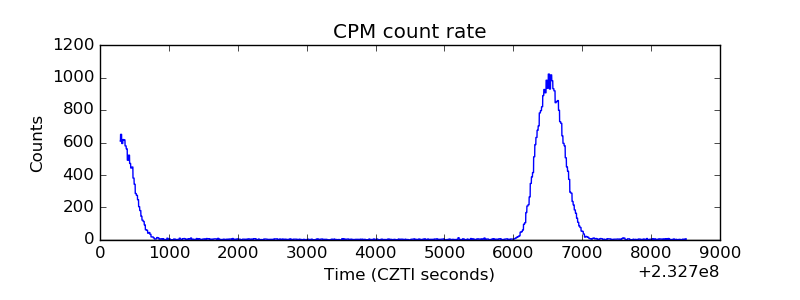 |
| CZT Counter | 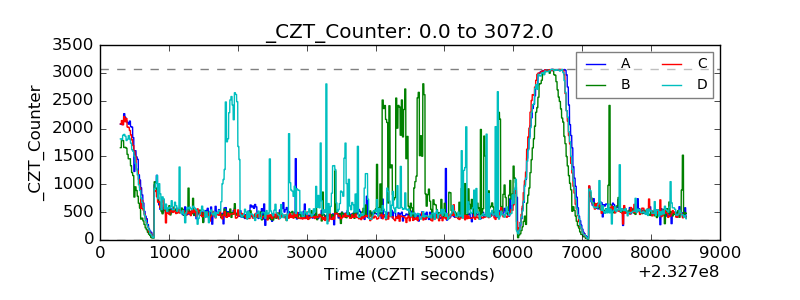 |
| +2.5 Volts monitor |  |
| +5 Volts monitor |  |
| _ROLL_ROT | 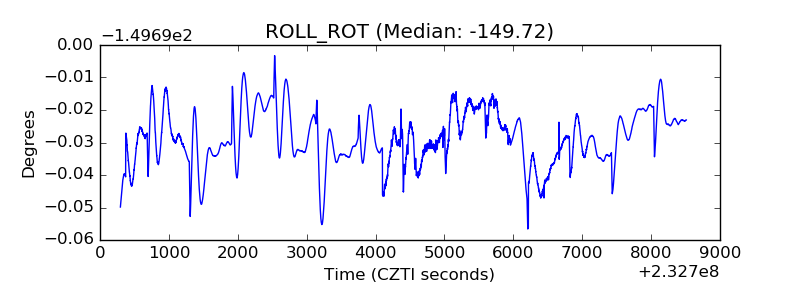 |
| _Roll_DEC | 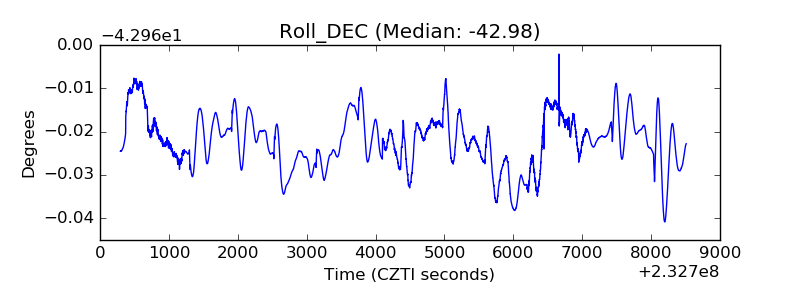 |
| _Roll_RA |  |
| Veto Counter | 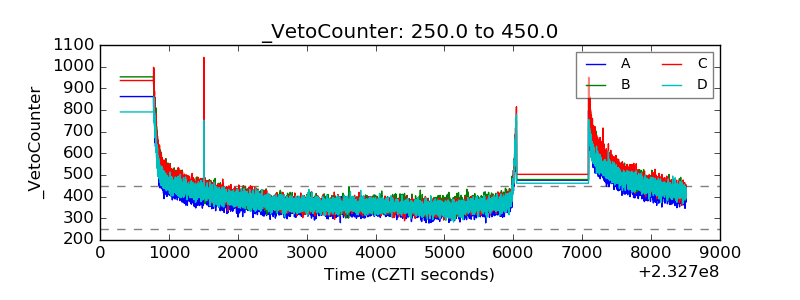 |