| Param | Original file | Final file |
|---|---|---|
| Filename | modeM0/AS1G07_087T01_9000001228_08841cztM0_level2.evt | modeM0/AS1G07_087T01_9000001228_08841cztM0_level2_quad_clean.evt |
| Size (bytes) | 449,481,600 | 80,648,640 |
| Size | 428.7 MB | 76.9 MB |
| Events in quadrant A | 3,383,320 | 502,124 |
| Events in quadrant B | 3,284,576 | 509,058 |
| Events in quadrant C | 3,044,217 | 497,175 |
| Events in quadrant D | 3,464,788 | 486,624 |
| Mode M0 | |||
|---|---|---|---|
| Quadrant | BADHDUFLAG | Total packets | Discarded packets |
| A | 0 | 14180 | 11 |
| B | 0 | 13839 | 6 |
| C | 0 | 13369 | 2 |
| D | 0 | 14211 | 8 |
| Mode M9 | |||
|---|---|---|---|
| Quadrant | BADHDUFLAG | Total packets | Discarded packets |
| A | 0 | 13 | 0 |
| B | 0 | 13 | 0 |
| C | 0 | 13 | 0 |
| D | 0 | 14 | 0 |
| Mode SS | |||
|---|---|---|---|
| Quadrant | BADHDUFLAG | Total packets | Discarded packets |
| A | 0 | 132 | 0 |
| B | 0 | 132 | 0 |
| C | 0 | 132 | 0 |
| D | 0 | 132 | 0 |
| Quadrant | Total seconds | Saturated seconds | Saturation percentage |
|---|---|---|---|
| A | 6402 | 90 | 1.405811% |
| B | 6404 | 116 | 1.811368% |
| C | 6406 | 65 | 1.014674% |
| D | 6404 | 83 | 1.296065% |
Noise dominated data is calculated using 1-second bins in cleaned event files. If a bin has >2000 counts, and if more than 50% of those come from <1% of pixels, then it is considered to be noise-dominated and hence unusable.
| Quadrant | # 1 sec bins | Bins with >0 counts | Bins with >2000 counts | High rate bins dominated by noise | Noise dominated (total time) | Noise dominated (detector-on time) | Marked lightcurve |
|---|---|---|---|---|---|---|---|
| A | 7582 | 6406 | 3 | 3 | 0.04% | 0.05% | 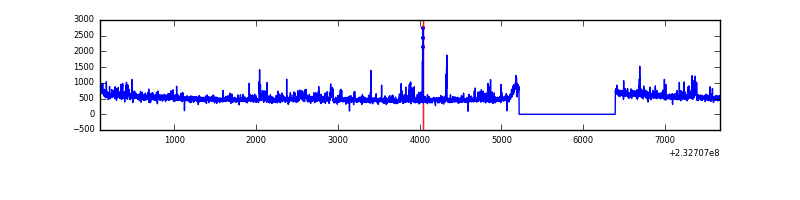 |
| B | 7582 | 6406 | 20 | 20 | 0.26% | 0.31% | 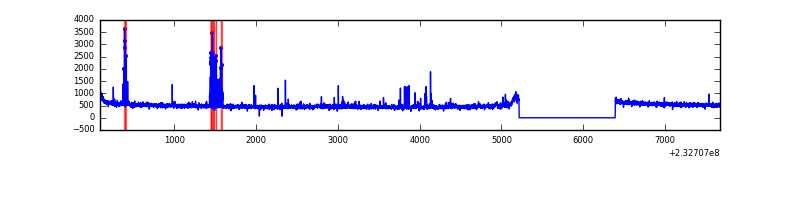 |
| C | 7582 | 6406 | 0 | 0 | 0.00% | 0.00% | 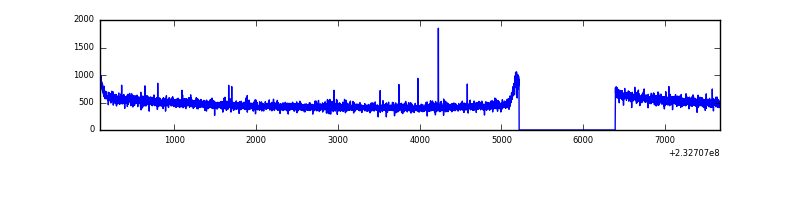 |
| D | 7582 | 6406 | 18 | 18 | 0.24% | 0.28% | 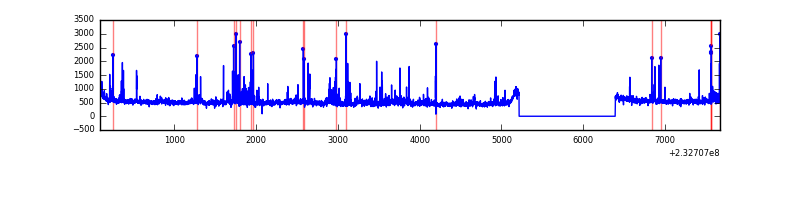 |
Top three noisy pixels from each quadrant. If the there are fewer than three noisy pixels in the level2.evt file, extra rows are filled as -1
| Pixel properties | Quadrant properties | ||||||
|---|---|---|---|---|---|---|---|
| Quadrant | DetID | PixID | Counts | Sigma | Mean | Median | Sigma |
| A | 8 | 5 | 195174 | 1222.48 | 802 | 788 | 159.0 |
| A | 13 | 164 | 50252 | 311.07 | 802 | 788 | 159.0 |
| A | 15 | 174 | 28301 | 173.03 | 802 | 788 | 159.0 |
| B | 4 | 80 | 95249 | 624.17 | 802 | 784 | 151.3 |
| B | 4 | 48 | 37062 | 239.7 | 802 | 784 | 151.3 |
| B | 5 | 255 | 21751 | 138.54 | 802 | 784 | 151.3 |
| C | 13 | 61 | 5955 | 28.83 | 778 | 783 | 179.4 |
| C | 12 | 4 | 5895 | 28.5 | 778 | 783 | 179.4 |
| C | 1 | 16 | 4882 | 22.85 | 778 | 783 | 179.4 |
| D | 1 | 52 | 225552 | 1210.5 | 775 | 754 | 185.7 |
| D | 8 | 195 | 193145 | 1035.99 | 775 | 754 | 185.7 |
| D | 2 | 14 | 34846 | 183.58 | 775 | 754 | 185.7 |
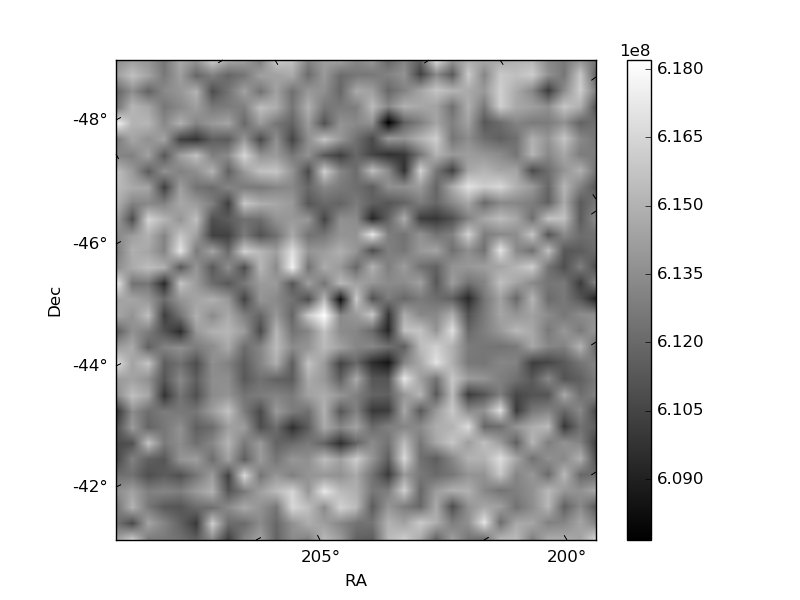
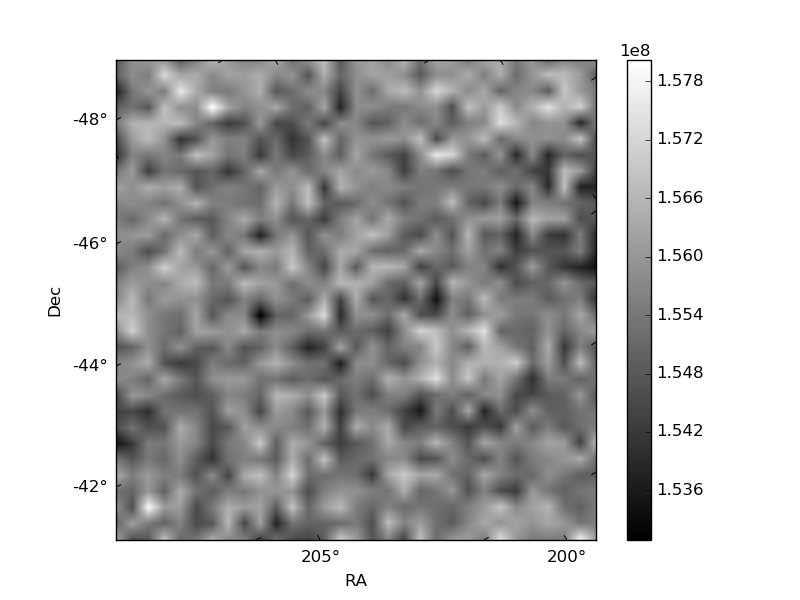
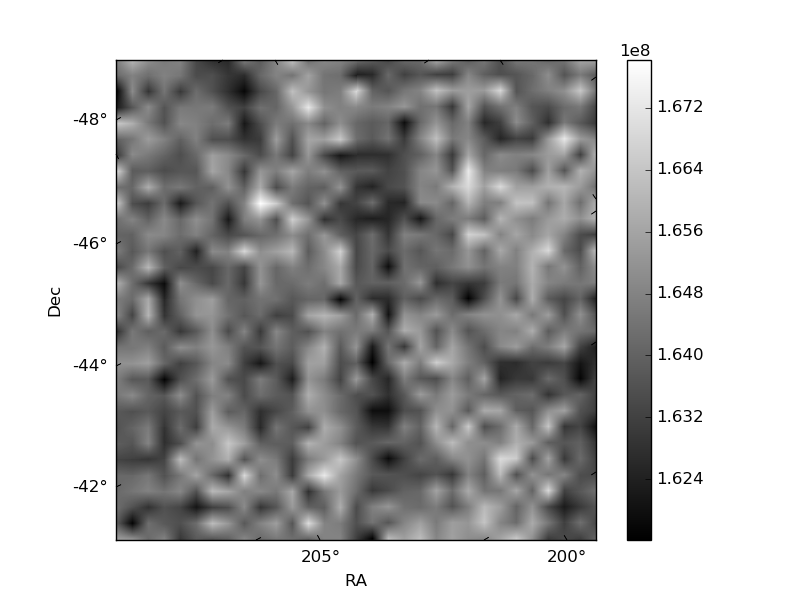
Histogram calculated using DETX and DETY for each event in the final _common_clean file
| Quadrant A | 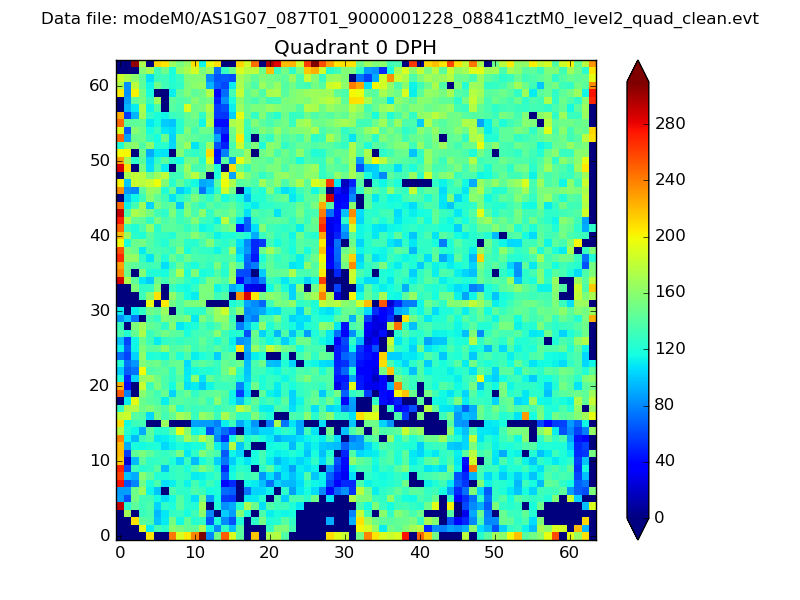 |
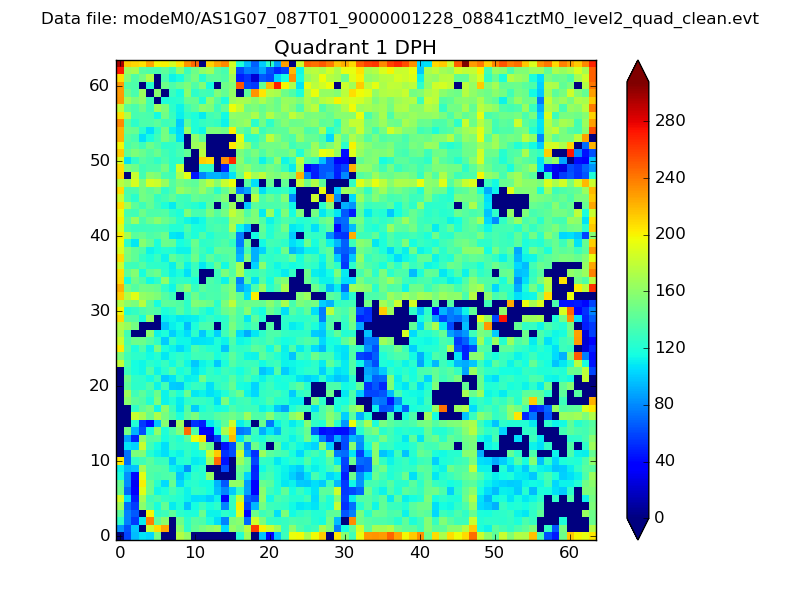 |
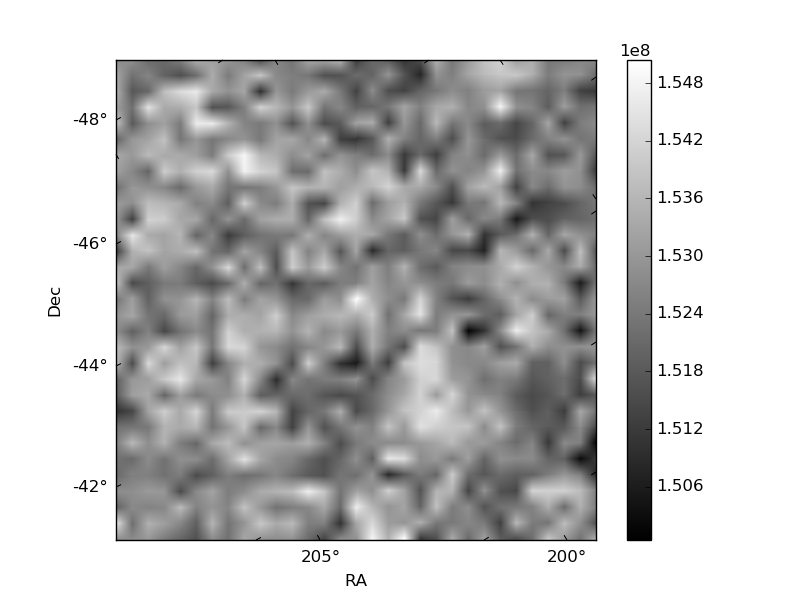
Quadrant B |
|---|---|---|---|
| Quadrant D | 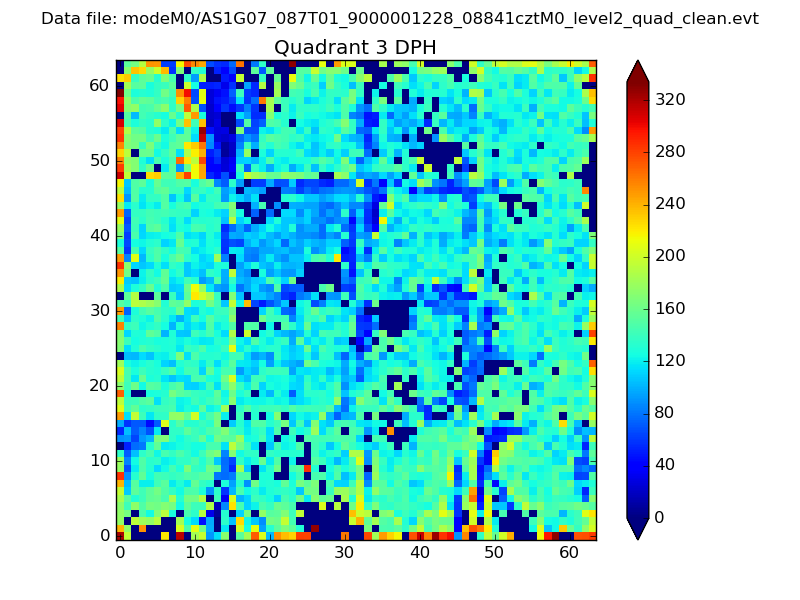 |
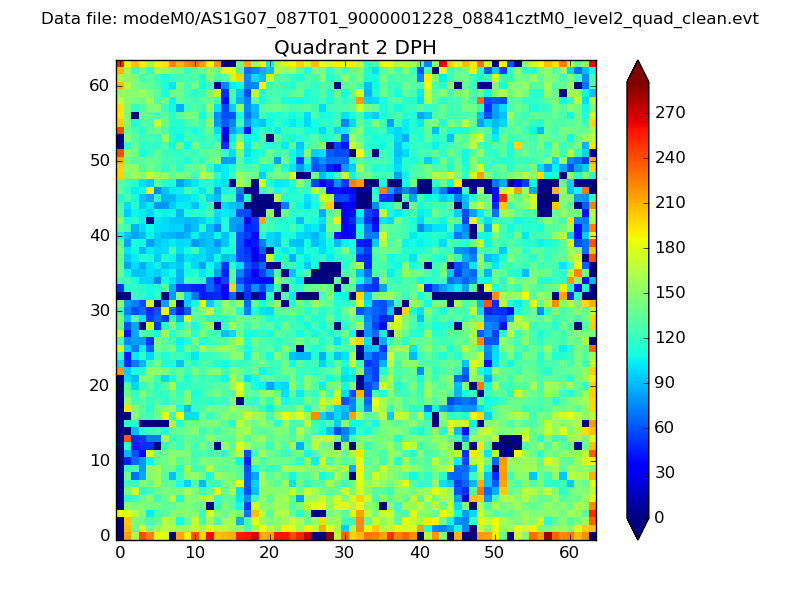 |
Quadrant C |
| Plot type | Count rate plots | Images |
|---|---|---|
| Comparison with Poisson distribution Blue bars denote a histogram of data divided into 1 sec bins. Red curve is a Poisson curve with rate = median count rate of data. |
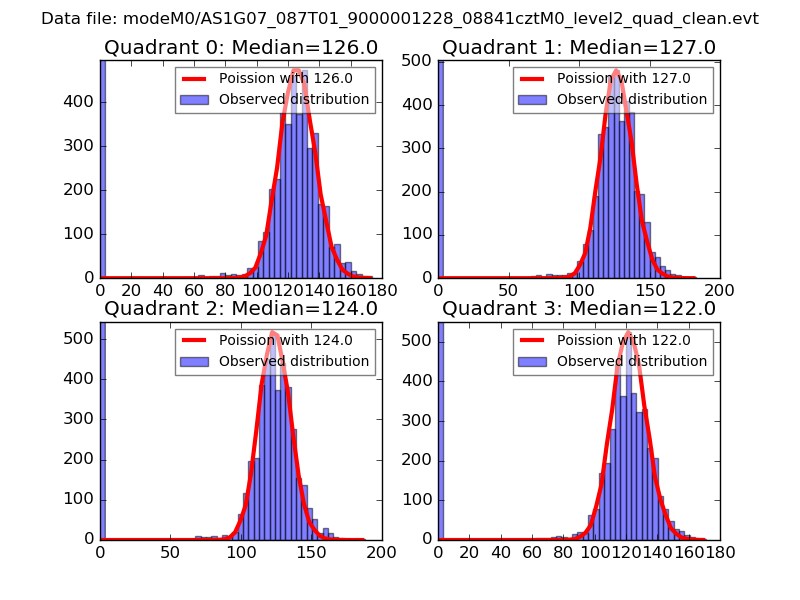 |
 |
| Quadrant-wise count rates Data is divided into 100 sec bins |
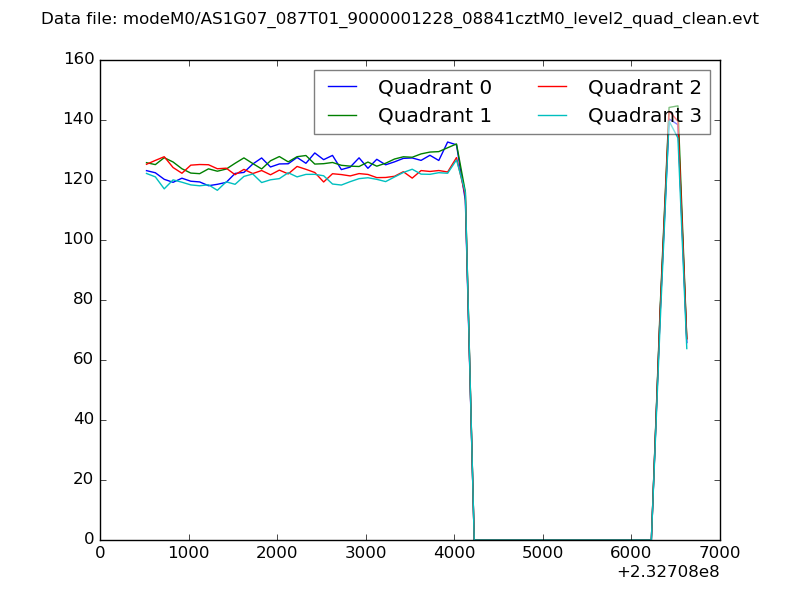 |
|
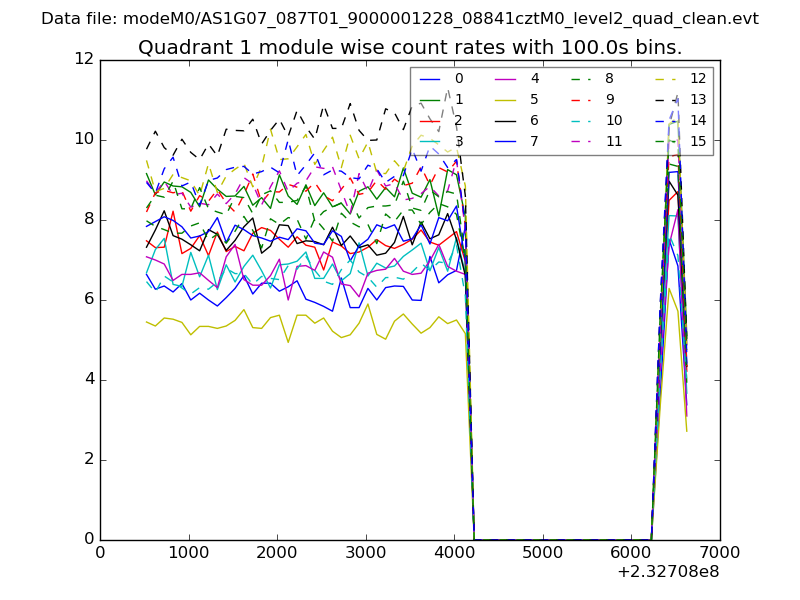
| Module-wise count rates for Quadrant A Data is divided into 100 sec bins |
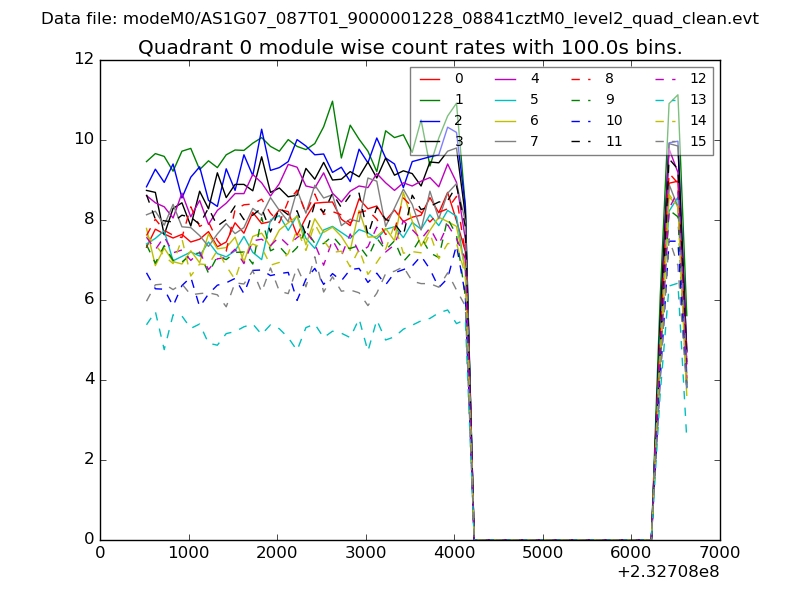 |
 |
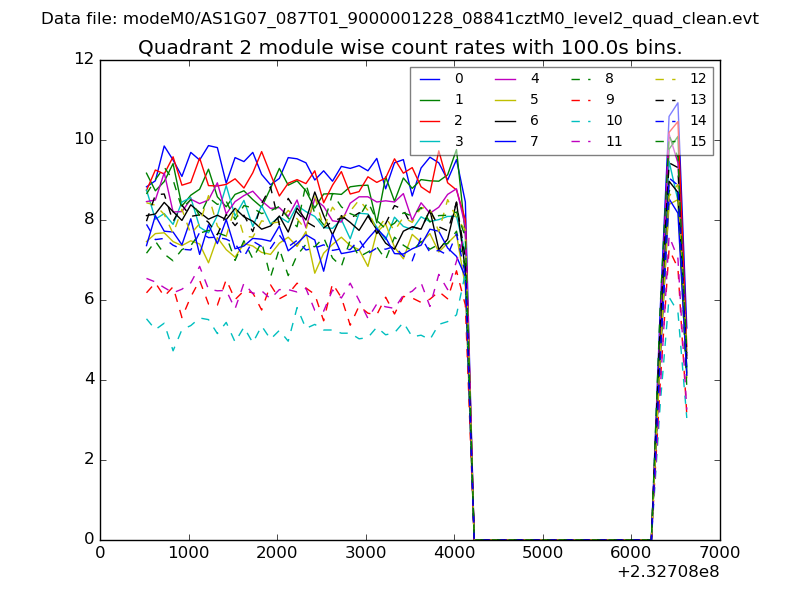
| Module-wise count rates for Quadrant B Data is divided into 100 sec bins |
 |
 |
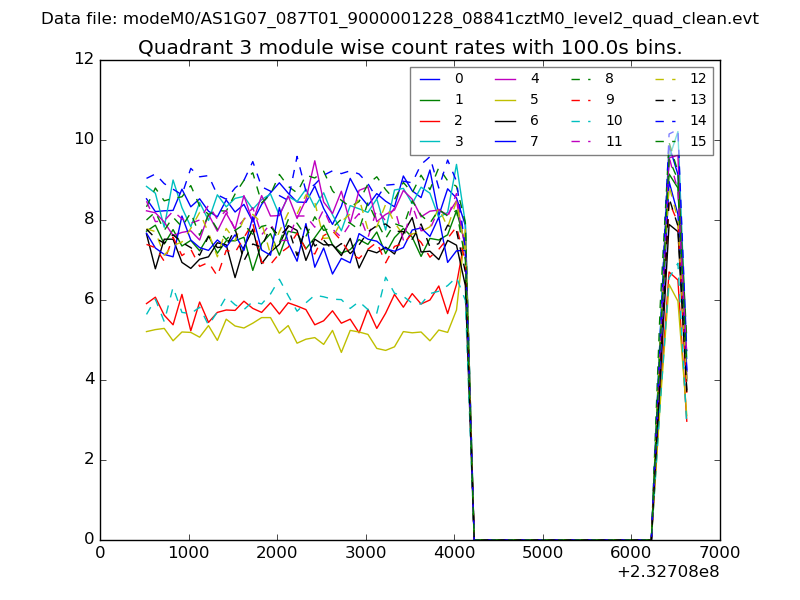
| Module-wise count rates for Quadrant C Data is divided into 100 sec bins |
 |
 |
| Module-wise count rates for Quadrant D Data is divided into 100 sec bins |
 |
 |
| Parameter | Plot |
|---|---|
| CZT HV Monitor | 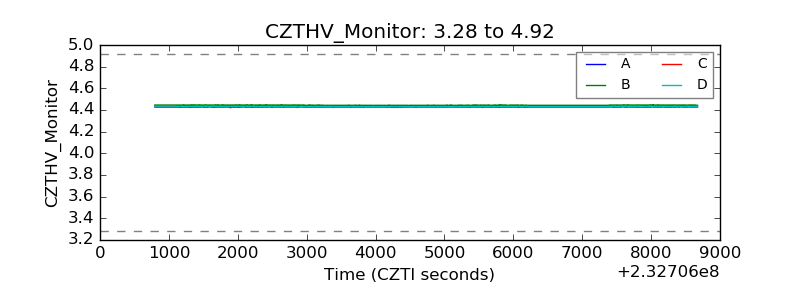 |
| D_VDD | 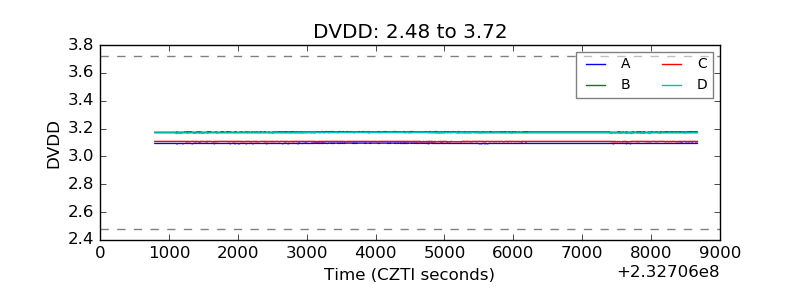 |
| Temperature 1 |  |
| Veto HV Monitor | 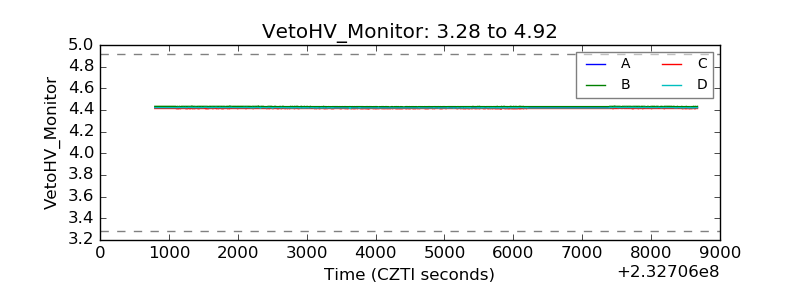 |
| Veto LLD |  |
| Alpha Counter | 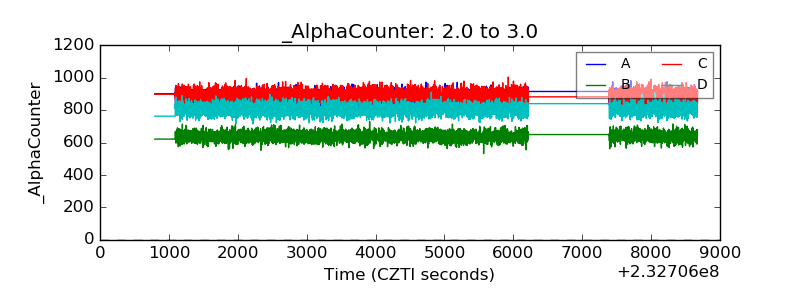 |
| _CPM_Rate | 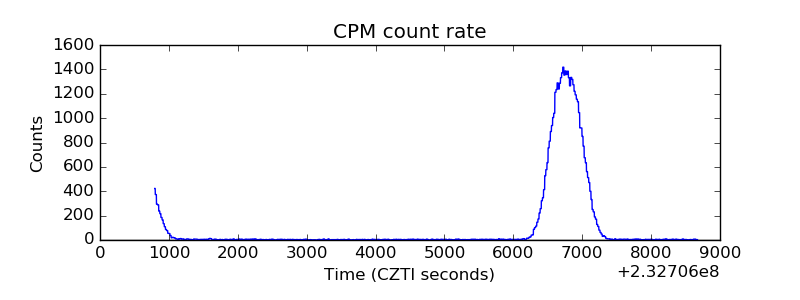 |
| CZT Counter | 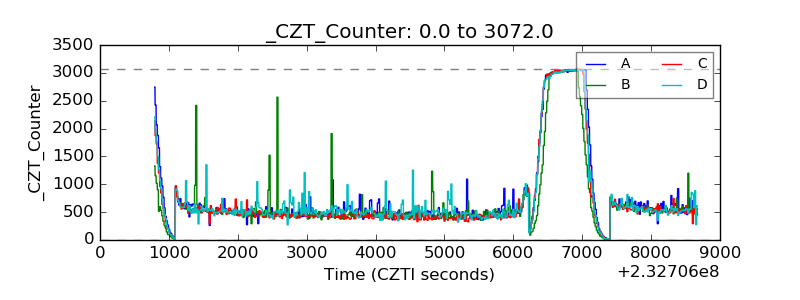 |
| +2.5 Volts monitor |  |
| +5 Volts monitor |  |
| _ROLL_ROT | 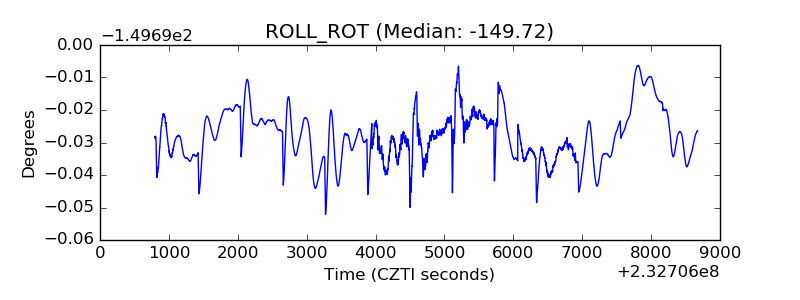 |
| _Roll_DEC | 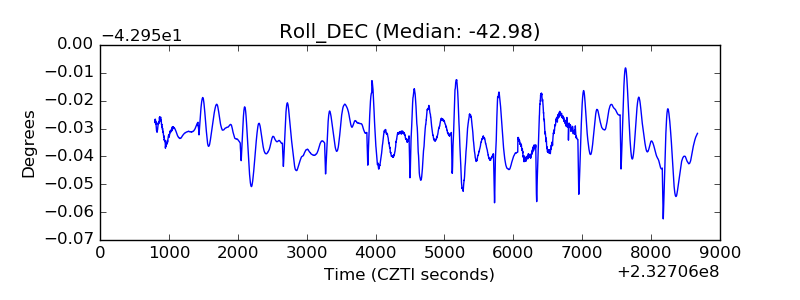 |
| _Roll_RA | 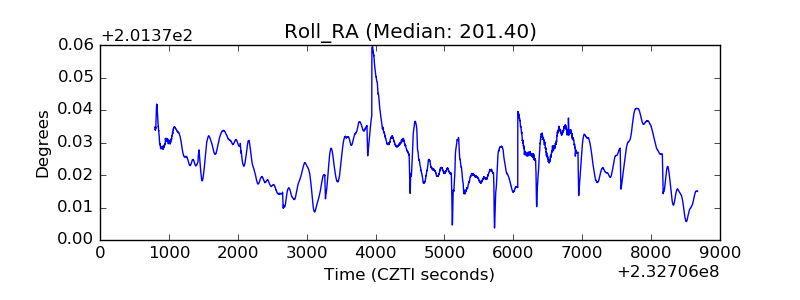 |
| Veto Counter | 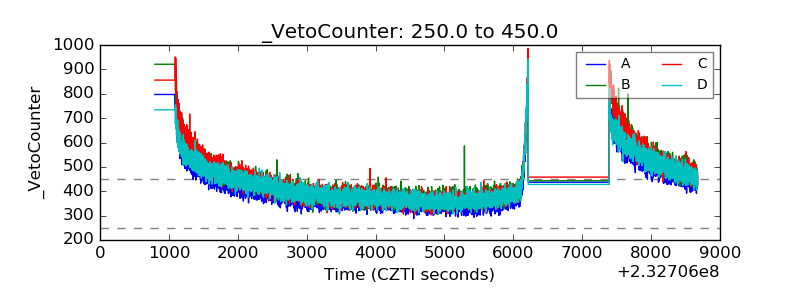 |