| Param | Original file | Final file |
|---|---|---|
| Filename | modeM0/AS1G07_087T01_9000001228_08842cztM0_level2.evt | modeM0/AS1G07_087T01_9000001228_08842cztM0_level2_quad_clean.evt |
| Size (bytes) | 459,964,800 | 96,295,680 |
| Size | 438.7 MB | 91.8 MB |
| Events in quadrant A | 3,367,740 | 629,216 |
| Events in quadrant B | 3,442,443 | 634,571 |
| Events in quadrant C | 3,045,029 | 615,335 |
| Events in quadrant D | 3,649,249 | 599,957 |
| Mode M0 | |||
|---|---|---|---|
| Quadrant | BADHDUFLAG | Total packets | Discarded packets |
| A | 0 | 14192 | 41 |
| B | 0 | 14180 | 45 |
| C | 0 | 13280 | 37 |
| D | 0 | 14674 | 39 |
| Mode M9 | |||
|---|---|---|---|
| Quadrant | BADHDUFLAG | Total packets | Discarded packets |
| A | 0 | 22 | 0 |
| B | 0 | 22 | 0 |
| C | 0 | 22 | 0 |
| D | 0 | 23 | 0 |
| Mode SS | |||
|---|---|---|---|
| Quadrant | BADHDUFLAG | Total packets | Discarded packets |
| A | 0 | 128 | 0 |
| B | 0 | 128 | 0 |
| C | 0 | 128 | 0 |
| D | 0 | 128 | 0 |
| Quadrant | Total seconds | Saturated seconds | Saturation percentage |
|---|---|---|---|
| A | 6262 | 85 | 1.357394% |
| B | 6260 | 119 | 1.900958% |
| C | 6263 | 64 | 1.021875% |
| D | 6262 | 164 | 2.618972% |
Noise dominated data is calculated using 1-second bins in cleaned event files. If a bin has >2000 counts, and if more than 50% of those come from <1% of pixels, then it is considered to be noise-dominated and hence unusable.
| Quadrant | # 1 sec bins | Bins with >0 counts | Bins with >2000 counts | High rate bins dominated by noise | Noise dominated (total time) | Noise dominated (detector-on time) | Marked lightcurve |
|---|---|---|---|---|---|---|---|
| A | 7533 | 6277 | 1 | 1 | 0.01% | 0.02% | 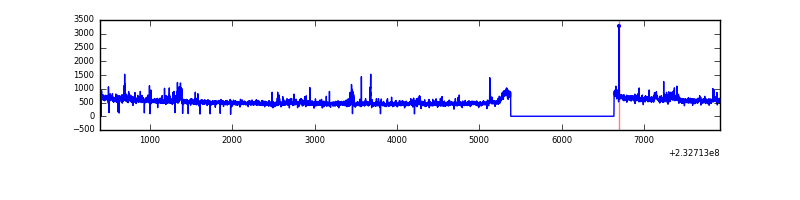 |
| B | 7533 | 6278 | 30 | 30 | 0.40% | 0.48% | 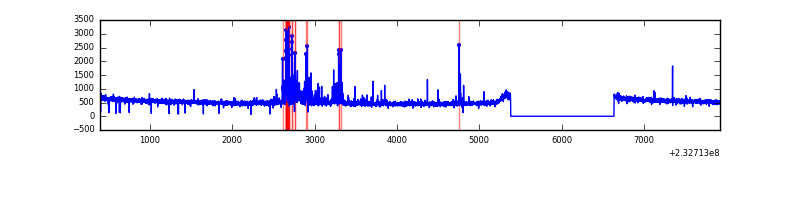 |
| C | 7533 | 6276 | 0 | 0 | 0.00% | 0.00% | 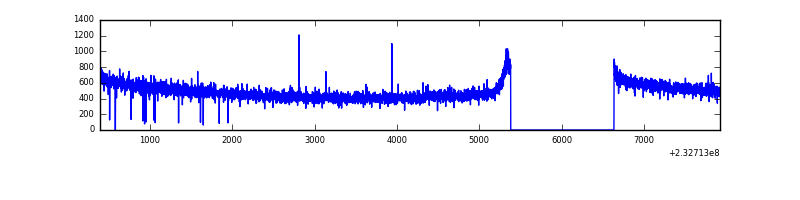 |
| D | 7533 | 6278 | 90 | 90 | 1.19% | 1.43% | 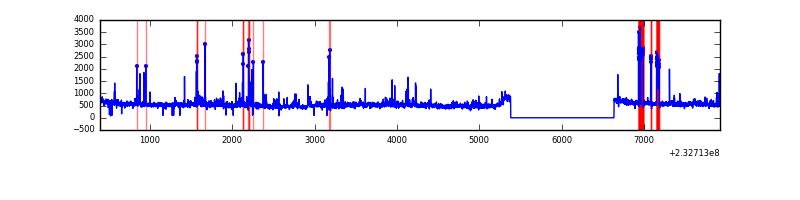 |
Top three noisy pixels from each quadrant. If the there are fewer than three noisy pixels in the level2.evt file, extra rows are filled as -1
| Pixel properties | Quadrant properties | ||||||
|---|---|---|---|---|---|---|---|
| Quadrant | DetID | PixID | Counts | Sigma | Mean | Median | Sigma |
| A | 8 | 5 | 136777 | 841.5 | 816 | 802 | 161.6 |
| A | 15 | 174 | 51349 | 312.82 | 816 | 802 | 161.6 |
| A | 13 | 164 | 31989 | 193.01 | 816 | 802 | 161.6 |
| B | 4 | 48 | 263618 | 1736.71 | 809 | 790 | 151.3 |
| B | 0 | 214 | 21719 | 138.29 | 809 | 790 | 151.3 |
| B | 12 | 111 | 15454 | 96.9 | 809 | 790 | 151.3 |
| C | 13 | 61 | 5919 | 28.6 | 780 | 782 | 179.6 |
| C | 1 | 16 | 3562 | 15.48 | 780 | 782 | 179.6 |
| C | 3 | 202 | 2013 | 6.85 | 780 | 782 | 179.6 |
| D | 1 | 52 | 369964 | 1972.78 | 775 | 757 | 187.1 |
| D | 8 | 195 | 199704 | 1063.03 | 775 | 757 | 187.1 |
| D | 2 | 152 | 37688 | 197.33 | 775 | 757 | 187.1 |
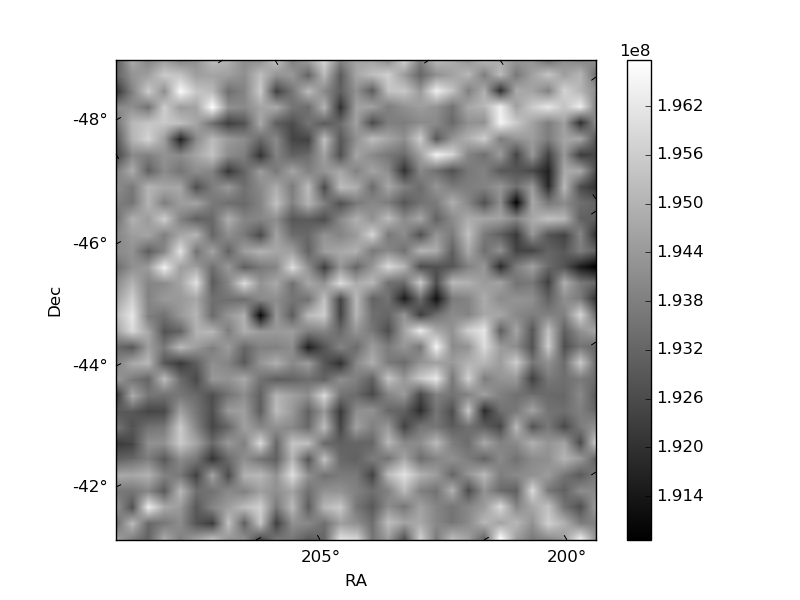
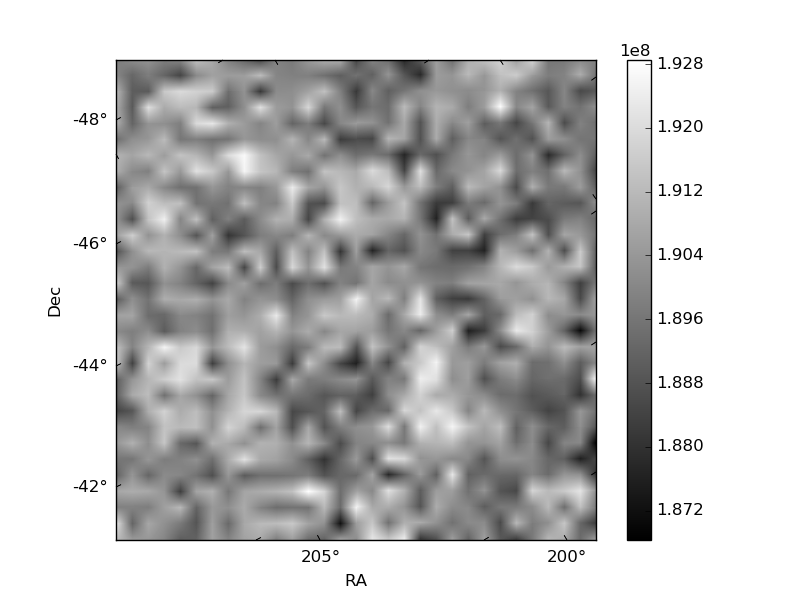
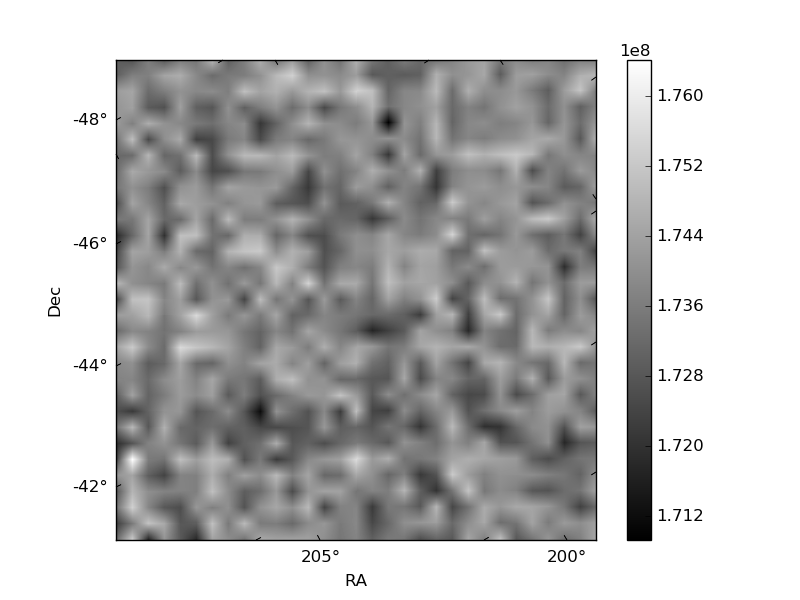
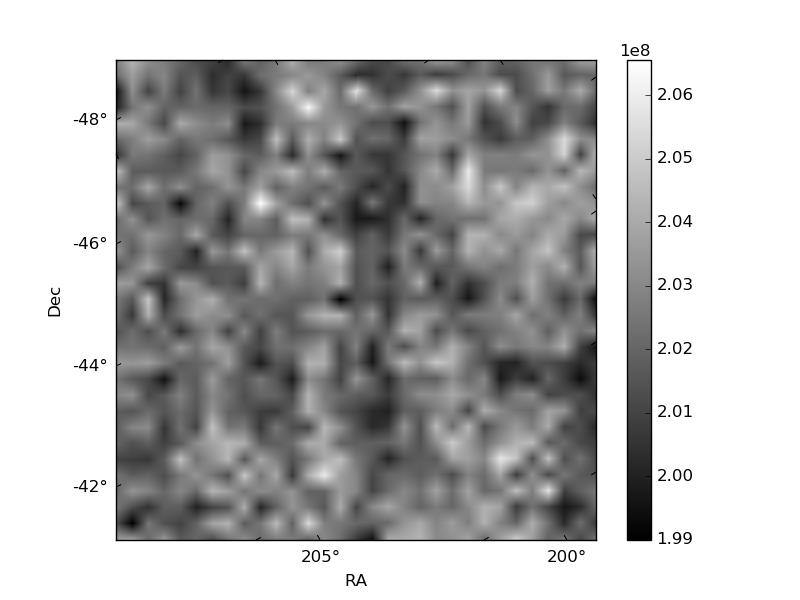
Histogram calculated using DETX and DETY for each event in the final _common_clean file
| Quadrant A | 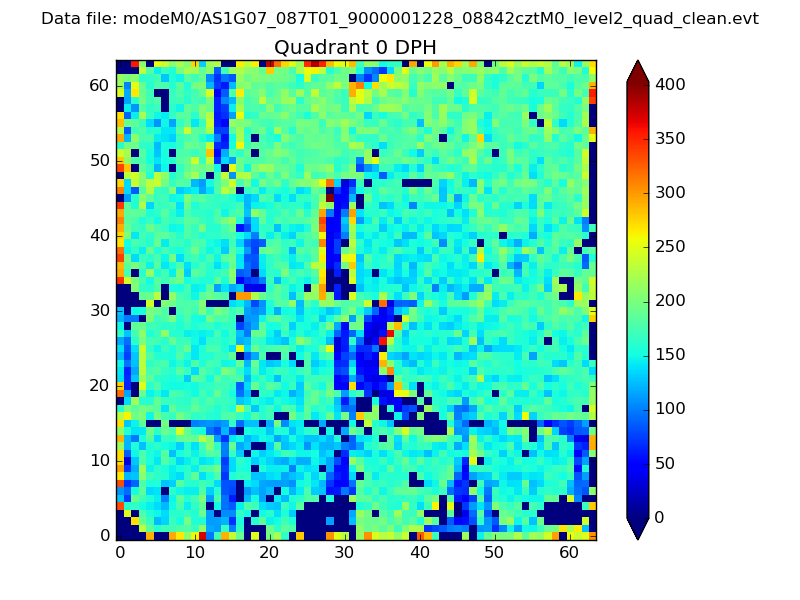 |
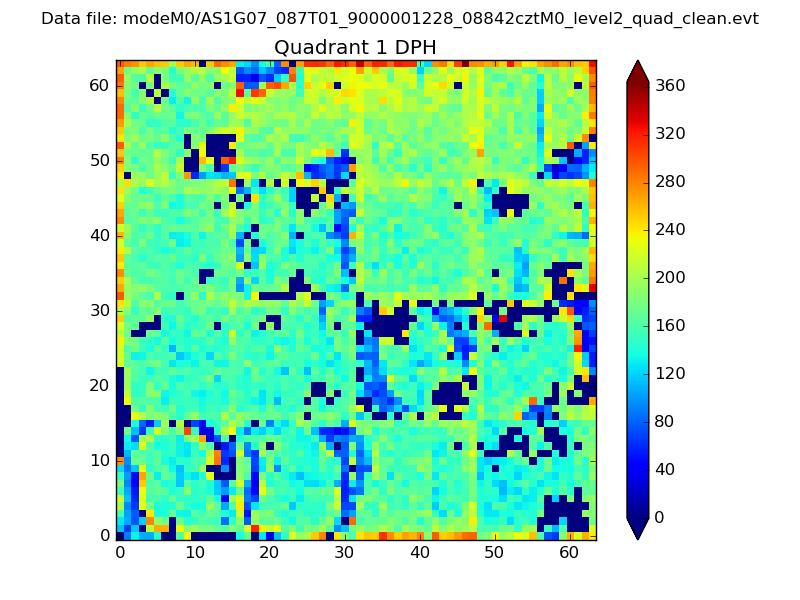 |
Quadrant B |
|---|---|---|---|
| Quadrant D | 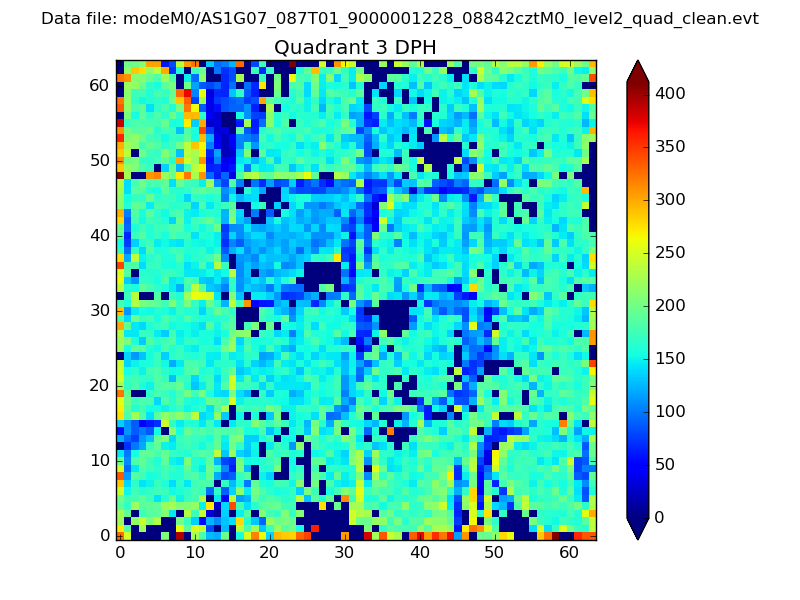 |
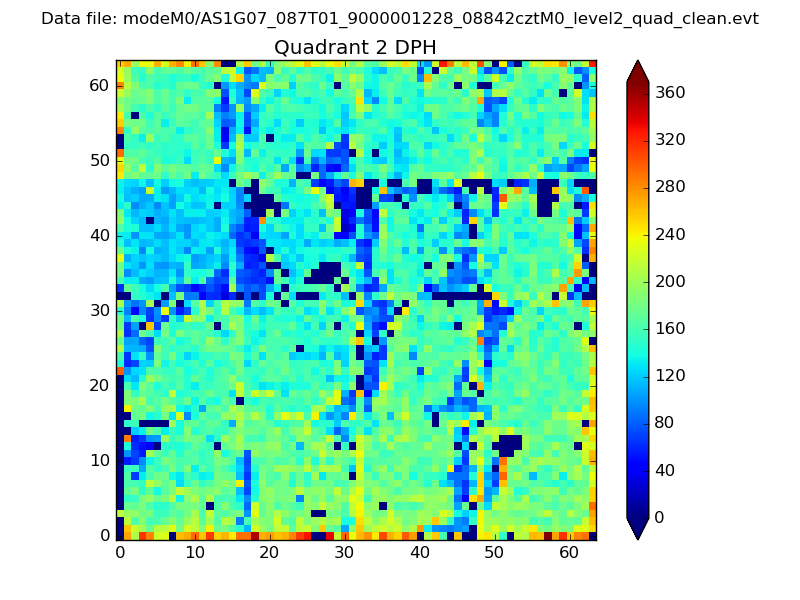 |
Quadrant C |
| Plot type | Count rate plots | Images |
|---|---|---|
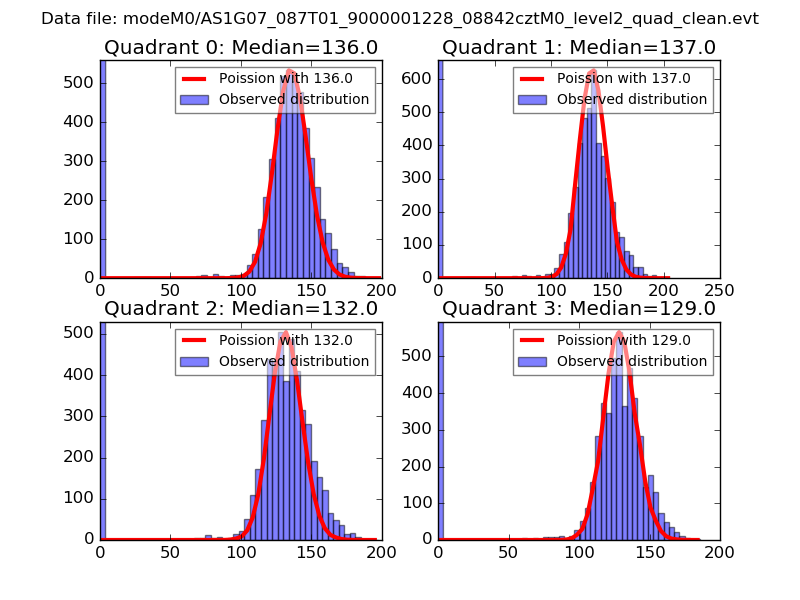
| Comparison with Poisson distribution Blue bars denote a histogram of data divided into 1 sec bins. Red curve is a Poisson curve with rate = median count rate of data. |
 |
 |
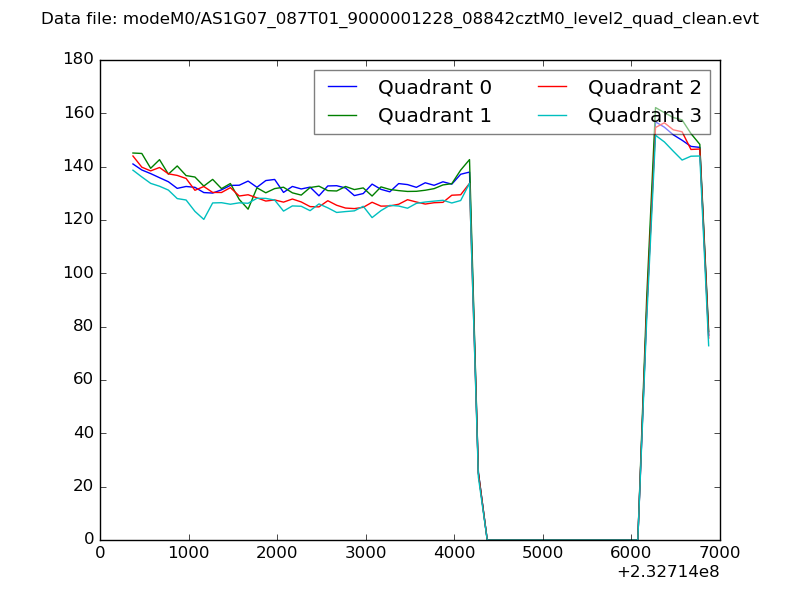
| Quadrant-wise count rates Data is divided into 100 sec bins |
 |
|
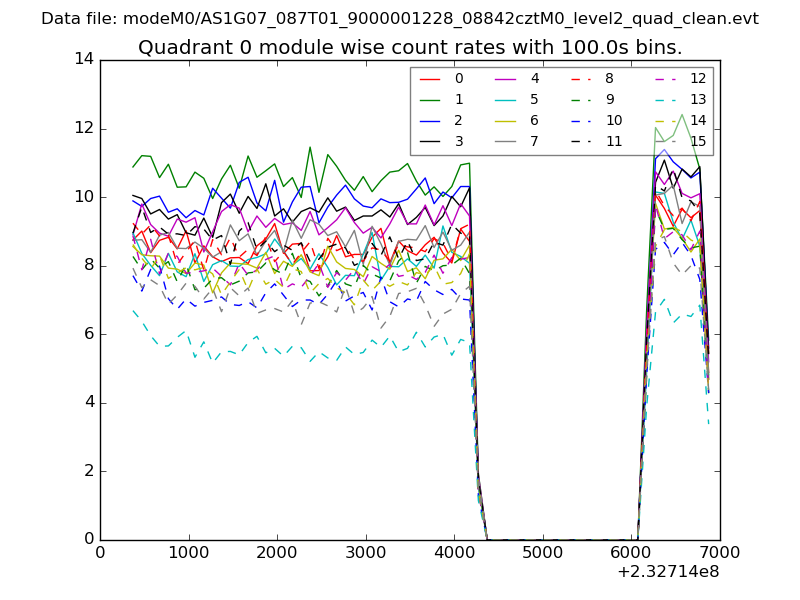
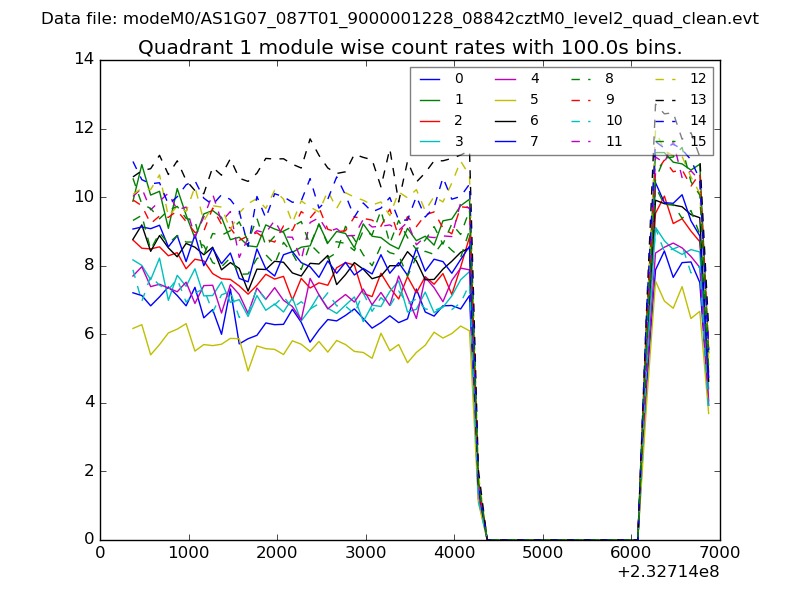
| Module-wise count rates for Quadrant A Data is divided into 100 sec bins |
 |
 |
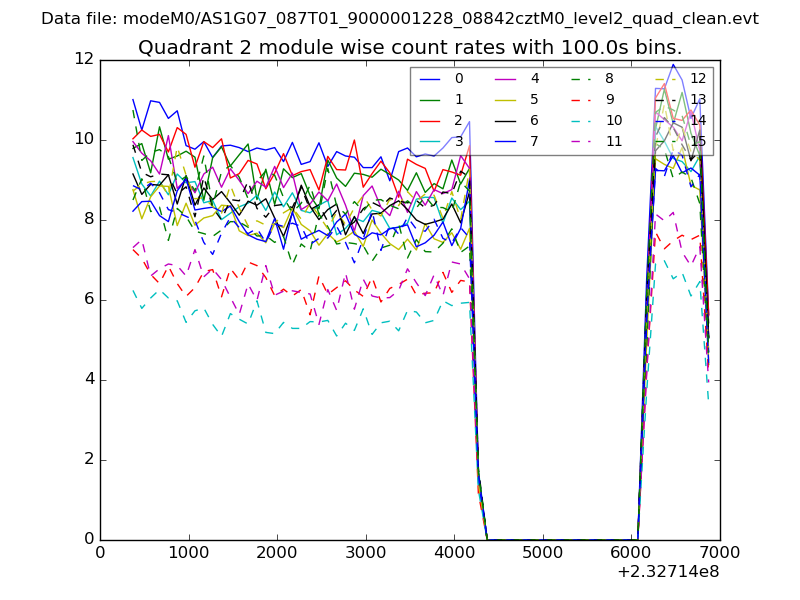
| Module-wise count rates for Quadrant B Data is divided into 100 sec bins |
 |
 |
| Module-wise count rates for Quadrant C Data is divided into 100 sec bins |
 |
 |
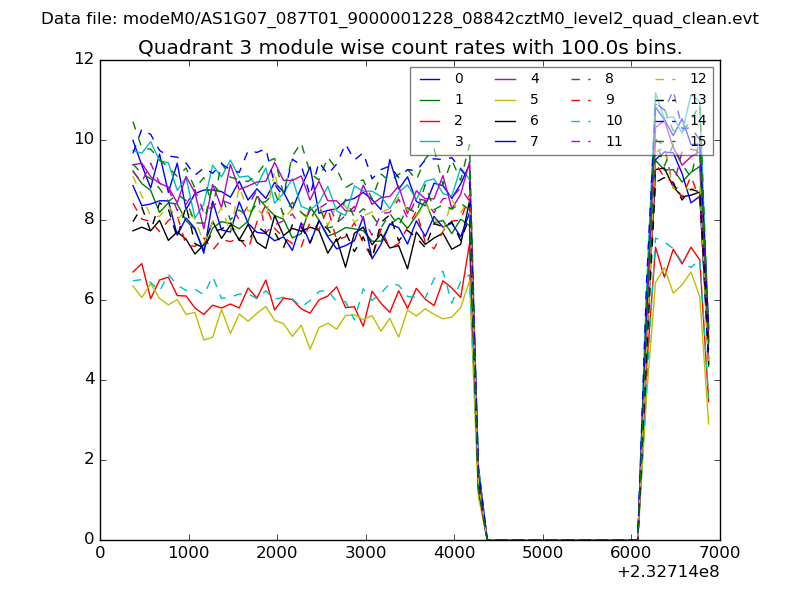
| Module-wise count rates for Quadrant D Data is divided into 100 sec bins |
 |
 |
| Parameter | Plot |
|---|---|
| CZT HV Monitor | 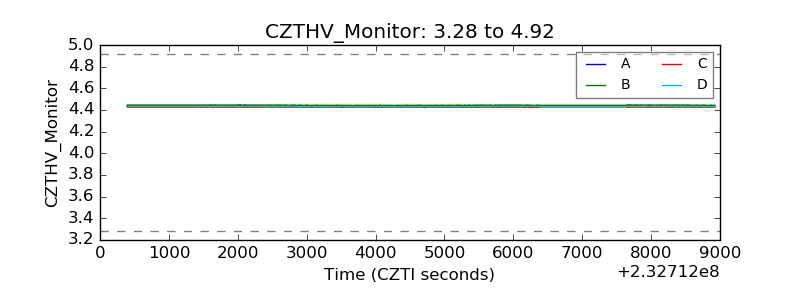 |
| D_VDD | 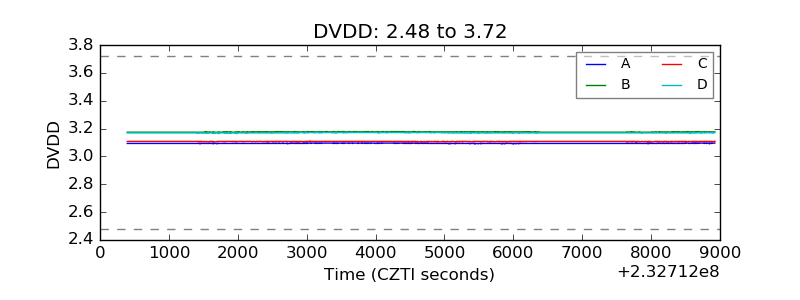 |
| Temperature 1 | 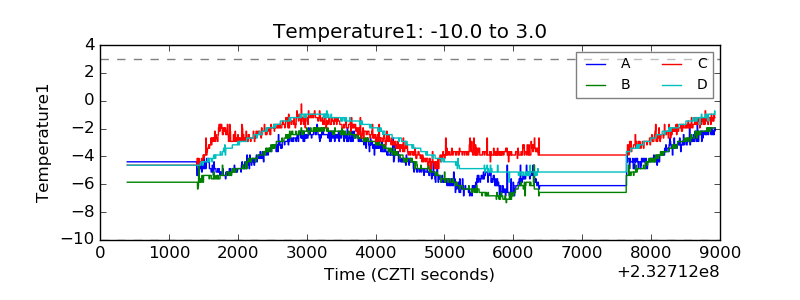 |
| Veto HV Monitor | 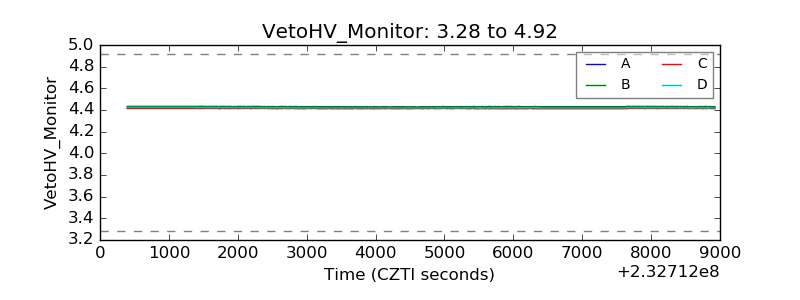 |
| Veto LLD |  |
| Alpha Counter | 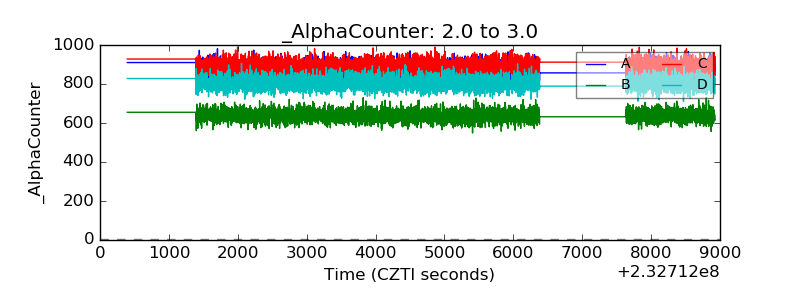 |
| _CPM_Rate | 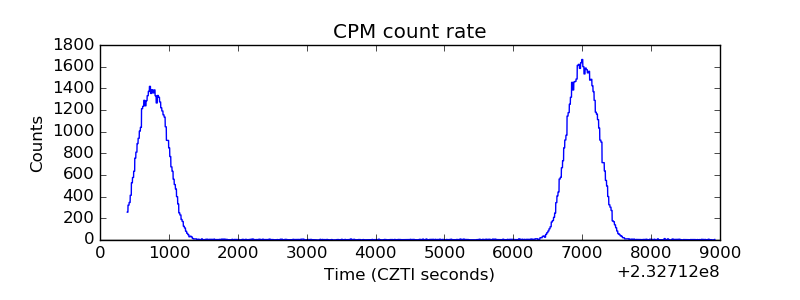 |
| CZT Counter | 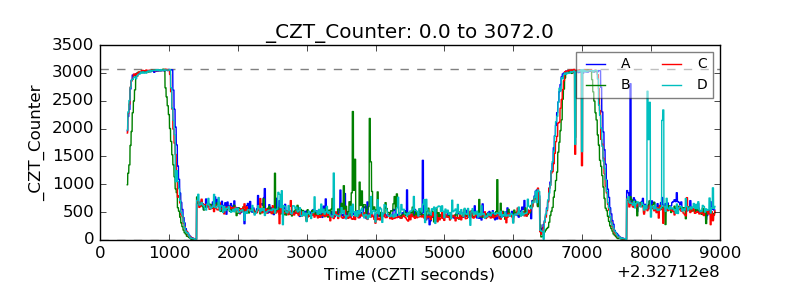 |
| +2.5 Volts monitor |  |
| +5 Volts monitor |  |
| _ROLL_ROT | 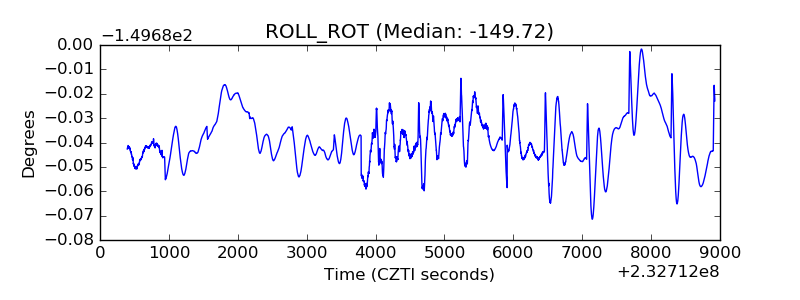 |
| _Roll_DEC | 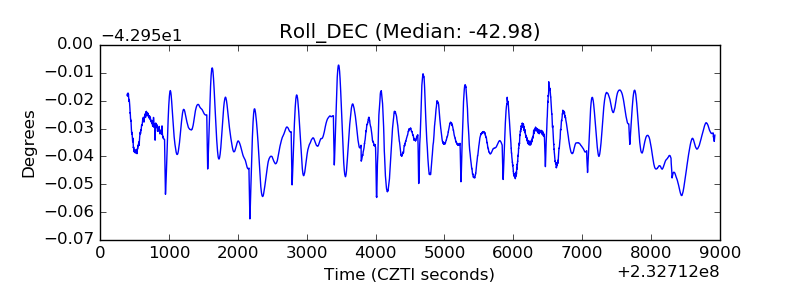 |
| _Roll_RA | 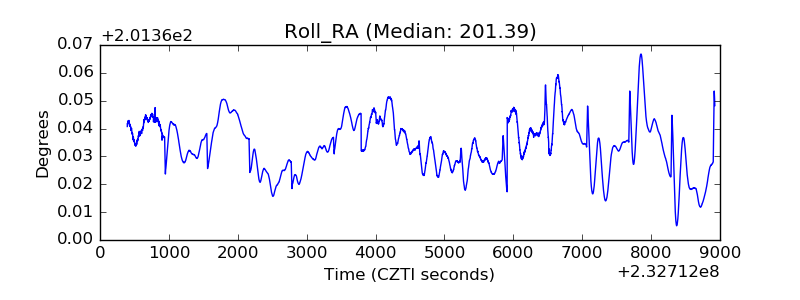 |
| Veto Counter | 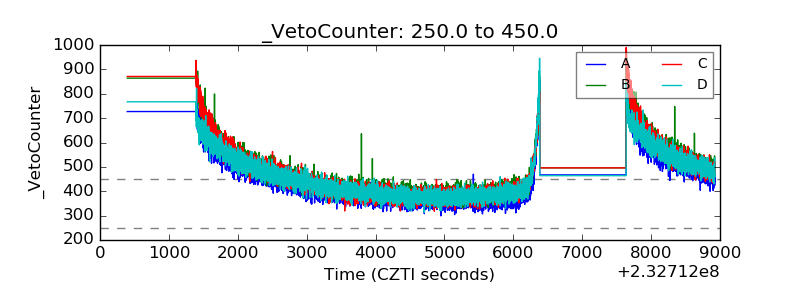 |