| Param | Original file | Final file |
|---|---|---|
| Filename | modeM0/AS1G07_087T01_9000001228_08843cztM0_level2.evt | modeM0/AS1G07_087T01_9000001228_08843cztM0_level2_quad_clean.evt |
| Size (bytes) | 474,998,400 | 114,243,840 |
| Size | 453.0 MB | 109.0 MB |
| Events in quadrant A | 3,598,371 | 769,059 |
| Events in quadrant B | 3,444,419 | 778,994 |
| Events in quadrant C | 2,991,358 | 749,493 |
| Events in quadrant D | 3,925,421 | 724,892 |
| Mode M0 | |||
|---|---|---|---|
| Quadrant | BADHDUFLAG | Total packets | Discarded packets |
| A | 0 | 14711 | 2 |
| B | 0 | 14053 | 1 |
| C | 0 | 13001 | 1 |
| D | 0 | 15783 | 1 |
| Mode M9 | |||
|---|---|---|---|
| Quadrant | BADHDUFLAG | Total packets | Discarded packets |
| A | 0 | 13 | 0 |
| B | 0 | 13 | 0 |
| C | 0 | 13 | 0 |
| D | 0 | 13 | 0 |
| Mode SS | |||
|---|---|---|---|
| Quadrant | BADHDUFLAG | Total packets | Discarded packets |
| A | 0 | 128 | 0 |
| B | 0 | 128 | 0 |
| C | 0 | 128 | 0 |
| D | 0 | 128 | 0 |
| Quadrant | Total seconds | Saturated seconds | Saturation percentage |
|---|---|---|---|
| A | 6269 | 95 | 1.515393% |
| B | 6269 | 131 | 2.089647% |
| C | 6269 | 61 | 0.973042% |
| D | 6269 | 234 | 3.732653% |
Noise dominated data is calculated using 1-second bins in cleaned event files. If a bin has >2000 counts, and if more than 50% of those come from <1% of pixels, then it is considered to be noise-dominated and hence unusable.
| Quadrant | # 1 sec bins | Bins with >0 counts | Bins with >2000 counts | High rate bins dominated by noise | Noise dominated (total time) | Noise dominated (detector-on time) | Marked lightcurve |
|---|---|---|---|---|---|---|---|
| A | 7574 | 6269 | 2 | 2 | 0.03% | 0.03% | 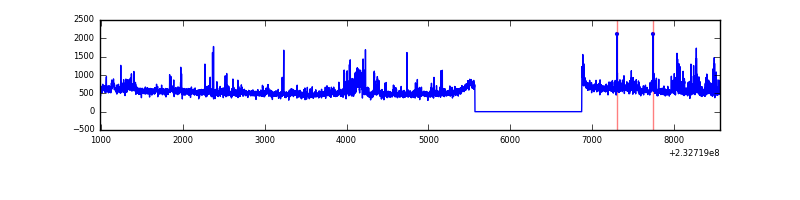 |
| B | 7574 | 6270 | 34 | 34 | 0.45% | 0.54% | 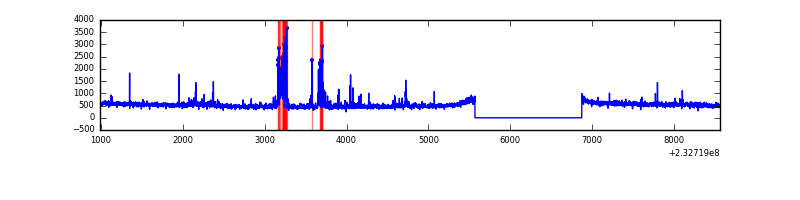 |
| C | 7574 | 6269 | 0 | 0 | 0.00% | 0.00% | 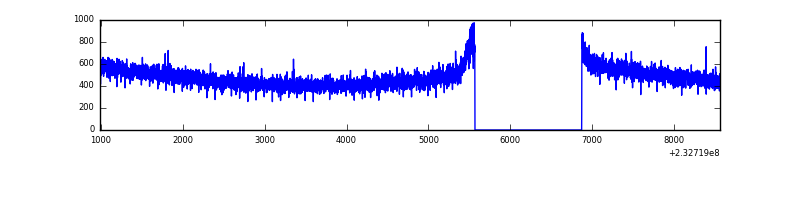 |
| D | 7574 | 6269 | 154 | 154 | 2.03% | 2.46% | 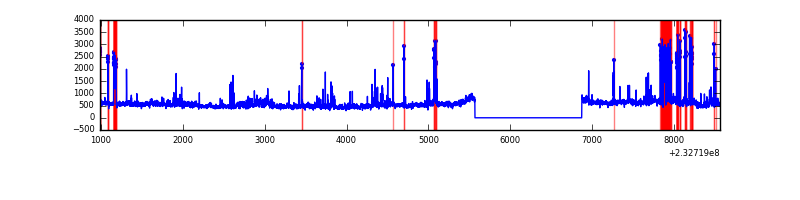 |
Top three noisy pixels from each quadrant. If the there are fewer than three noisy pixels in the level2.evt file, extra rows are filled as -1
| Pixel properties | Quadrant properties | ||||||
|---|---|---|---|---|---|---|---|
| Quadrant | DetID | PixID | Counts | Sigma | Mean | Median | Sigma |
| A | 8 | 5 | 442659 | 2695.76 | 812 | 796 | 163.9 |
| A | 15 | 174 | 11148 | 63.15 | 812 | 796 | 163.9 |
| A | 5 | 16 | 9724 | 54.47 | 812 | 796 | 163.9 |
| B | 4 | 48 | 224980 | 1487.4 | 805 | 787 | 150.7 |
| B | 0 | 214 | 46406 | 302.66 | 805 | 787 | 150.7 |
| B | 0 | 213 | 26011 | 167.35 | 805 | 787 | 150.7 |
| C | 13 | 61 | 5851 | 29.16 | 766 | 770 | 174.3 |
| C | 3 | 202 | 2082 | 7.53 | 766 | 770 | 174.3 |
| C | 1 | 16 | 1703 | 5.35 | 766 | 770 | 174.3 |
| D | 1 | 52 | 479846 | 2476.14 | 767 | 747 | 193.5 |
| D | 8 | 195 | 237029 | 1221.18 | 767 | 747 | 193.5 |
| D | 11 | 129 | 102886 | 527.89 | 767 | 747 | 193.5 |
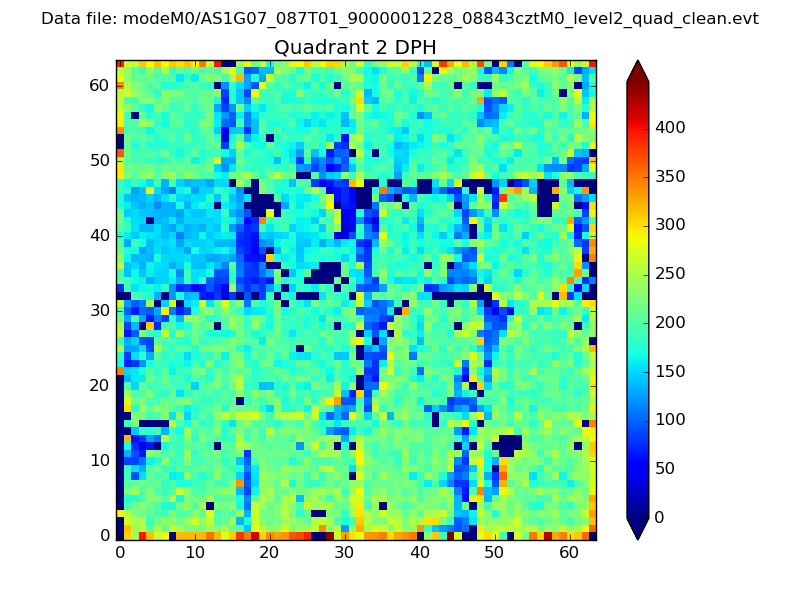
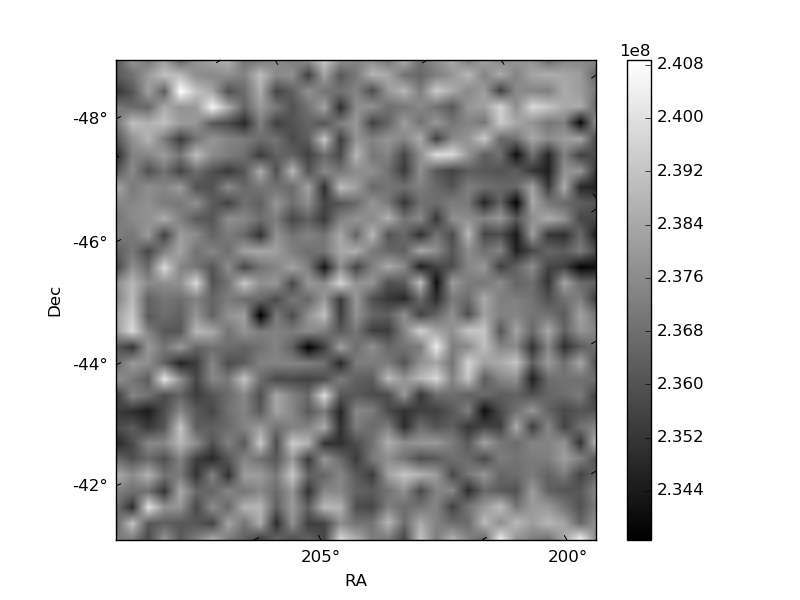
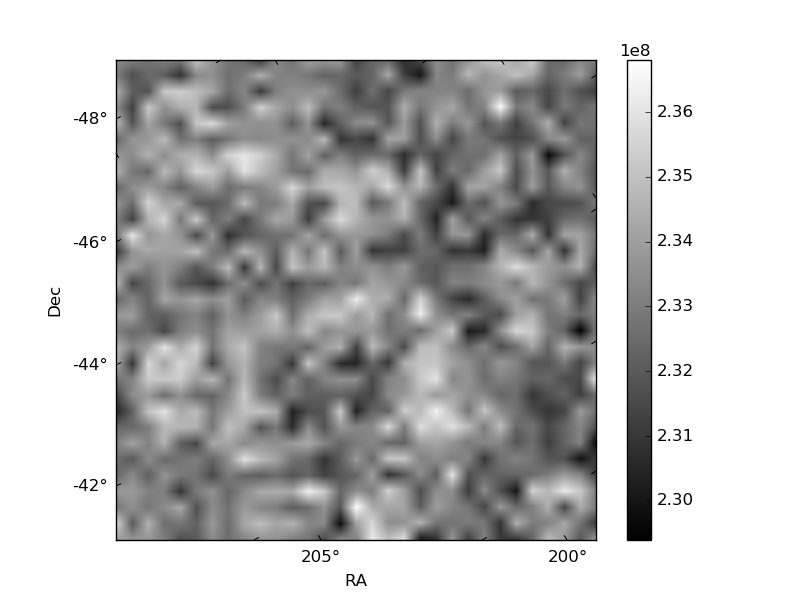
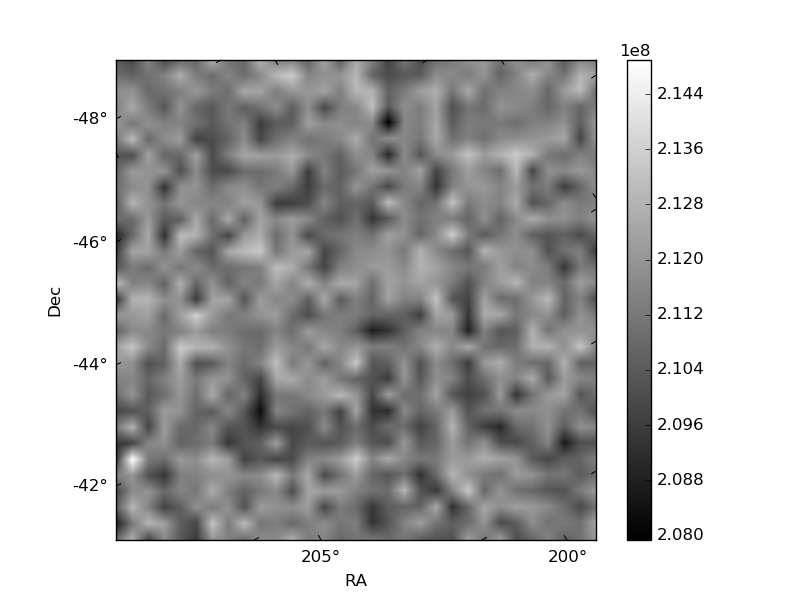
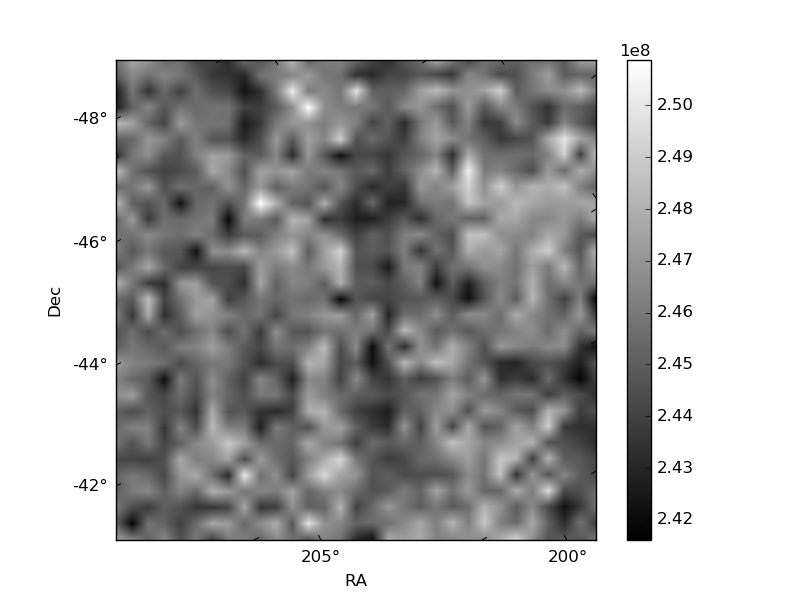
Histogram calculated using DETX and DETY for each event in the final _common_clean file
| Quadrant A | 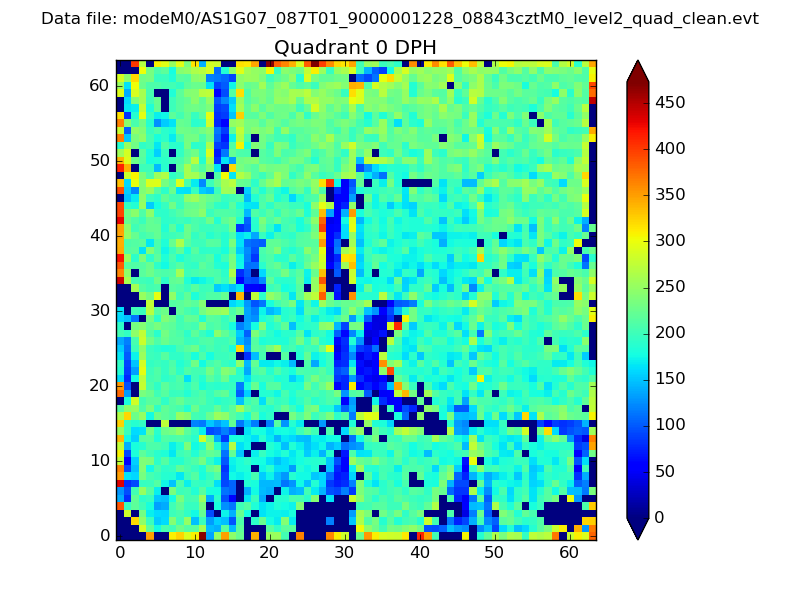 |
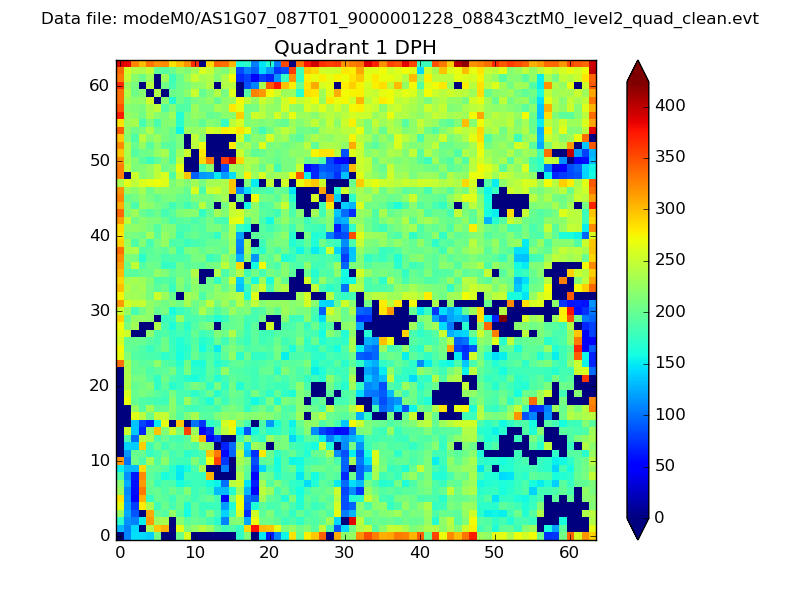 |
Quadrant B |
|---|---|---|---|
| Quadrant D | 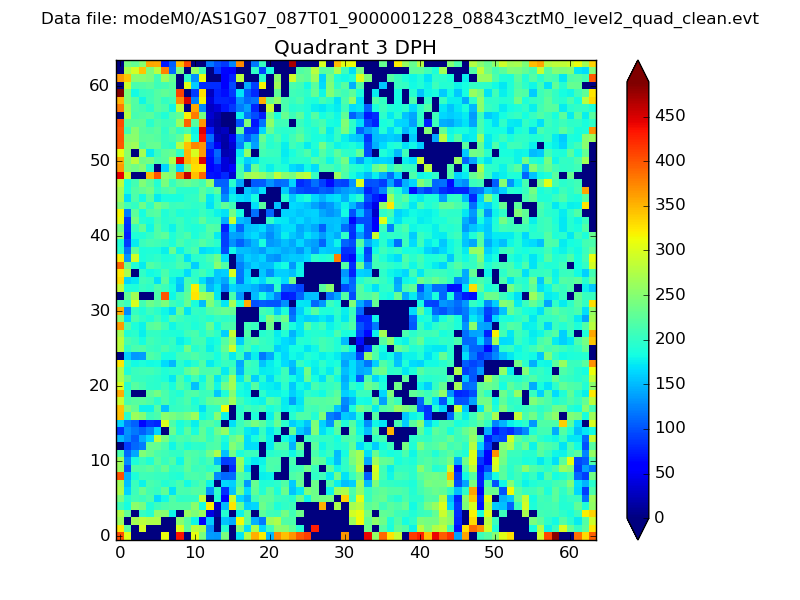 |
 |
Quadrant C |
| Plot type | Count rate plots | Images |
|---|---|---|
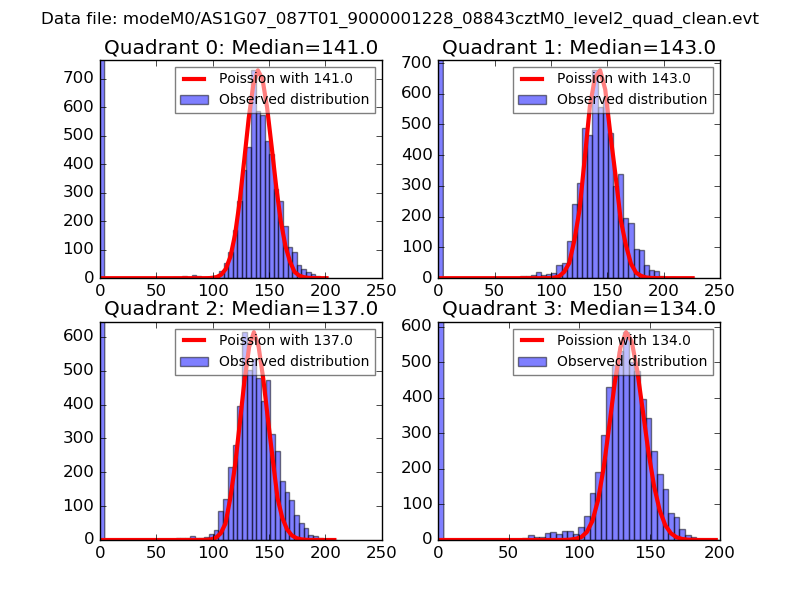
| Comparison with Poisson distribution Blue bars denote a histogram of data divided into 1 sec bins. Red curve is a Poisson curve with rate = median count rate of data. |
 |
 |
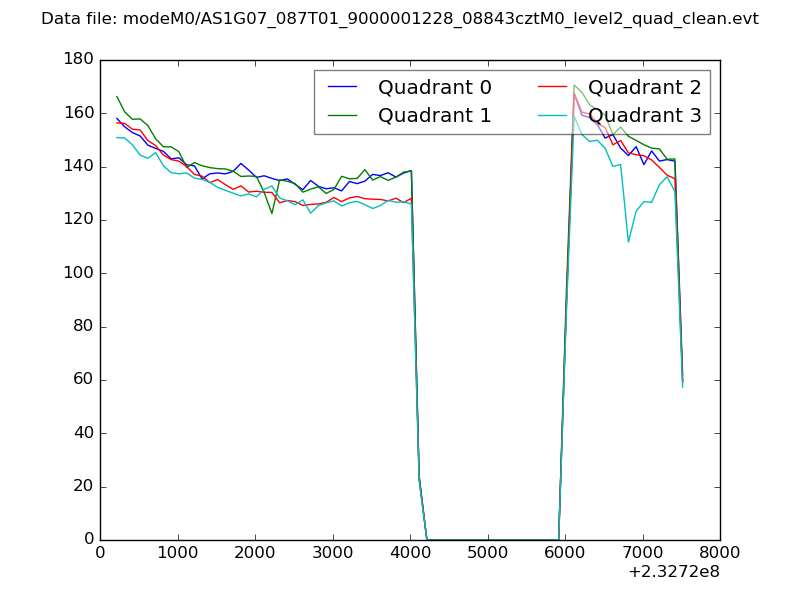
| Quadrant-wise count rates Data is divided into 100 sec bins |
 |
|
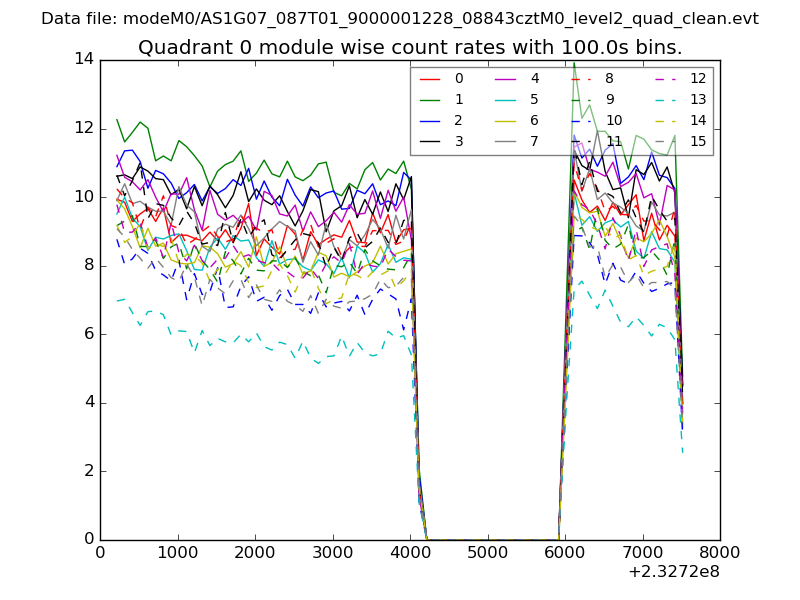
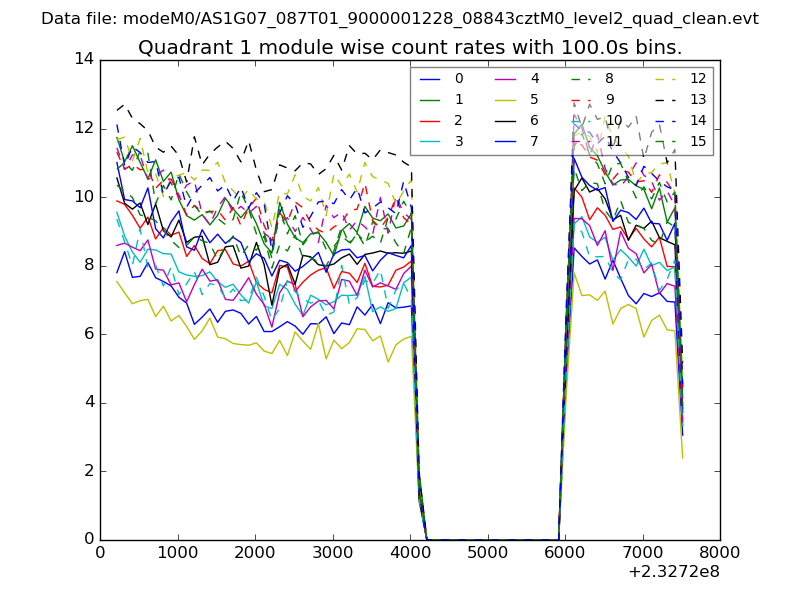
| Module-wise count rates for Quadrant A Data is divided into 100 sec bins |
 |
 |
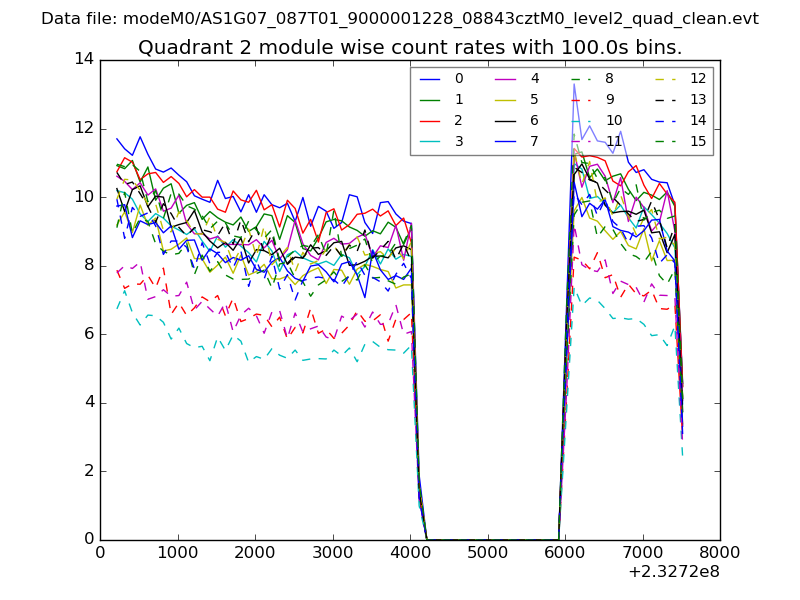
| Module-wise count rates for Quadrant B Data is divided into 100 sec bins |
 |
 |
| Module-wise count rates for Quadrant C Data is divided into 100 sec bins |
 |
 |
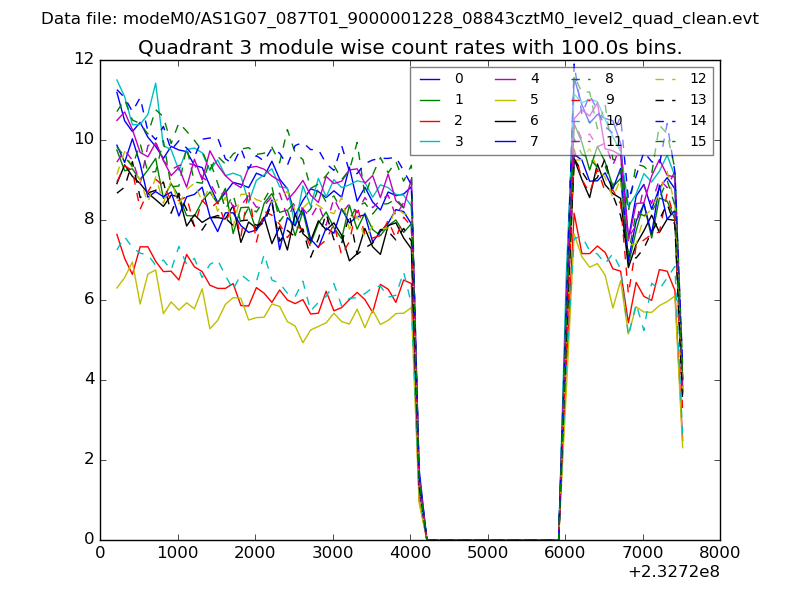
| Module-wise count rates for Quadrant D Data is divided into 100 sec bins |
 |
 |
| Parameter | Plot |
|---|---|
| CZT HV Monitor | 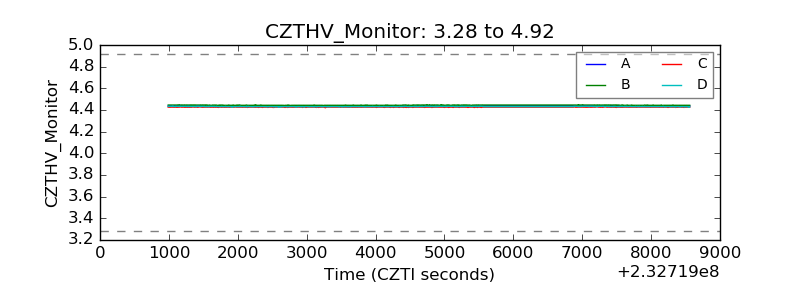 |
| D_VDD | 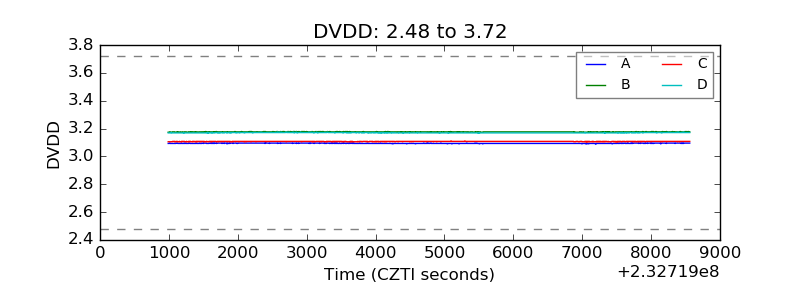 |
| Temperature 1 | 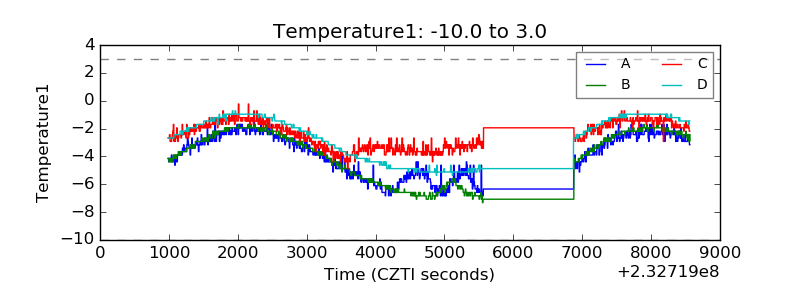 |
| Veto HV Monitor | 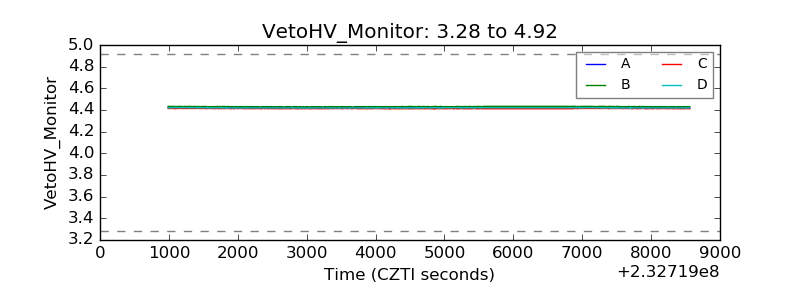 |
| Veto LLD | 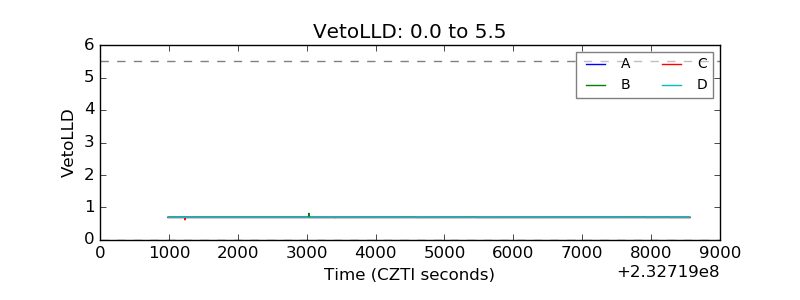 |
| Alpha Counter | 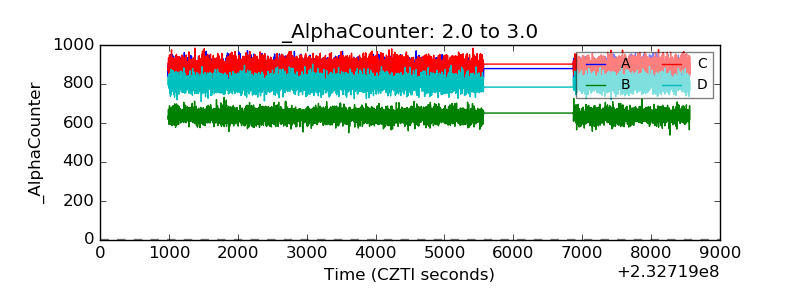 |
| _CPM_Rate | 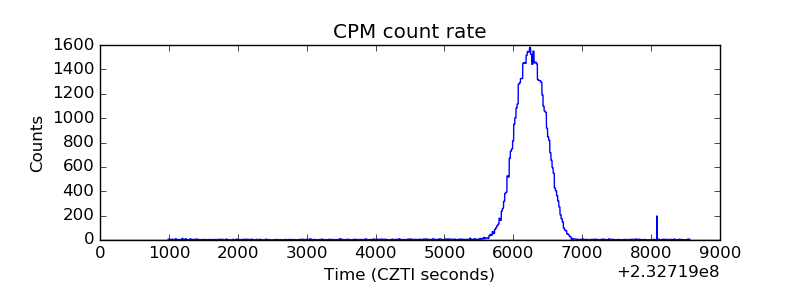 |
| CZT Counter | 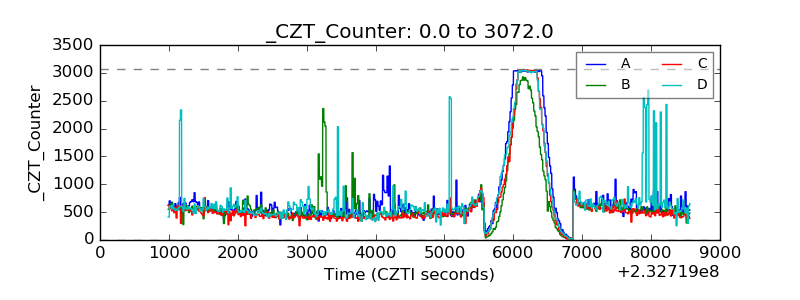 |
| +2.5 Volts monitor |  |
| +5 Volts monitor | 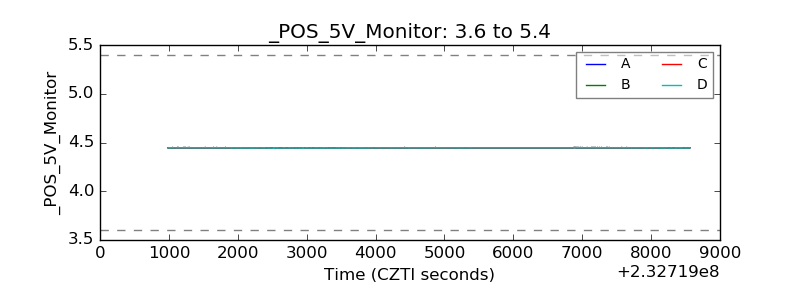 |
| _ROLL_ROT | 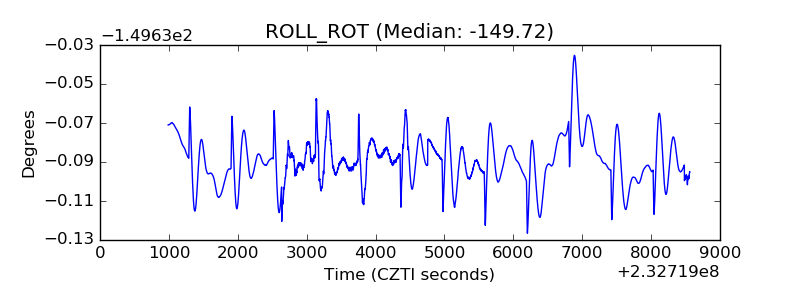 |
| _Roll_DEC | 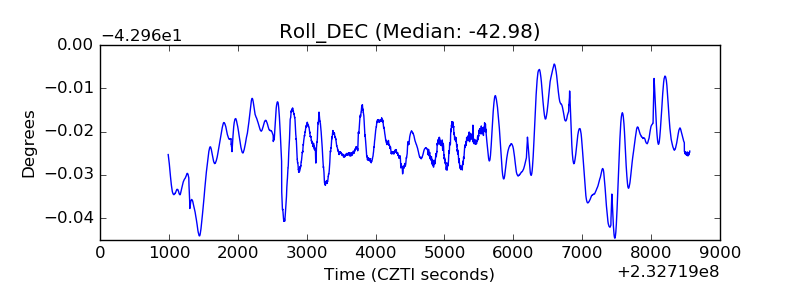 |
| _Roll_RA | 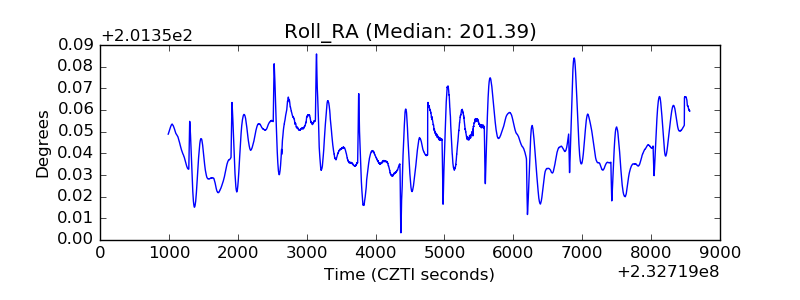 |
| Veto Counter | 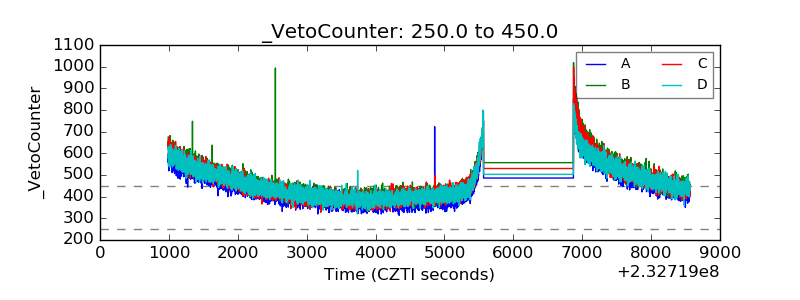 |