| Param | Original file | Final file |
|---|---|---|
| Filename | modeM0/AS1G07_087T01_9000001228_08845cztM0_level2.evt | modeM0/AS1G07_087T01_9000001228_08845cztM0_level2_quad_clean.evt |
| Size (bytes) | 444,798,720 | 102,291,840 |
| Size | 424.2 MB | 97.6 MB |
| Events in quadrant A | 3,269,577 | 677,243 |
| Events in quadrant B | 3,201,891 | 684,429 |
| Events in quadrant C | 2,930,329 | 650,721 |
| Events in quadrant D | 3,630,585 | 635,599 |
| Mode M0 | |||
|---|---|---|---|
| Quadrant | BADHDUFLAG | Total packets | Discarded packets |
| A | 0 | 13951 | 2 |
| B | 0 | 13733 | 1 |
| C | 0 | 13254 | 1 |
| D | 0 | 15005 | 1 |
| Mode M9 | |||
|---|---|---|---|
| Quadrant | BADHDUFLAG | Total packets | Discarded packets |
| A | 0 | 11 | 0 |
| B | 0 | 11 | 0 |
| C | 0 | 11 | 0 |
| D | 0 | 11 | 0 |
| Mode SS | |||
|---|---|---|---|
| Quadrant | BADHDUFLAG | Total packets | Discarded packets |
| A | 0 | 130 | 0 |
| B | 0 | 130 | 0 |
| C | 0 | 130 | 0 |
| D | 0 | 130 | 0 |
| Quadrant | Total seconds | Saturated seconds | Saturation percentage |
|---|---|---|---|
| A | 6454 | 109 | 1.688875% |
| B | 6454 | 81 | 1.255036% |
| C | 6454 | 50 | 0.774713% |
| D | 6454 | 72 | 1.115587% |
Noise dominated data is calculated using 1-second bins in cleaned event files. If a bin has >2000 counts, and if more than 50% of those come from <1% of pixels, then it is considered to be noise-dominated and hence unusable.
| Quadrant | # 1 sec bins | Bins with >0 counts | Bins with >2000 counts | High rate bins dominated by noise | Noise dominated (total time) | Noise dominated (detector-on time) | Marked lightcurve |
|---|---|---|---|---|---|---|---|
| A | 7589 | 6454 | 10 | 10 | 0.13% | 0.15% | 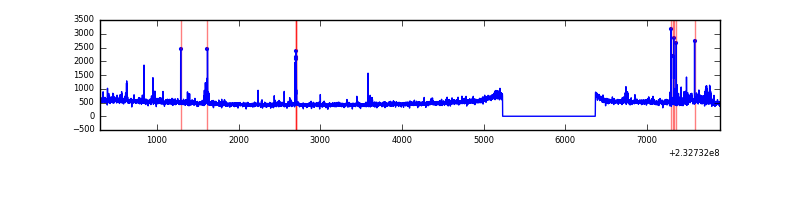 |
| B | 7589 | 6454 | 0 | 0 | 0.00% | 0.00% | 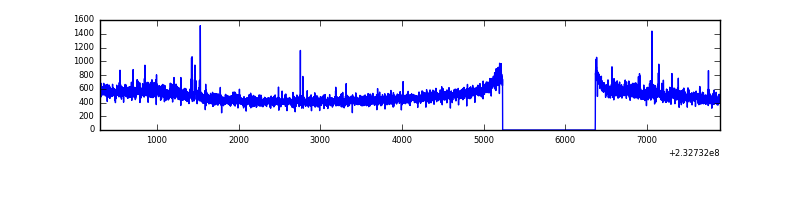 |
| C | 7589 | 6455 | 0 | 0 | 0.00% | 0.00% | 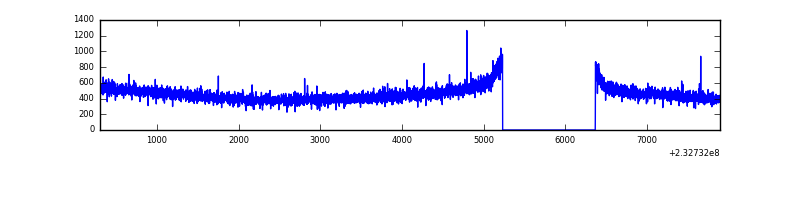 |
| D | 7589 | 6455 | 10 | 10 | 0.13% | 0.15% | 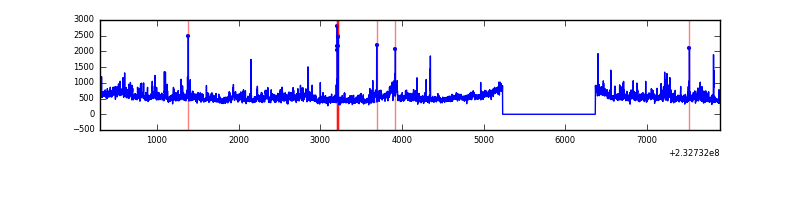 |
Top three noisy pixels from each quadrant. If the there are fewer than three noisy pixels in the level2.evt file, extra rows are filled as -1
| Pixel properties | Quadrant properties | ||||||
|---|---|---|---|---|---|---|---|
| Quadrant | DetID | PixID | Counts | Sigma | Mean | Median | Sigma |
| A | 8 | 5 | 190051 | 1183.69 | 793 | 777 | 159.9 |
| A | 15 | 174 | 19417 | 116.57 | 793 | 777 | 159.9 |
| A | 0 | 226 | 7480 | 41.92 | 793 | 777 | 159.9 |
| B | 0 | 214 | 64530 | 422.38 | 793 | 775 | 150.9 |
| B | 0 | 219 | 24999 | 160.48 | 793 | 775 | 150.9 |
| B | 5 | 255 | 19904 | 126.73 | 793 | 775 | 150.9 |
| C | 1 | 16 | 6286 | 32.18 | 749 | 752 | 172.0 |
| C | 13 | 61 | 5722 | 28.9 | 749 | 752 | 172.0 |
| C | 1 | 3 | 2439 | 9.81 | 749 | 752 | 172.0 |
| D | 2 | 152 | 212677 | 1074.37 | 752 | 733 | 197.3 |
| D | 11 | 129 | 173933 | 877.97 | 752 | 733 | 197.3 |
| D | 8 | 195 | 146802 | 740.44 | 752 | 733 | 197.3 |
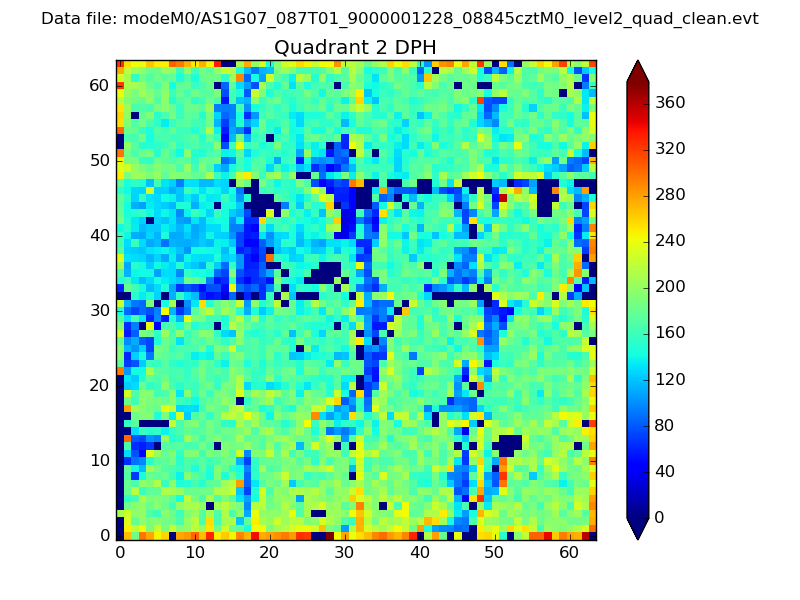
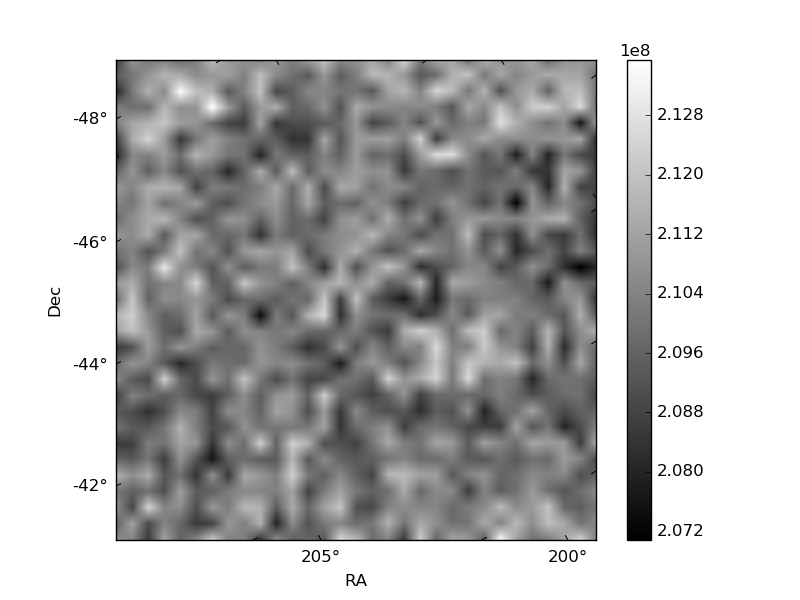
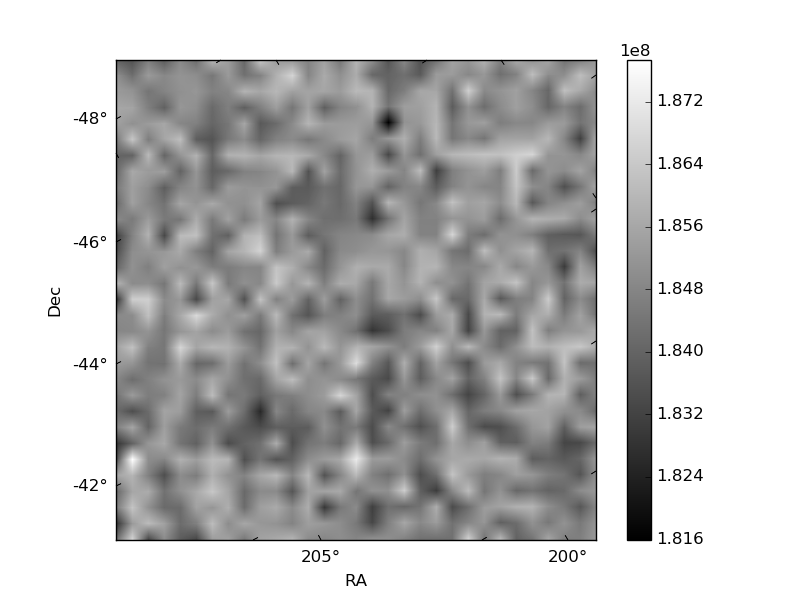
Histogram calculated using DETX and DETY for each event in the final _common_clean file
| Quadrant A | 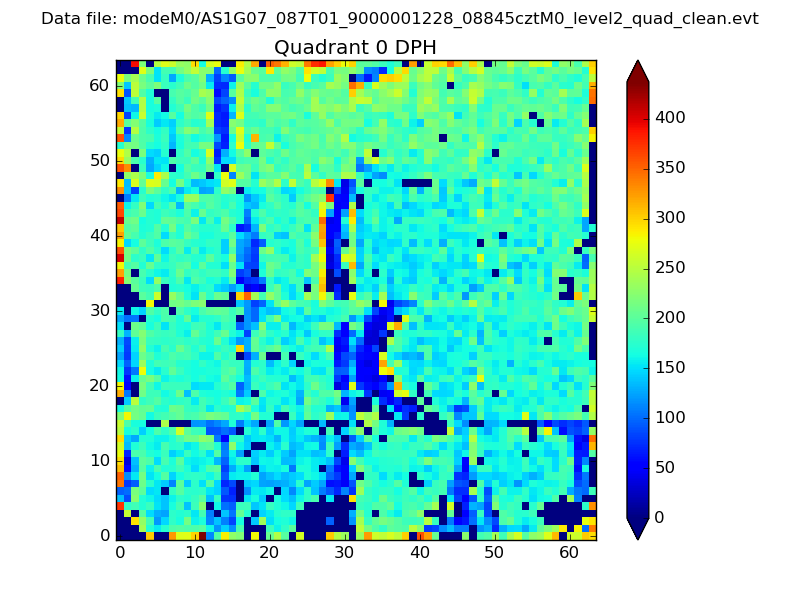 |
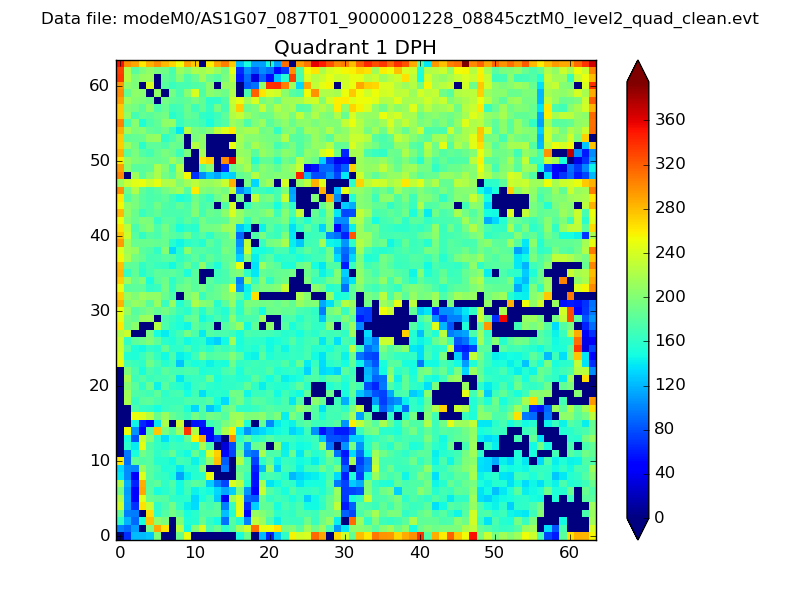 |
Quadrant B |
|---|---|---|---|
| Quadrant D | 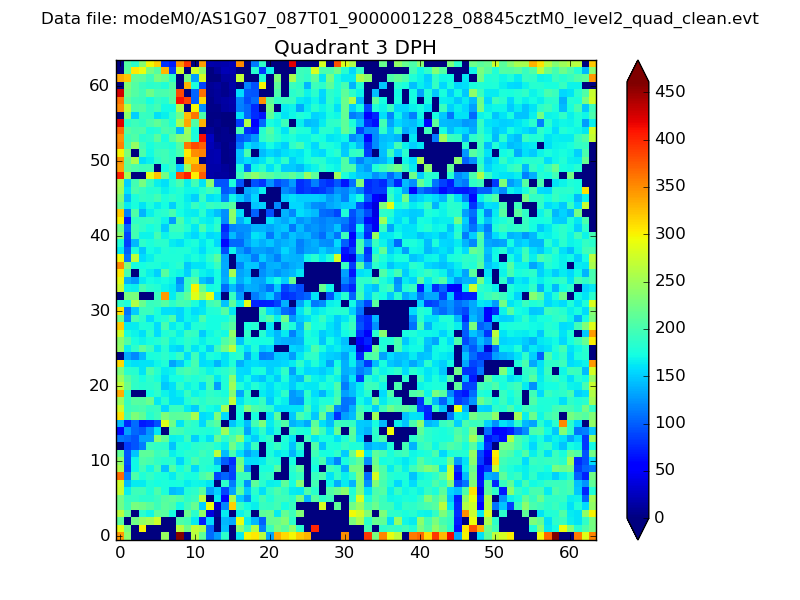 |
 |
Quadrant C |
| Plot type | Count rate plots | Images |
|---|---|---|
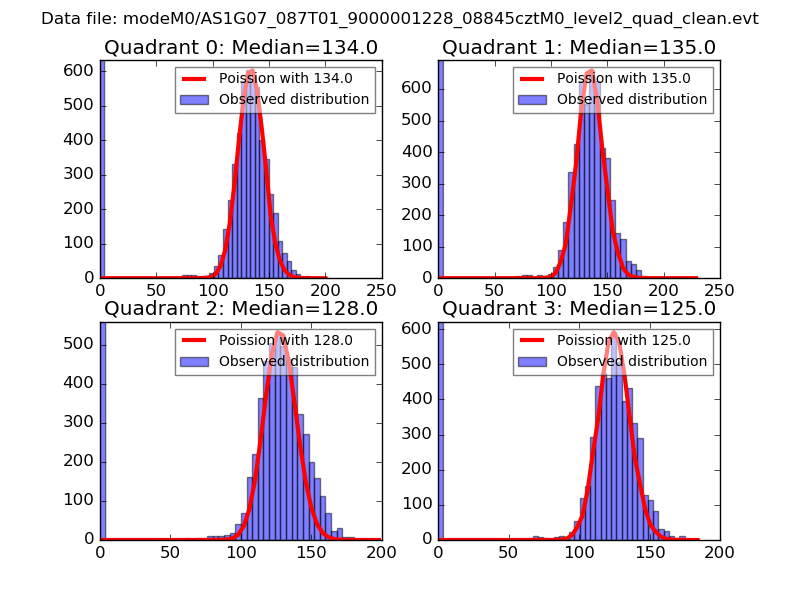
| Comparison with Poisson distribution Blue bars denote a histogram of data divided into 1 sec bins. Red curve is a Poisson curve with rate = median count rate of data. |
 |
 |
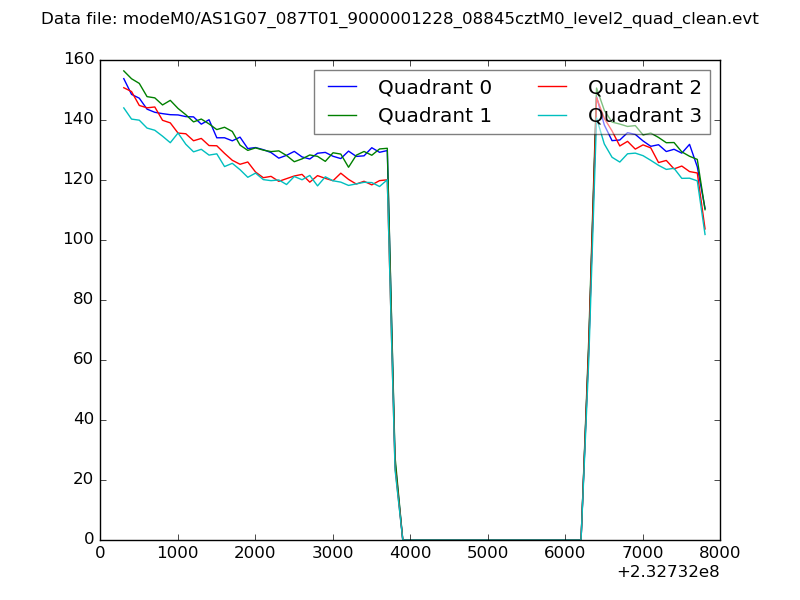
| Quadrant-wise count rates Data is divided into 100 sec bins |
 |
|
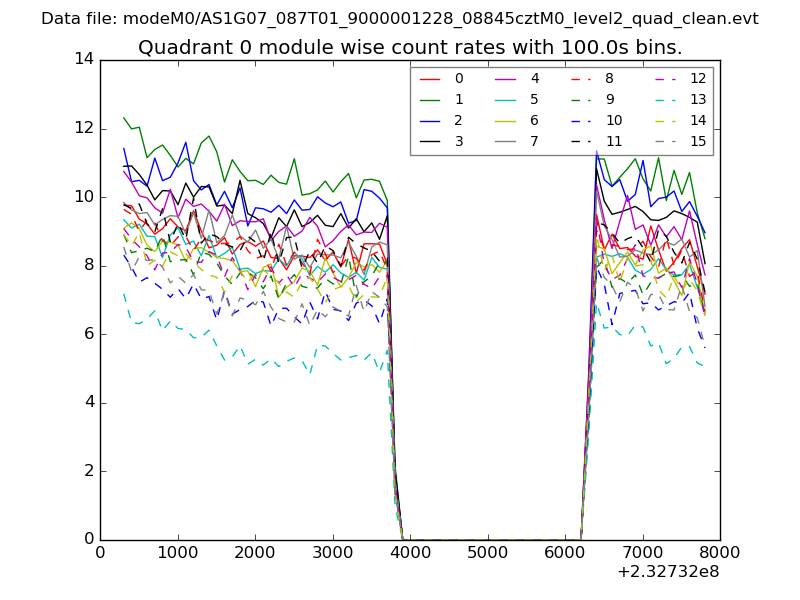
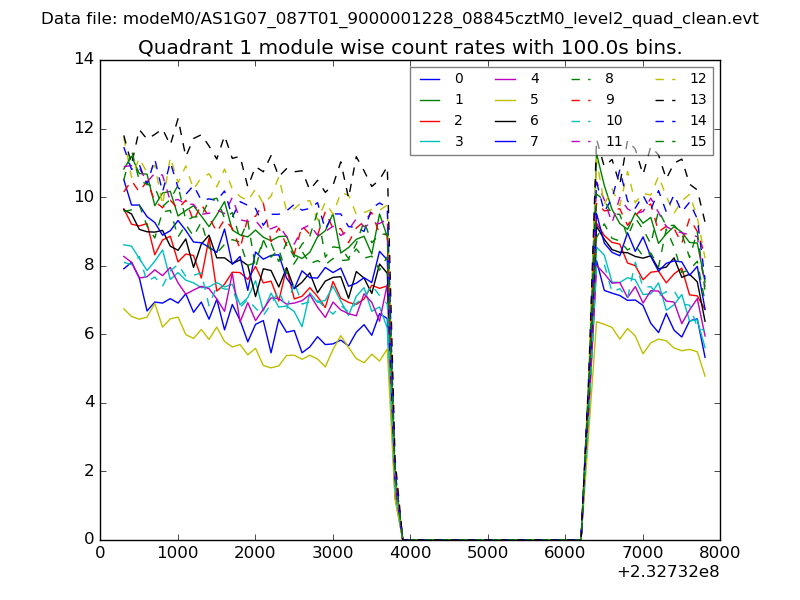
| Module-wise count rates for Quadrant A Data is divided into 100 sec bins |
 |
 |
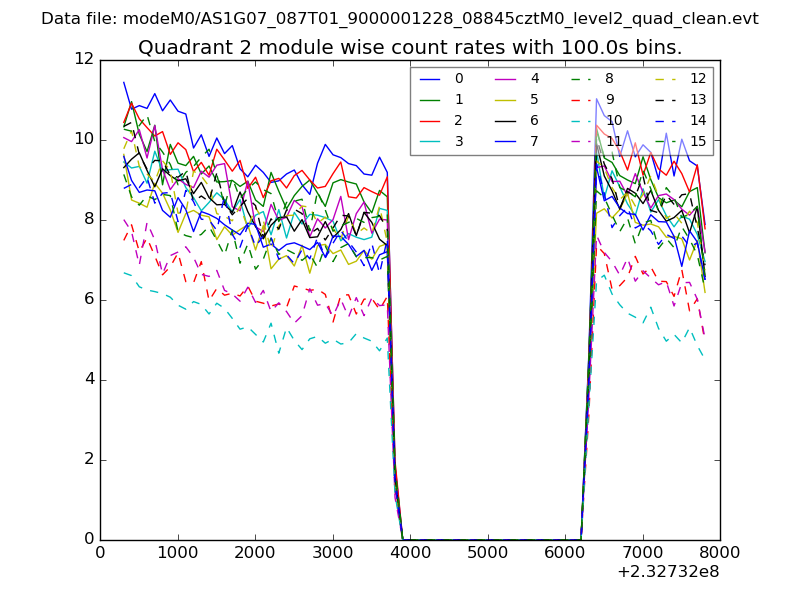
| Module-wise count rates for Quadrant B Data is divided into 100 sec bins |
 |
 |
| Module-wise count rates for Quadrant C Data is divided into 100 sec bins |
 |
 |
| Module-wise count rates for Quadrant D Data is divided into 100 sec bins |
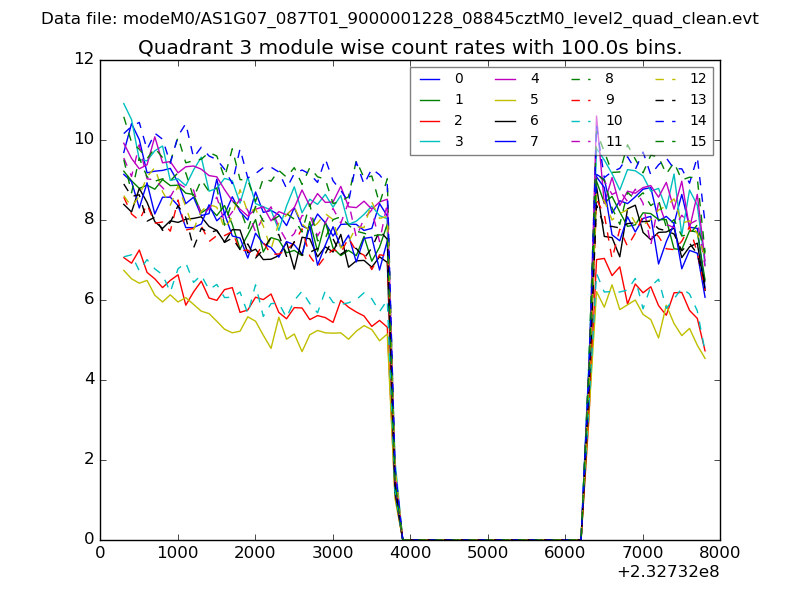 |
 |
| Parameter | Plot |
|---|---|
| CZT HV Monitor | 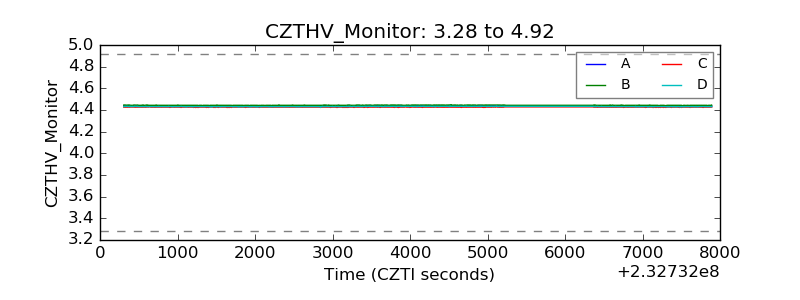 |
| D_VDD |  |
| Temperature 1 | 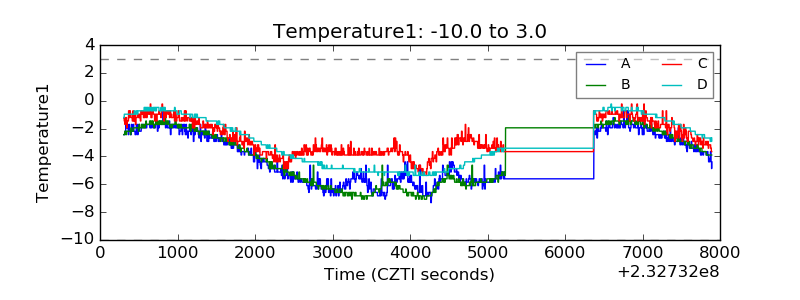 |
| Veto HV Monitor | 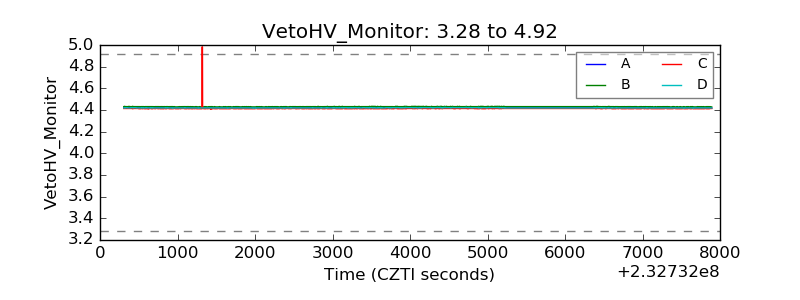 |
| Veto LLD | 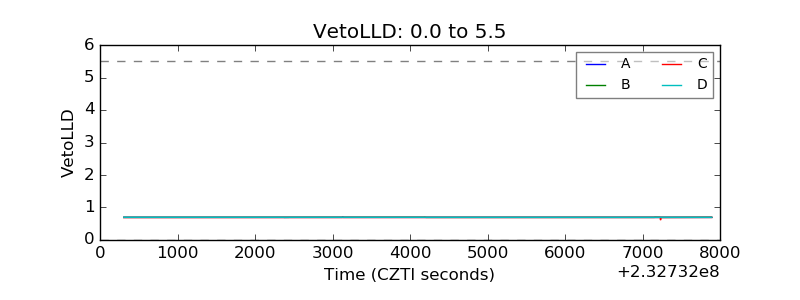 |
| Alpha Counter | 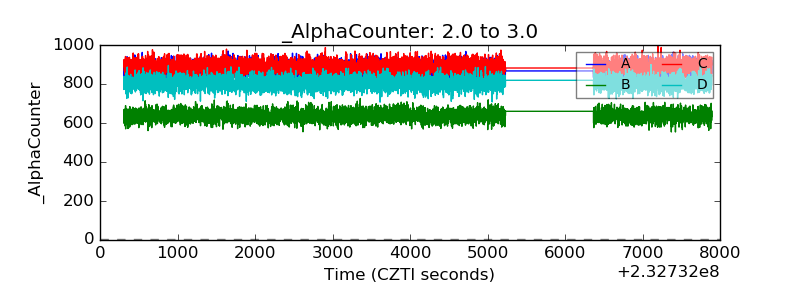 |
| _CPM_Rate | 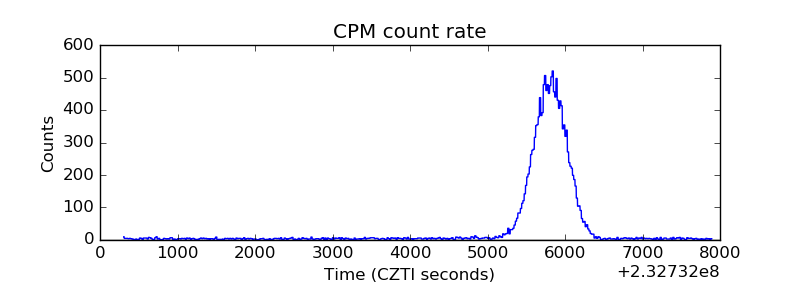 |
| CZT Counter | 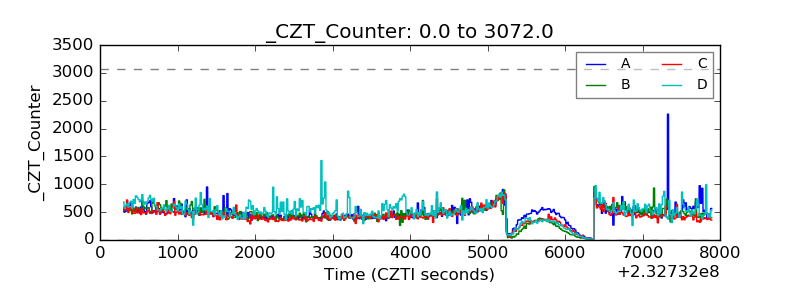 |
| +2.5 Volts monitor |  |
| +5 Volts monitor |  |
| _ROLL_ROT | 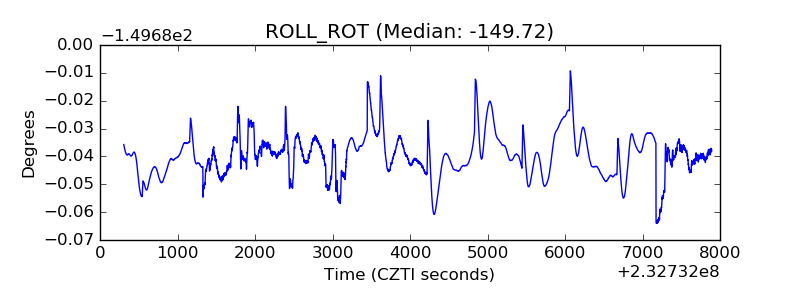 |
| _Roll_DEC | 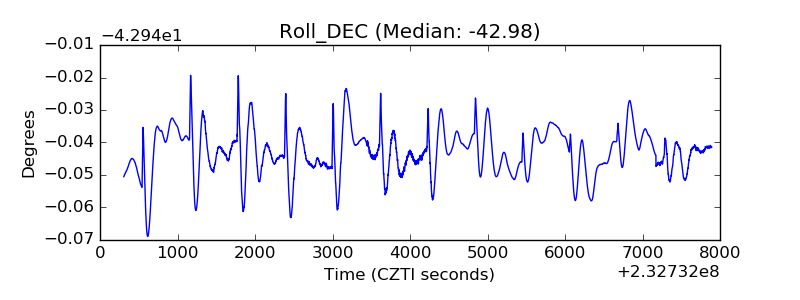 |
| _Roll_RA | 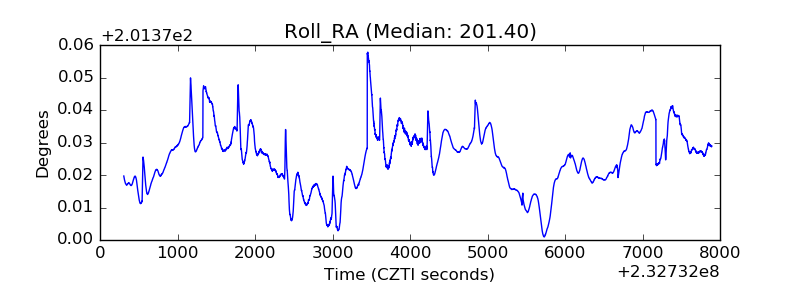 |
| Veto Counter | 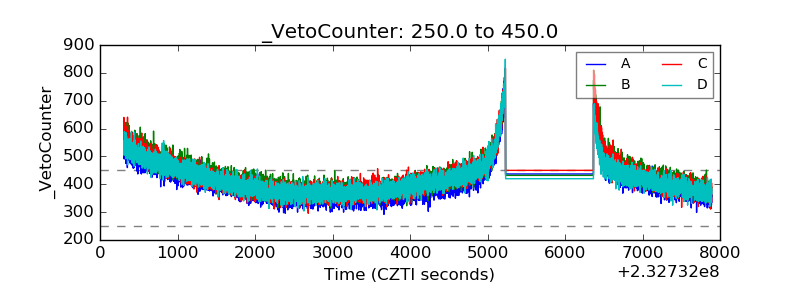 |