| Param | Original file | Final file |
|---|---|---|
| Filename | modeM0/AS1A03_036T01_9000001230cztM0_level2.fits | modeM0/AS1A03_036T01_9000001230cztM0_level2_quad_clean.evt |
| Size (bytes) | 634,965,120 | 636,491,520 |
| Size | 605.5 MB | 607.0 MB |
| Events in quadrant A | 3,801,836 | 3,780,095 |
| Events in quadrant B | 3,676,326 | 3,811,846 |
| Events in quadrant C | 3,773,684 | 3,636,523 |
| Events in quadrant D | 3,284,280 | 3,355,790 |
| Mode SS | |||
|---|---|---|---|
| Quadrant | BADHDUFLAG | Total packets | Discarded packets |
| A | 0 | 1396 | 0 |
| B | 0 | 1398 | 0 |
| C | 0 | 1408 | 0 |
| D | 0 | 1392 | 0 |
| Mode M9 | |||
|---|---|---|---|
| Quadrant | BADHDUFLAG | Total packets | Discarded packets |
| A | 0 | 118 | 0 |
| B | 0 | 116 | 0 |
| C | 0 | 116 | 0 |
| D | 0 | 114 | 0 |
| Mode M0 | |||
|---|---|---|---|
| Quadrant | BADHDUFLAG | Total packets | Discarded packets |
| A | 0 | 167602 | 0 |
| B | 0 | 150545 | 0 |
| C | 0 | 139827 | 0 |
| D | 0 | 161170 | 0 |
| Quadrant | Total seconds | Saturated seconds | Saturation percentage |
|---|---|---|---|
| A | 68413 | 1844 | 2.695394% |
| B | 68459 | 1267 | 1.850743% |
| C | 68445 | 428 | 0.625320% |
| D | 68319 | 818 | 1.197324% |
Noise dominated data is calculated using 1-second bins in cleaned event files. If a bin has >2000 counts, and if more than 50% of those come from <1% of pixels, then it is considered to be noise-dominated and hence unusable.
| Quadrant | # 1 sec bins | Bins with >0 counts | Bins with >2000 counts | High rate bins dominated by noise | Noise dominated (total time) | Noise dominated (detector-on time) | Marked lightcurve |
|---|---|---|---|---|---|---|---|
| A | 85254 | 69191 | 0 | 0 | 0.00% | 0.00% |  |
| B | 85254 | 69255 | 0 | 0 | 0.00% | 0.00% |  |
| C | 85254 | 69243 | 0 | 0 | 0.00% | 0.00% |  |
| D | 85254 | 69115 | 0 | 0 | 0.00% | 0.00% |  |
Top three noisy pixels from each quadrant. If the there are fewer than three noisy pixels in the level2.evt file, extra rows are filled as -1
| Pixel properties | Quadrant properties | ||||||
|---|---|---|---|---|---|---|---|
| Quadrant | DetID | PixID | Counts | Sigma | Mean | Median | Sigma |
| A | 0 | 29 | 3745 | 11.26 | 990 | 925 | 250.4 |
| A | 7 | 110 | 3155 | 8.9 | 990 | 925 | 250.4 |
| A | 0 | 30 | 2862 | 7.73 | 990 | 925 | 250.4 |
| B | 2 | 9 | 3157 | 11.44 | 973 | 925 | 195.1 |
| B | 14 | 254 | 2604 | 8.61 | 973 | 925 | 195.1 |
| B | 3 | 17 | 2535 | 8.25 | 973 | 925 | 195.1 |
| C | 1 | 80 | 2789 | 7.2 | 995 | 923 | 259.3 |
| C | 12 | 241 | 2723 | 6.94 | 995 | 923 | 259.3 |
| C | 1 | 81 | 2720 | 6.93 | 995 | 923 | 259.3 |
| D | 3 | 14 | 2453 | 6.41 | 935 | 850 | 250.2 |
| D | 10 | 189 | 2340 | 5.96 | 935 | 850 | 250.2 |
| D | 3 | 31 | 2335 | 5.94 | 935 | 850 | 250.2 |
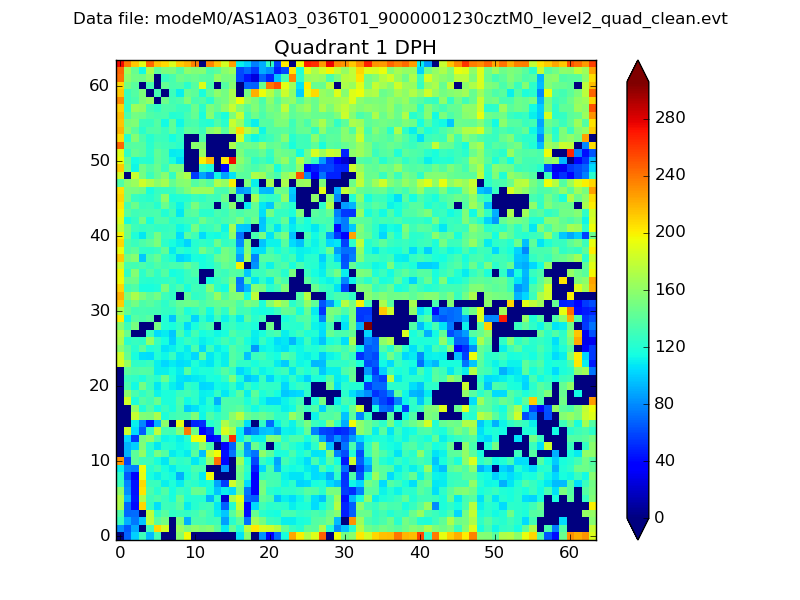
Histogram calculated using DETX and DETY for each event in the final _common_clean file
| Quadrant A |  |
 |
Quadrant B |
|---|---|---|---|
| Quadrant D |  |
 |
Quadrant C |
| Plot type | Count rate plots | Images |
|---|---|---|
| Comparison with Poisson distribution Blue bars denote a histogram of data divided into 1 sec bins. Red curve is a Poisson curve with rate = median count rate of data. |
 |
 |
| Quadrant-wise count rates Data is divided into 100 sec bins |
 |
|
| Module-wise count rates for Quadrant A Data is divided into 100 sec bins |
 |
 |
| Module-wise count rates for Quadrant B Data is divided into 100 sec bins |
 |
 |
| Module-wise count rates for Quadrant C Data is divided into 100 sec bins |
 |
 |
| Module-wise count rates for Quadrant D Data is divided into 100 sec bins |
 |
 |
| Parameter | Plot |
|---|---|
| CZT HV Monitor |  |
| D_VDD | 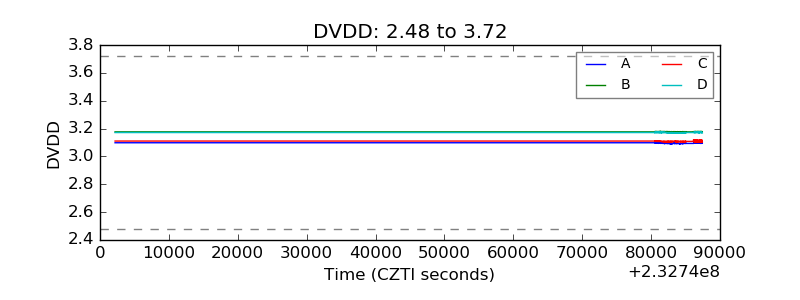 |
| Temperature 1 |  |
| Veto HV Monitor |  |
| Veto LLD |  |
| Alpha Counter |  |
| _CPM_Rate |  |
| CZT Counter |  |
| +2.5 Volts monitor |  |
| +5 Volts monitor |  |
| _ROLL_ROT |  |
| _Roll_DEC |  |
| _Roll_RA |  |
| Veto Counter |  |