| Param | Original file | Final file |
|---|---|---|
| Filename | modeM0/AS1A03_036T01_9000001230_08846cztM0_level2.evt | modeM0/AS1A03_036T01_9000001230_08846cztM0_level2_quad_clean.evt |
| Size (bytes) | 212,693,760 | 46,526,400 |
| Size | 202.8 MB | 44.4 MB |
| Events in quadrant A | 1,796,520 | 303,026 |
| Events in quadrant B | 1,520,156 | 307,507 |
| Events in quadrant C | 1,364,898 | 301,532 |
| Events in quadrant D | 1,563,271 | 291,943 |
| Mode SS | |||
|---|---|---|---|
| Quadrant | BADHDUFLAG | Total packets | Discarded packets |
| A | 0 | 60 | 0 |
| B | 0 | 60 | 0 |
| C | 0 | 60 | 0 |
| D | 0 | 60 | 0 |
| Mode M9 | |||
|---|---|---|---|
| Quadrant | BADHDUFLAG | Total packets | Discarded packets |
| A | 0 | 9 | 0 |
| B | 0 | 9 | 0 |
| C | 0 | 9 | 0 |
| D | 0 | 9 | 0 |
| Mode M0 | |||
|---|---|---|---|
| Quadrant | BADHDUFLAG | Total packets | Discarded packets |
| A | 0 | 7253 | 2 |
| B | 0 | 6317 | 1 |
| C | 0 | 5925 | 1 |
| D | 0 | 6473 | 1 |
| Quadrant | Total seconds | Saturated seconds | Saturation percentage |
|---|---|---|---|
| A | 2861 | 43 | 1.502971% |
| B | 2861 | 64 | 2.236980% |
| C | 2861 | 15 | 0.524292% |
| D | 2861 | 26 | 0.908773% |
Noise dominated data is calculated using 1-second bins in cleaned event files. If a bin has >2000 counts, and if more than 50% of those come from <1% of pixels, then it is considered to be noise-dominated and hence unusable.
| Quadrant | # 1 sec bins | Bins with >0 counts | Bins with >2000 counts | High rate bins dominated by noise | Noise dominated (total time) | Noise dominated (detector-on time) | Marked lightcurve |
|---|---|---|---|---|---|---|---|
| A | 3741 | 2862 | 5 | 5 | 0.13% | 0.17% | 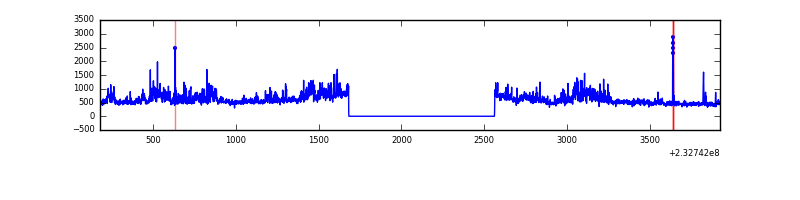 |
| B | 3741 | 2862 | 11 | 11 | 0.29% | 0.38% |  |
| C | 3741 | 2862 | 0 | 0 | 0.00% | 0.00% | 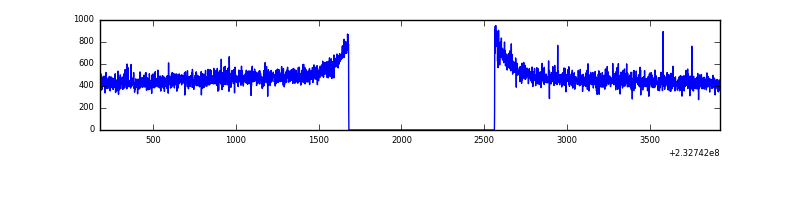 |
| D | 3741 | 2862 | 11 | 11 | 0.29% | 0.38% | 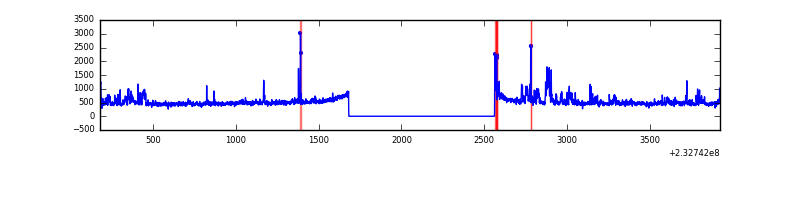 |
Top three noisy pixels from each quadrant. If the there are fewer than three noisy pixels in the level2.evt file, extra rows are filled as -1
| Pixel properties | Quadrant properties | ||||||
|---|---|---|---|---|---|---|---|
| Quadrant | DetID | PixID | Counts | Sigma | Mean | Median | Sigma |
| A | 8 | 5 | 386655 | 5214.18 | 355 | 348 | 74.1 |
| A | 15 | 174 | 25178 | 335.14 | 355 | 348 | 74.1 |
| A | 14 | 239 | 7696 | 99.18 | 355 | 348 | 74.1 |
| B | 4 | 48 | 79395 | 1128.79 | 357 | 347 | 70.0 |
| B | 0 | 246 | 13756 | 191.48 | 357 | 347 | 70.0 |
| B | 0 | 219 | 10201 | 140.71 | 357 | 347 | 70.0 |
| C | 1 | 3 | 3981 | 44.58 | 346 | 347 | 81.5 |
| C | 8 | 128 | 3602 | 39.93 | 346 | 347 | 81.5 |
| C | 13 | 61 | 2606 | 27.71 | 346 | 347 | 81.5 |
| D | 2 | 152 | 87929 | 1024.12 | 343 | 333 | 85.5 |
| D | 1 | 52 | 68260 | 794.16 | 343 | 333 | 85.5 |
| D | 2 | 238 | 41233 | 478.18 | 343 | 333 | 85.5 |
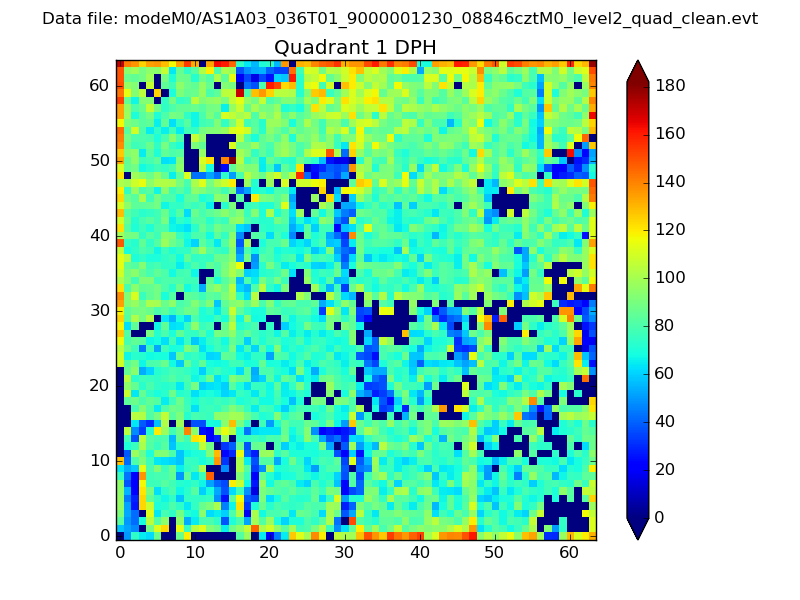
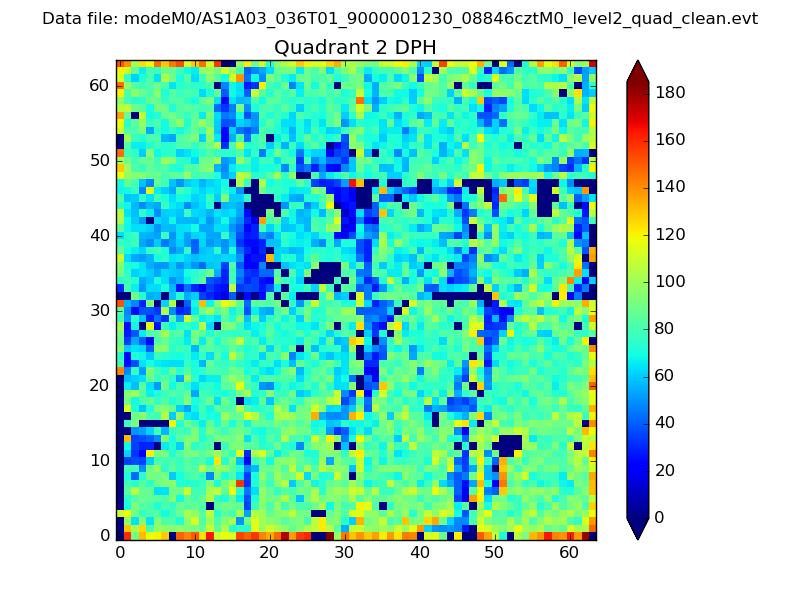
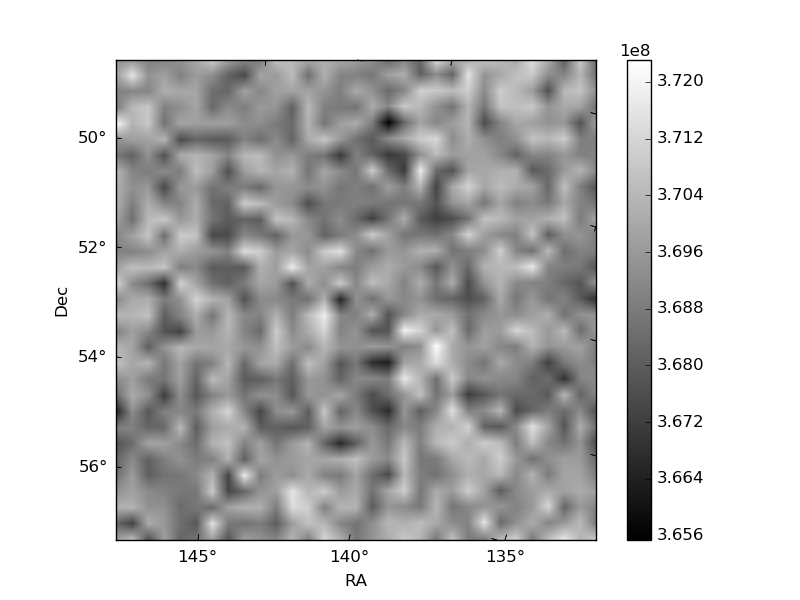
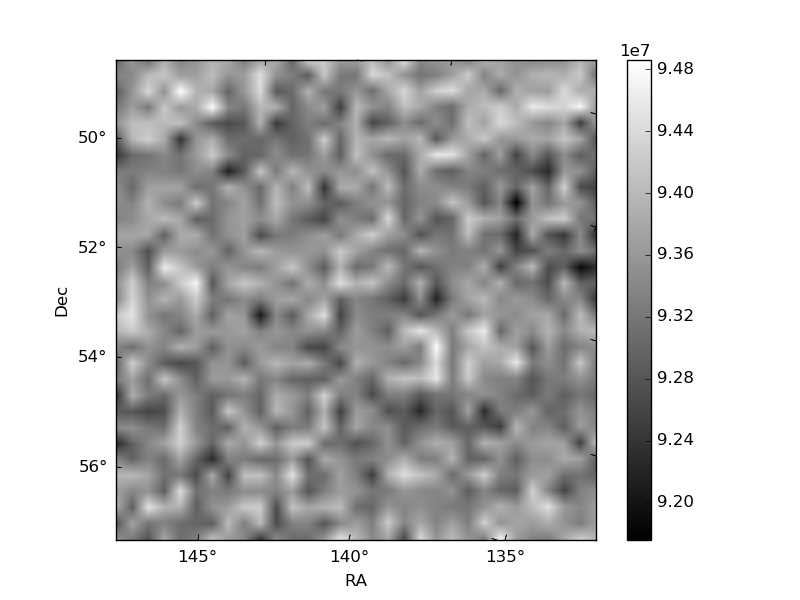
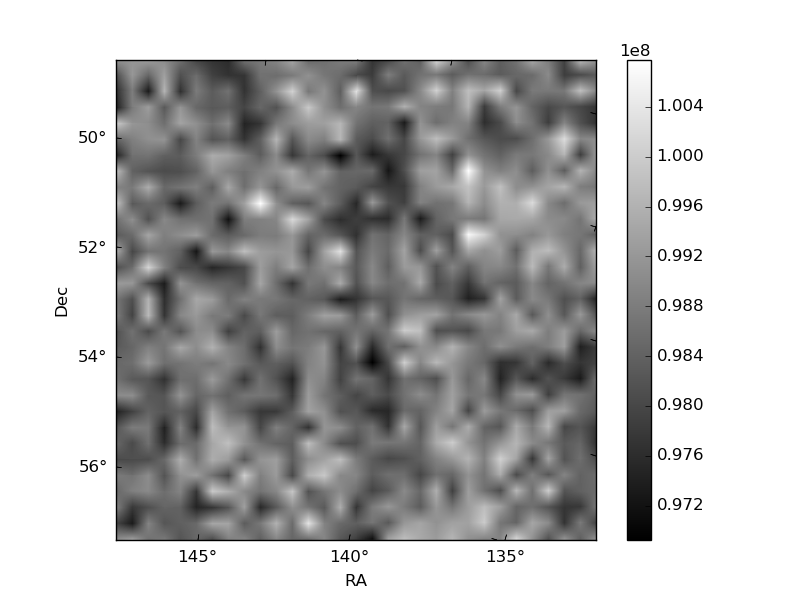
Histogram calculated using DETX and DETY for each event in the final _common_clean file
| Quadrant A | 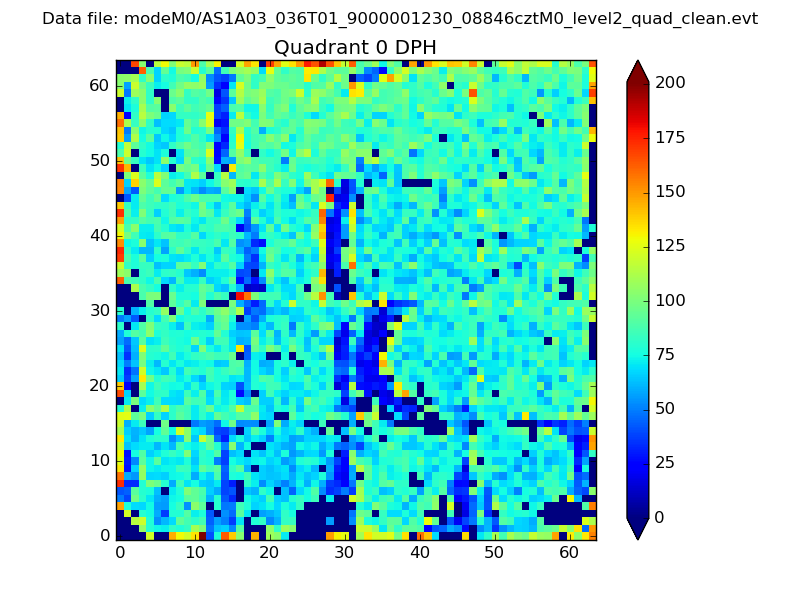 |
 |
Quadrant B |
|---|---|---|---|
| Quadrant D | 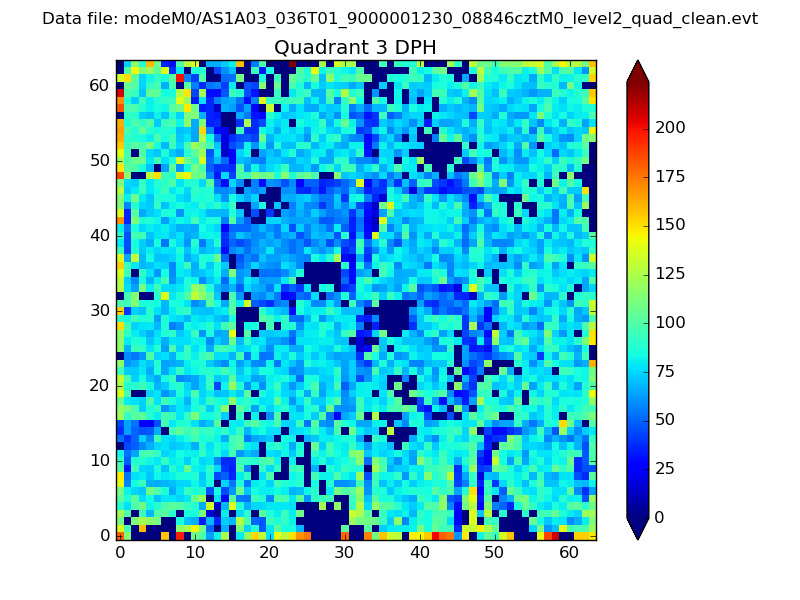 |
 |
Quadrant C |
| Plot type | Count rate plots | Images |
|---|---|---|
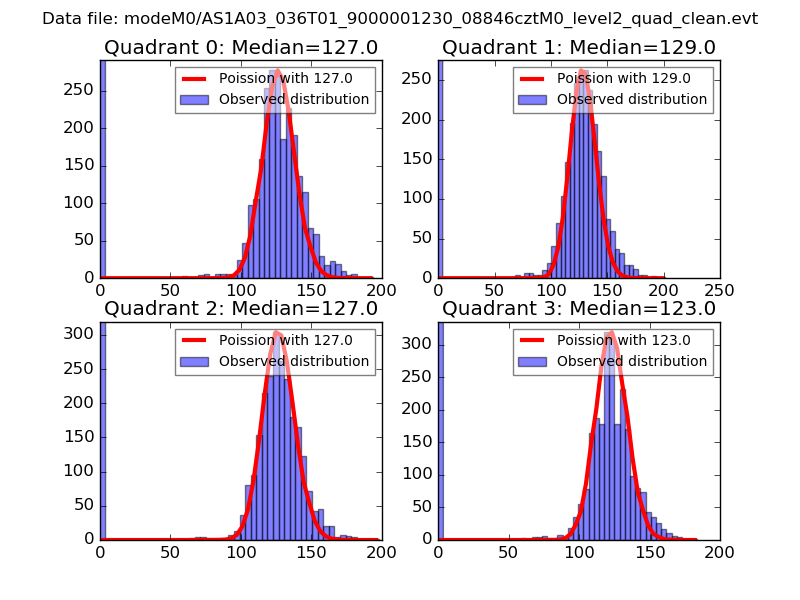
| Comparison with Poisson distribution Blue bars denote a histogram of data divided into 1 sec bins. Red curve is a Poisson curve with rate = median count rate of data. |
 |
 |
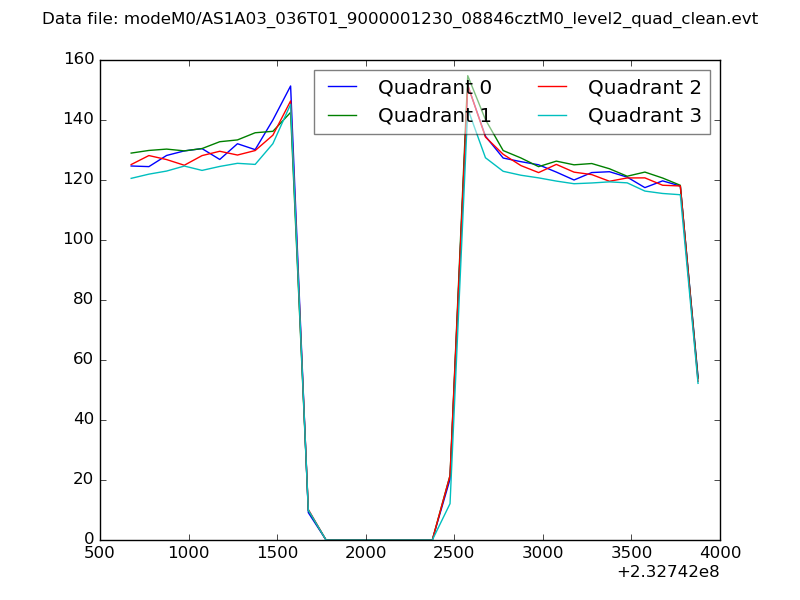
| Quadrant-wise count rates Data is divided into 100 sec bins |
 |
|
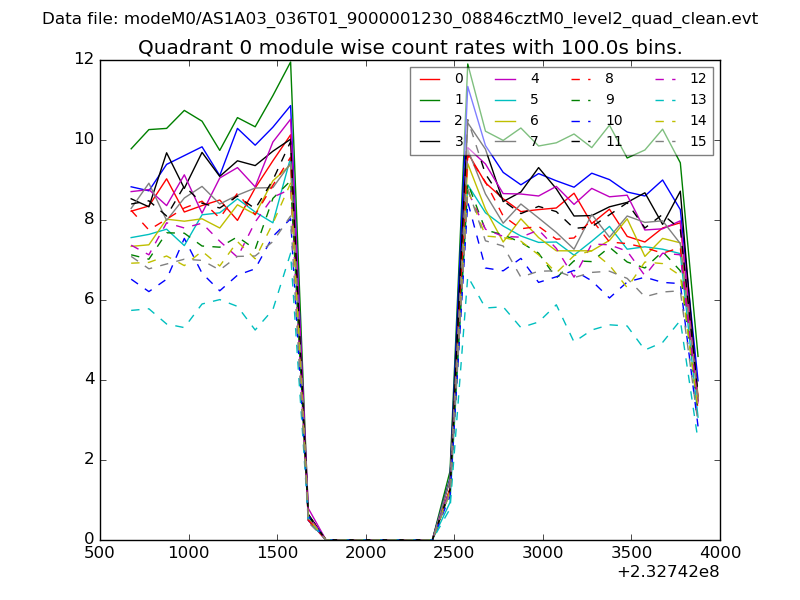
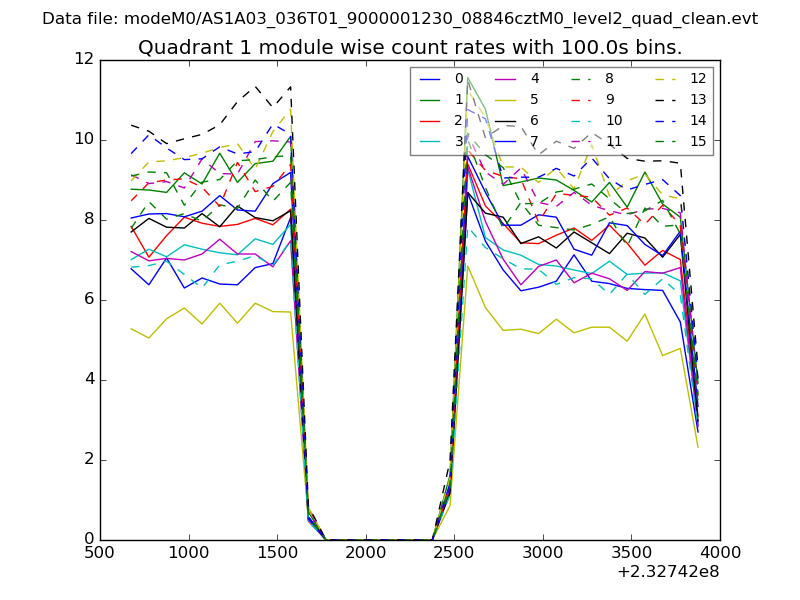
| Module-wise count rates for Quadrant A Data is divided into 100 sec bins |
 |
 |
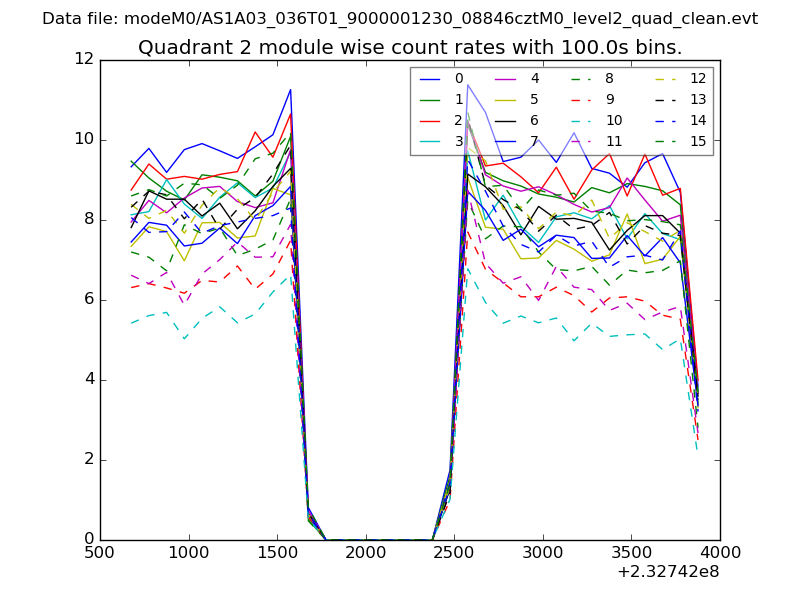
| Module-wise count rates for Quadrant B Data is divided into 100 sec bins |
 |
 |
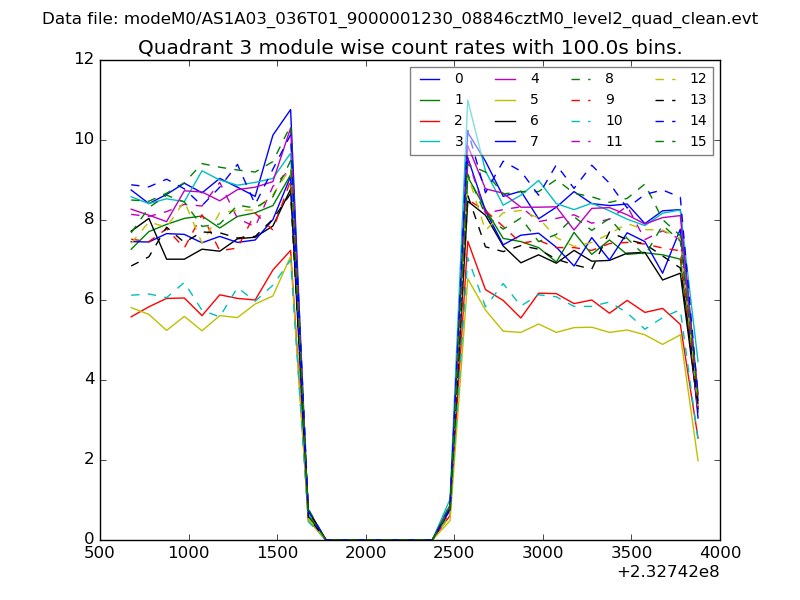
| Module-wise count rates for Quadrant C Data is divided into 100 sec bins |
 |
 |
| Module-wise count rates for Quadrant D Data is divided into 100 sec bins |
 |
 |
| Parameter | Plot |
|---|---|
| CZT HV Monitor | 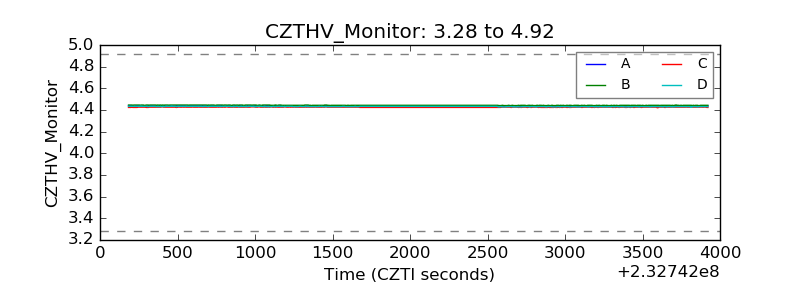 |
| D_VDD | 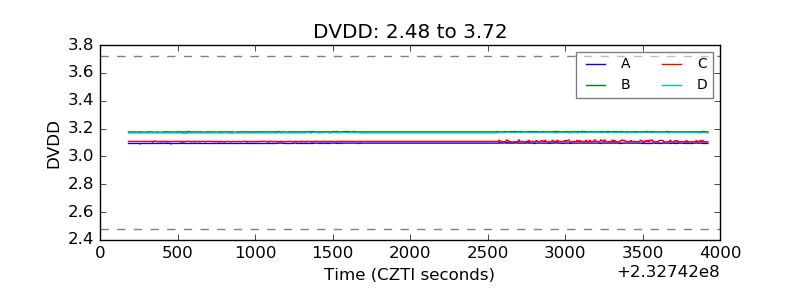 |
| Temperature 1 |  |
| Veto HV Monitor | 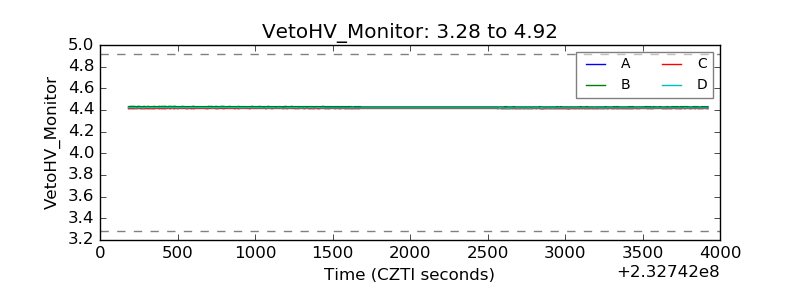 |
| Veto LLD |  |
| Alpha Counter | 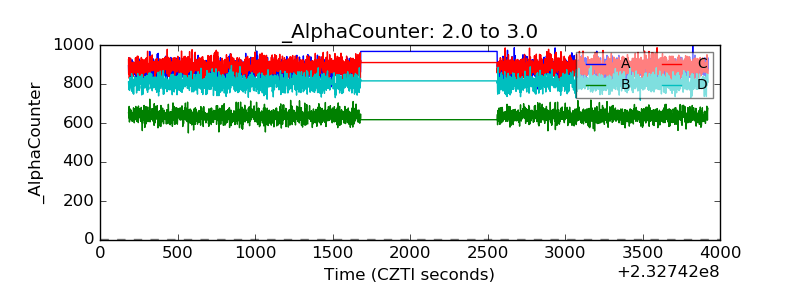 |
| _CPM_Rate | 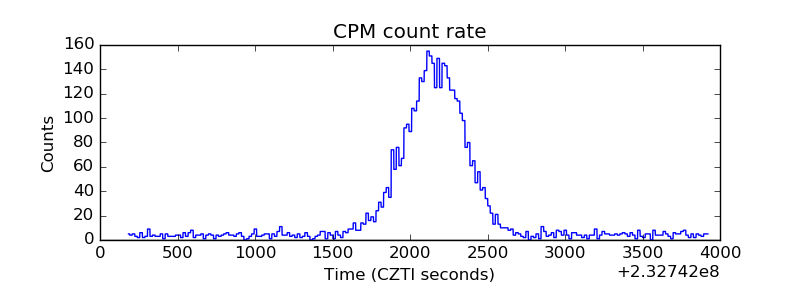 |
| CZT Counter | 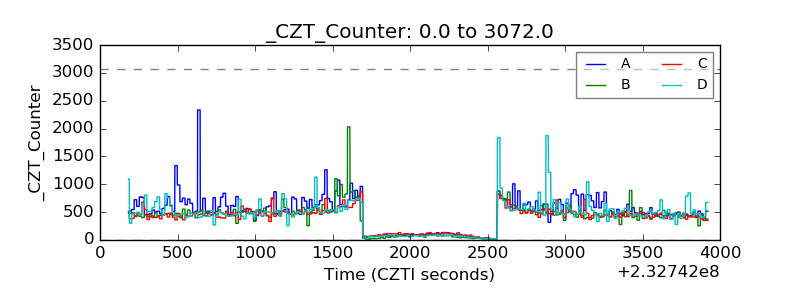 |
| +2.5 Volts monitor |  |
| +5 Volts monitor |  |
| _ROLL_ROT | 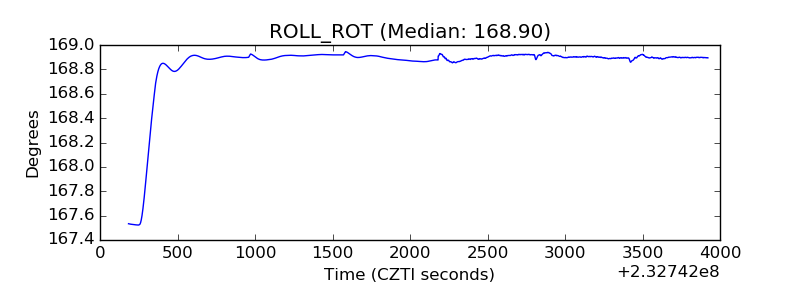 |
| _Roll_DEC | 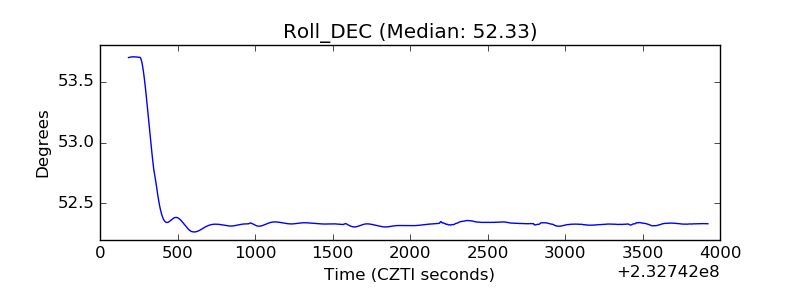 |
| _Roll_RA | 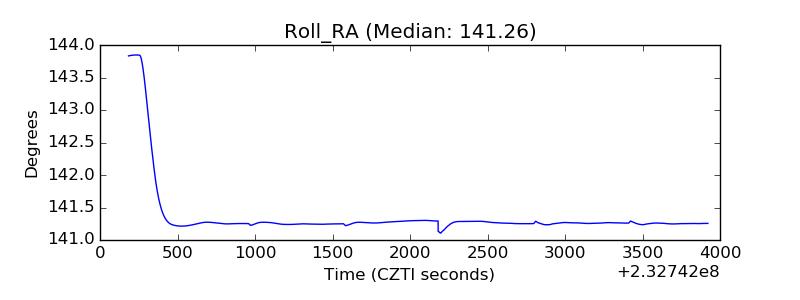 |
| Veto Counter | 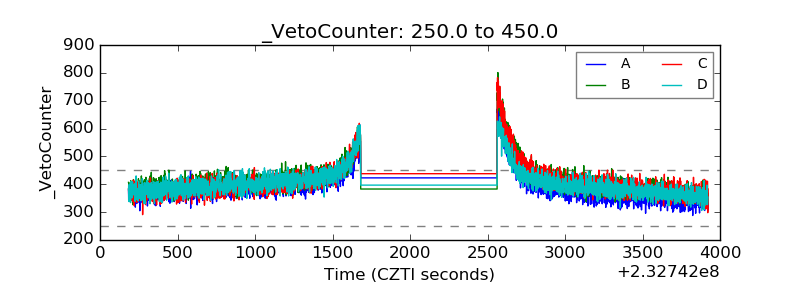 |