| Param | Original file | Final file |
|---|---|---|
| Filename | modeM0/AS1A03_036T01_9000001230_08848cztM0_level2.evt | modeM0/AS1A03_036T01_9000001230_08848cztM0_level2_quad_clean.evt |
| Size (bytes) | 560,249,280 | 107,115,840 |
| Size | 534.3 MB | 102.2 MB |
| Events in quadrant A | 4,477,599 | 668,957 |
| Events in quadrant B | 3,880,907 | 692,870 |
| Events in quadrant C | 3,523,184 | 681,481 |
| Events in quadrant D | 4,555,924 | 657,676 |
| Mode SS | |||
|---|---|---|---|
| Quadrant | BADHDUFLAG | Total packets | Discarded packets |
| A | 0 | 158 | 0 |
| B | 0 | 158 | 0 |
| C | 0 | 158 | 0 |
| D | 0 | 158 | 0 |
| Mode M9 | |||
|---|---|---|---|
| Quadrant | BADHDUFLAG | Total packets | Discarded packets |
| A | 0 | 7 | 0 |
| B | 0 | 7 | 0 |
| C | 0 | 7 | 0 |
| D | 0 | 7 | 0 |
| Mode M0 | |||
|---|---|---|---|
| Quadrant | BADHDUFLAG | Total packets | Discarded packets |
| A | 0 | 18868 | 3 |
| B | 0 | 16937 | 2 |
| C | 0 | 16121 | 2 |
| D | 0 | 19080 | 2 |
| Quadrant | Total seconds | Saturated seconds | Saturation percentage |
|---|---|---|---|
| A | 7815 | 272 | 3.480486% |
| B | 7815 | 146 | 1.868202% |
| C | 7815 | 30 | 0.383877% |
| D | 7815 | 89 | 1.138836% |
Noise dominated data is calculated using 1-second bins in cleaned event files. If a bin has >2000 counts, and if more than 50% of those come from <1% of pixels, then it is considered to be noise-dominated and hence unusable.
| Quadrant | # 1 sec bins | Bins with >0 counts | Bins with >2000 counts | High rate bins dominated by noise | Noise dominated (total time) | Noise dominated (detector-on time) | Marked lightcurve |
|---|---|---|---|---|---|---|---|
| A | 8450 | 7817 | 158 | 158 | 1.87% | 2.02% | 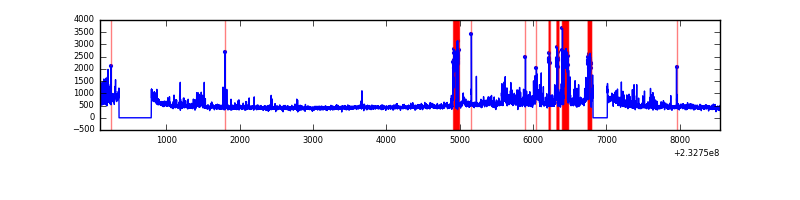 |
| B | 8450 | 7817 | 10 | 10 | 0.12% | 0.13% | 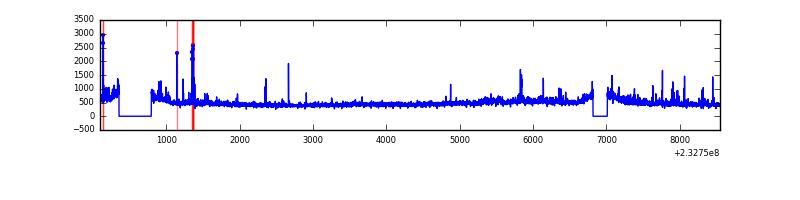 |
| C | 8450 | 7817 | 1 | 1 | 0.01% | 0.01% | 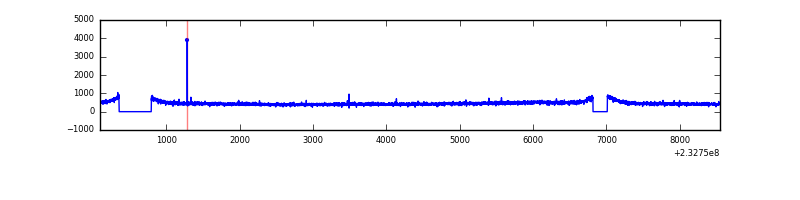 |
| D | 8450 | 7817 | 33 | 33 | 0.39% | 0.42% | 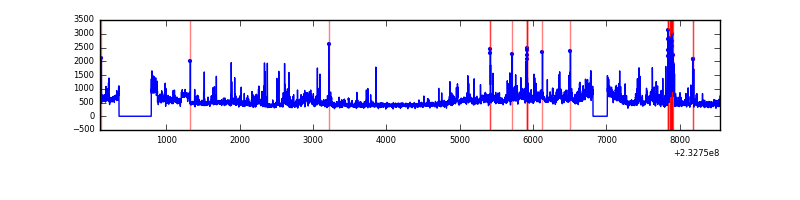 |
Top three noisy pixels from each quadrant. If the there are fewer than three noisy pixels in the level2.evt file, extra rows are filled as -1
| Pixel properties | Quadrant properties | ||||||
|---|---|---|---|---|---|---|---|
| Quadrant | DetID | PixID | Counts | Sigma | Mean | Median | Sigma |
| A | 15 | 174 | 510250 | 2743.25 | 901 | 880 | 185.7 |
| A | 8 | 5 | 443923 | 2386.04 | 901 | 880 | 185.7 |
| A | 13 | 251 | 22466 | 116.25 | 901 | 880 | 185.7 |
| B | 0 | 214 | 56878 | 316.43 | 925 | 901 | 176.9 |
| B | 5 | 255 | 48571 | 269.47 | 925 | 901 | 176.9 |
| B | 4 | 80 | 42205 | 233.48 | 925 | 901 | 176.9 |
| C | 1 | 3 | 7103 | 29.68 | 898 | 900 | 209.0 |
| C | 13 | 61 | 6896 | 28.69 | 898 | 900 | 209.0 |
| C | 8 | 128 | 4263 | 16.09 | 898 | 900 | 209.0 |
| D | 2 | 152 | 426337 | 1768.97 | 887 | 864 | 240.5 |
| D | 1 | 52 | 269155 | 1115.46 | 887 | 864 | 240.5 |
| D | 13 | 105 | 170376 | 704.77 | 887 | 864 | 240.5 |
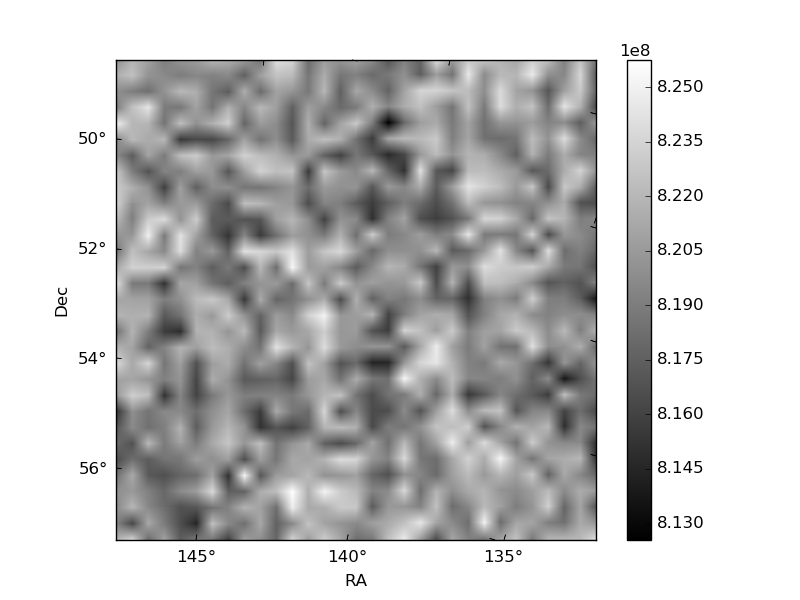
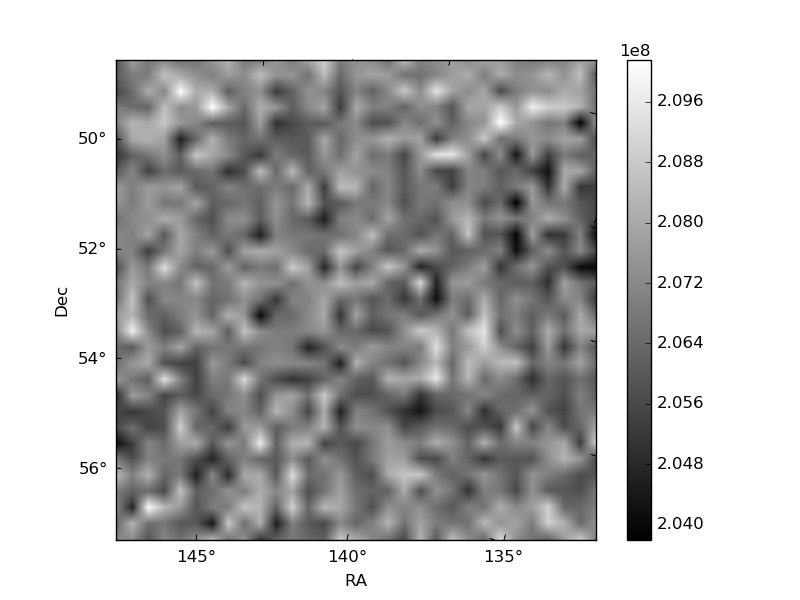
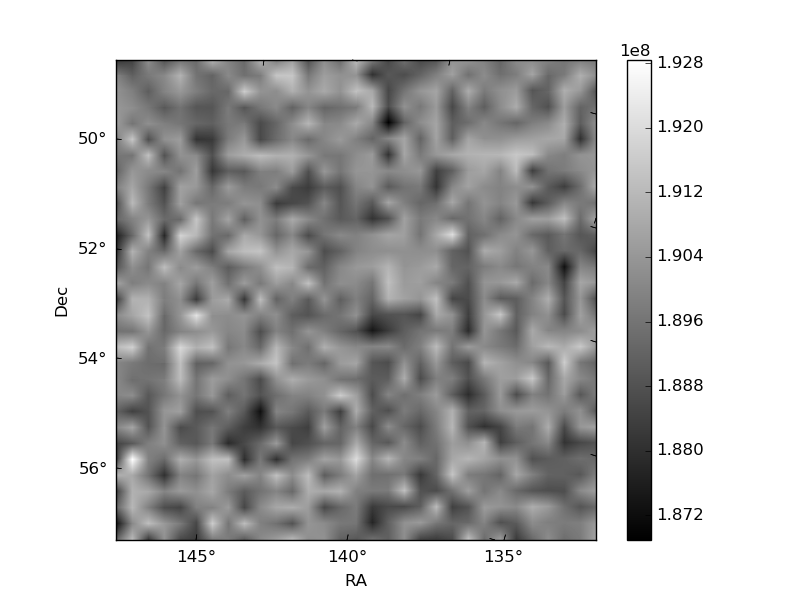
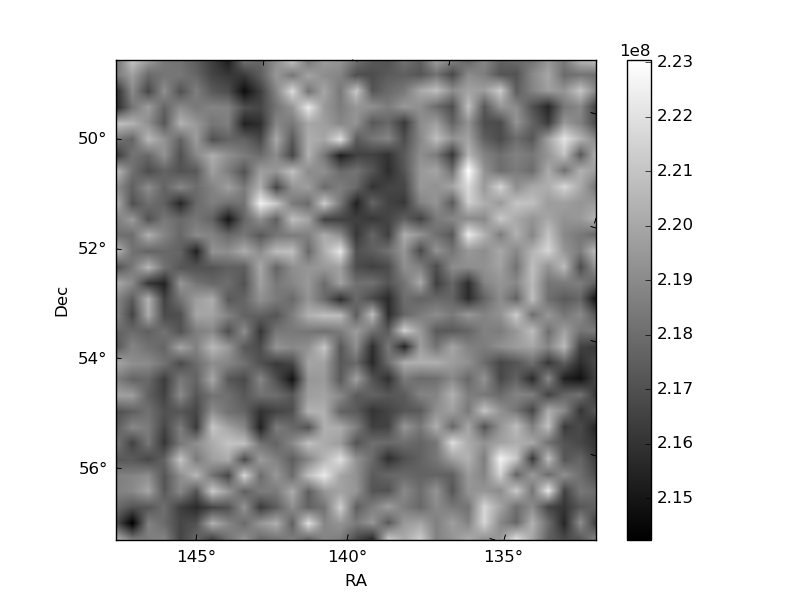
Histogram calculated using DETX and DETY for each event in the final _common_clean file
| Quadrant A | 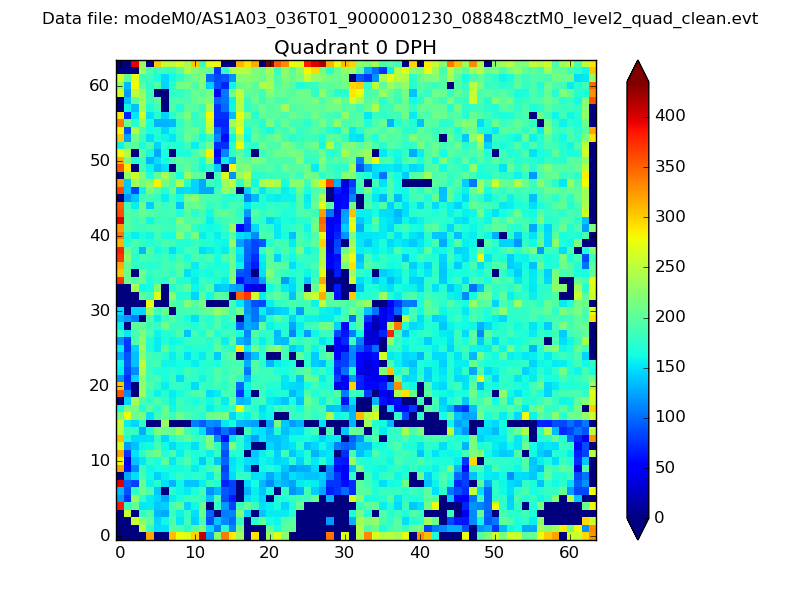 |
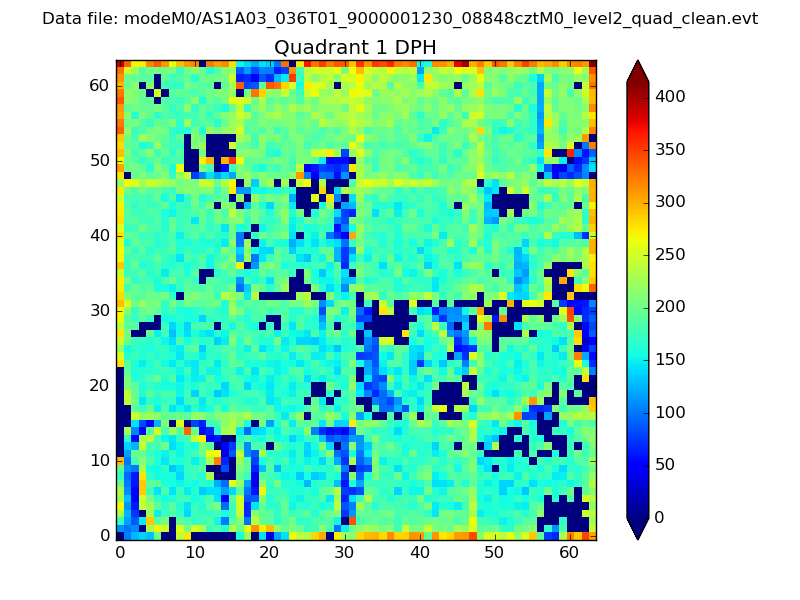 |
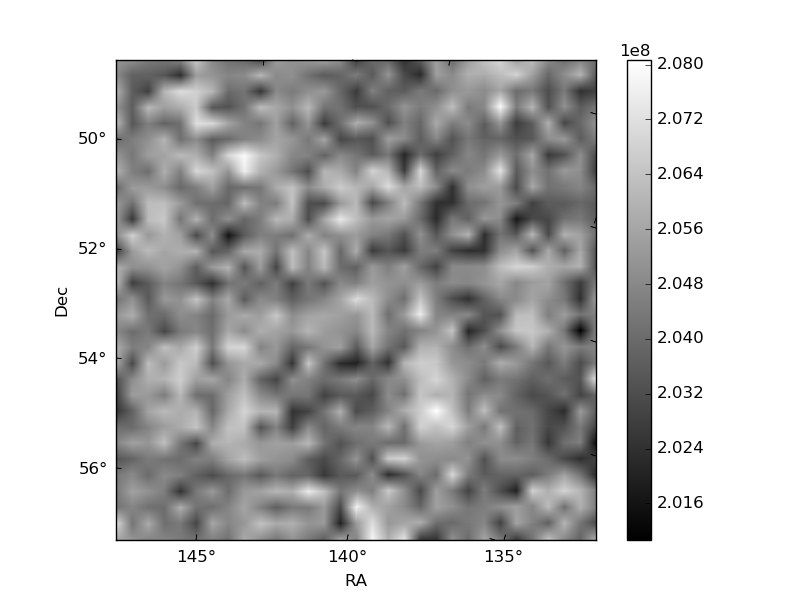
Quadrant B |
|---|---|---|---|
| Quadrant D | 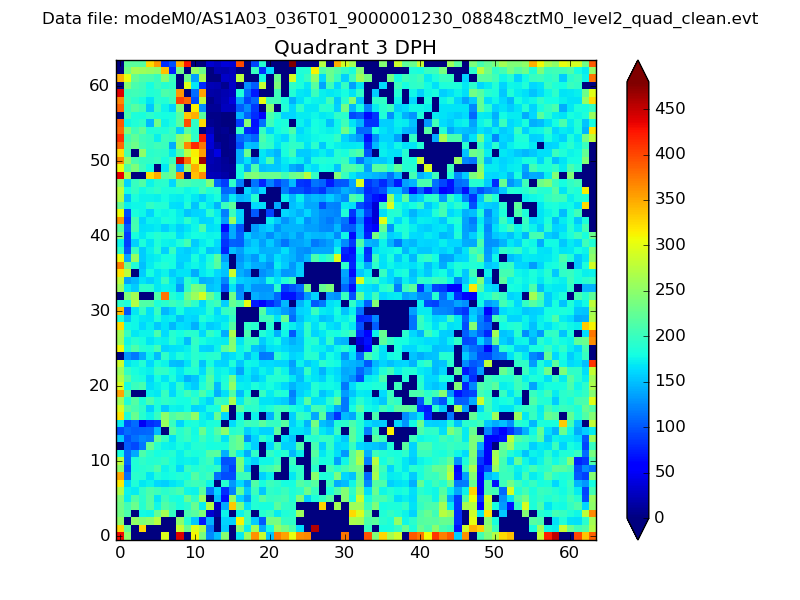 |
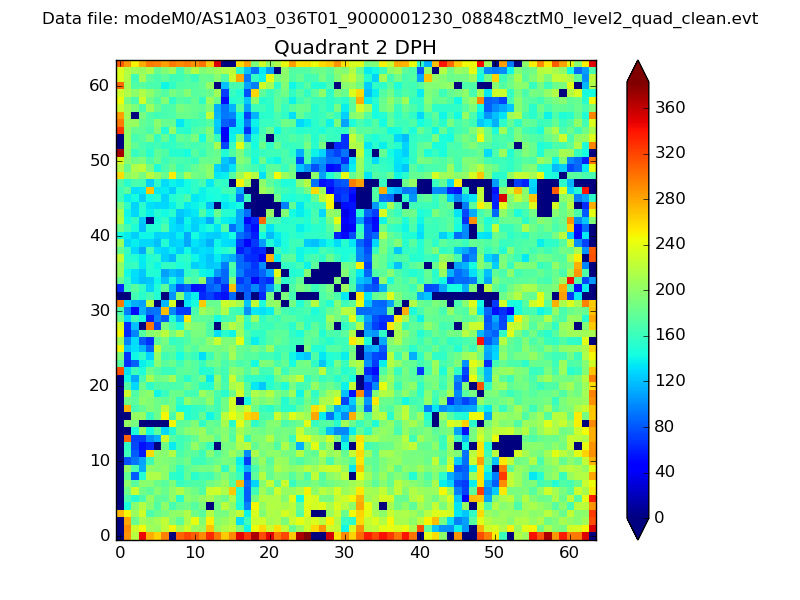 |
Quadrant C |
| Plot type | Count rate plots | Images |
|---|---|---|
| Comparison with Poisson distribution Blue bars denote a histogram of data divided into 1 sec bins. Red curve is a Poisson curve with rate = median count rate of data. |
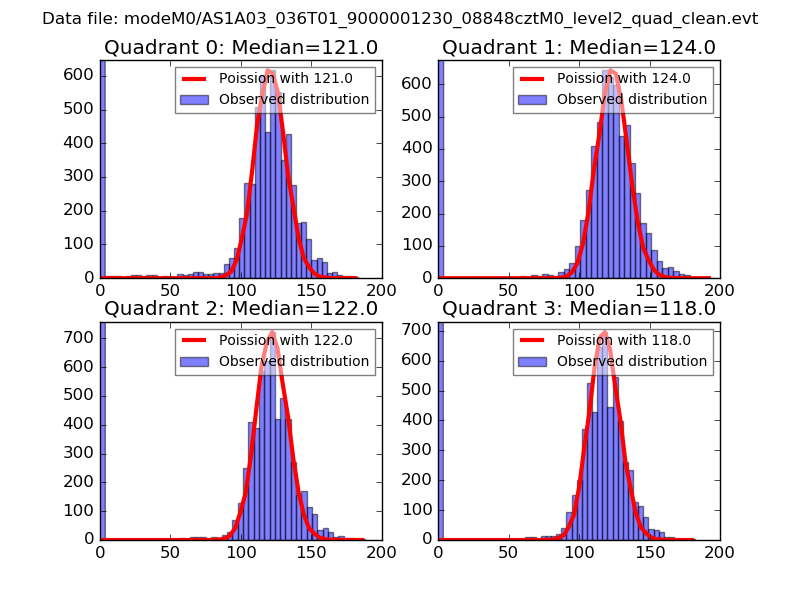 |
 |
| Quadrant-wise count rates Data is divided into 100 sec bins |
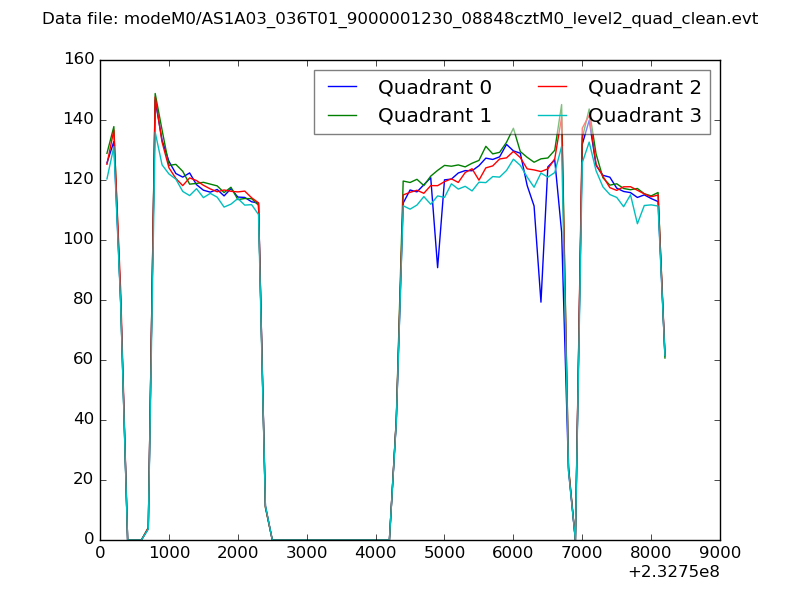 |
|
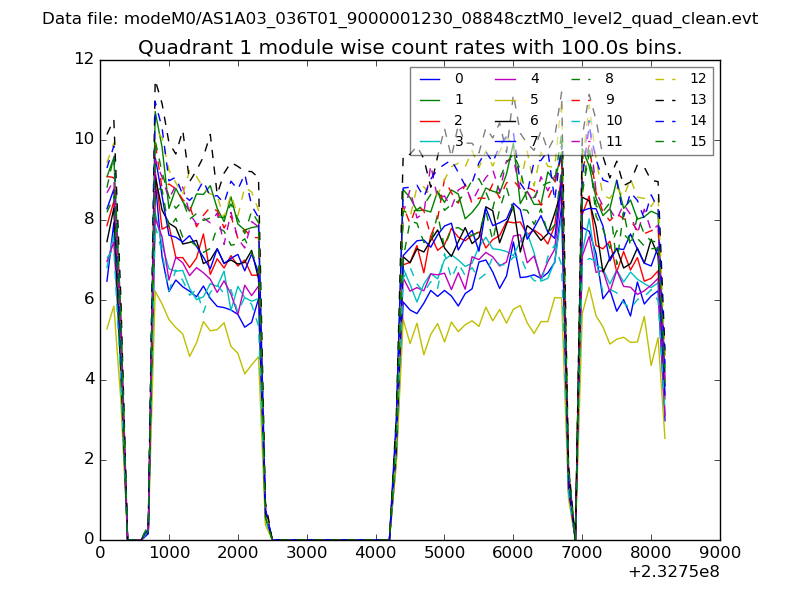
| Module-wise count rates for Quadrant A Data is divided into 100 sec bins |
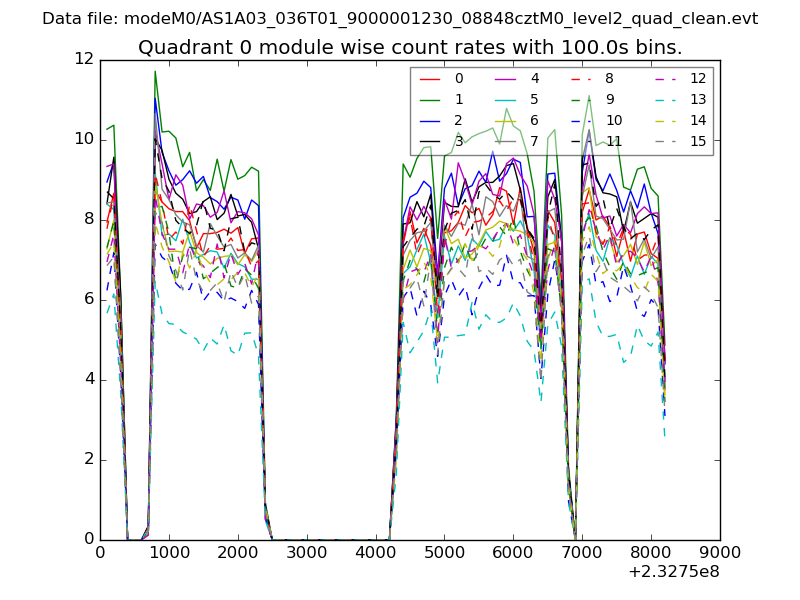 |
 |
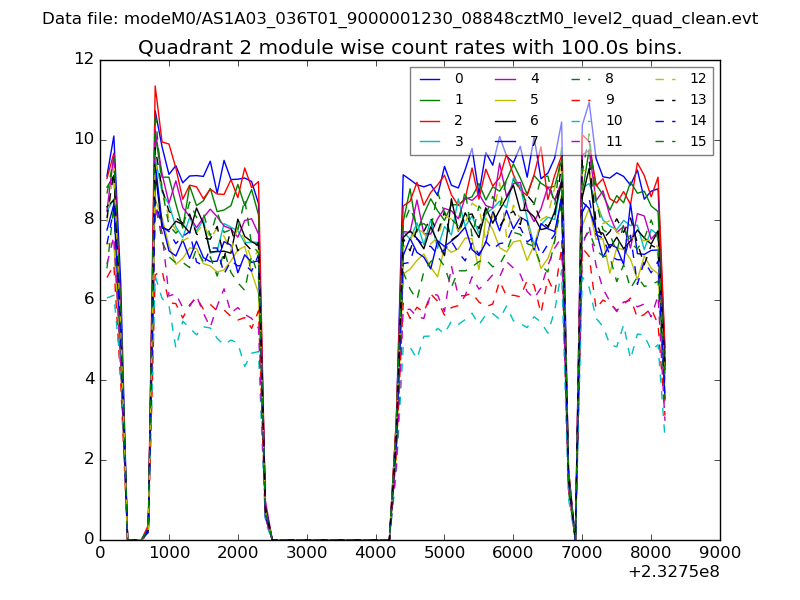
| Module-wise count rates for Quadrant B Data is divided into 100 sec bins |
 |
 |
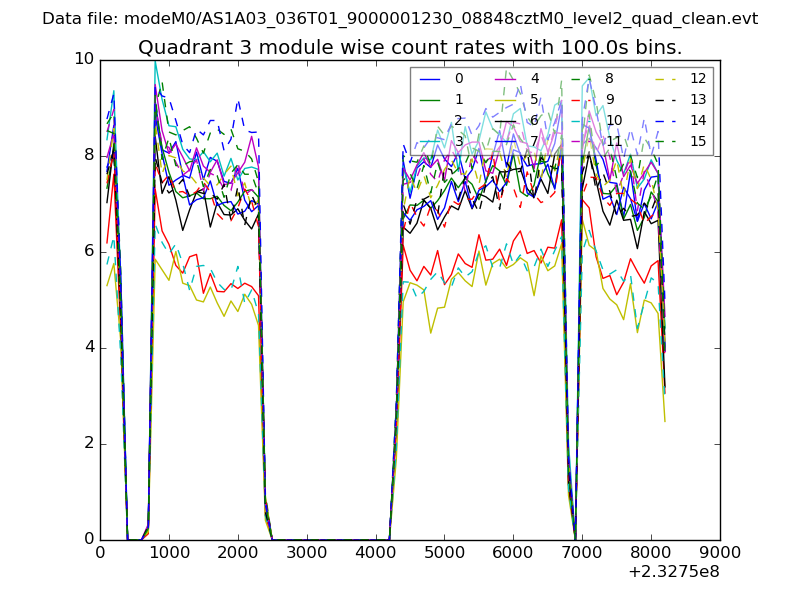
| Module-wise count rates for Quadrant C Data is divided into 100 sec bins |
 |
 |
| Module-wise count rates for Quadrant D Data is divided into 100 sec bins |
 |
 |
| Parameter | Plot |
|---|---|
| CZT HV Monitor | 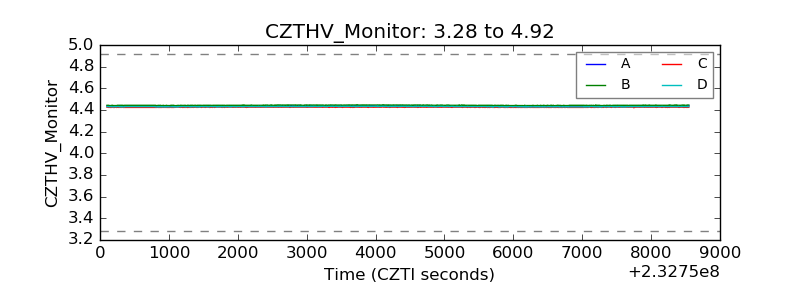 |
| D_VDD | 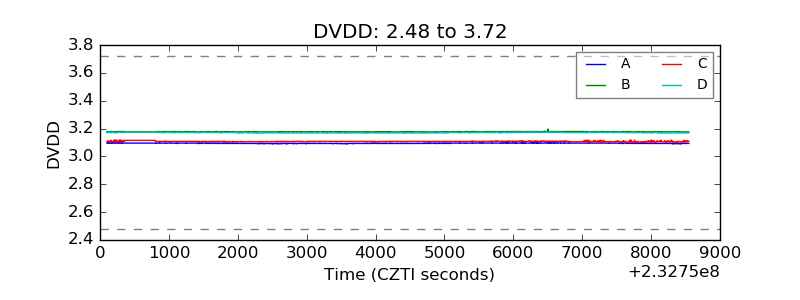 |
| Temperature 1 |  |
| Veto HV Monitor | 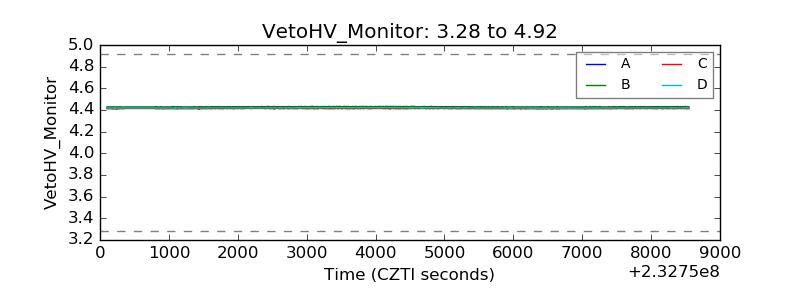 |
| Veto LLD | 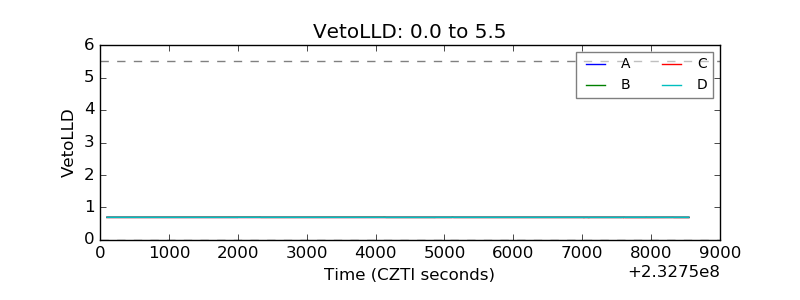 |
| Alpha Counter | 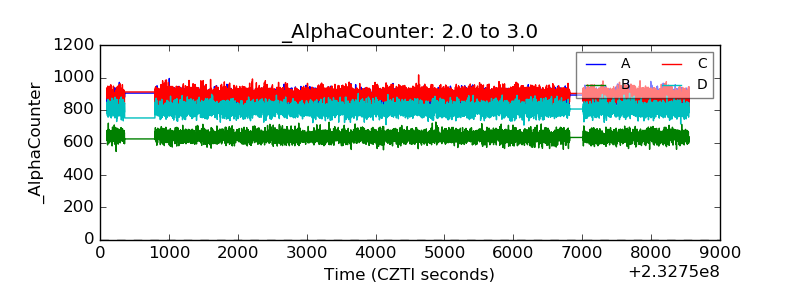 |
| _CPM_Rate | 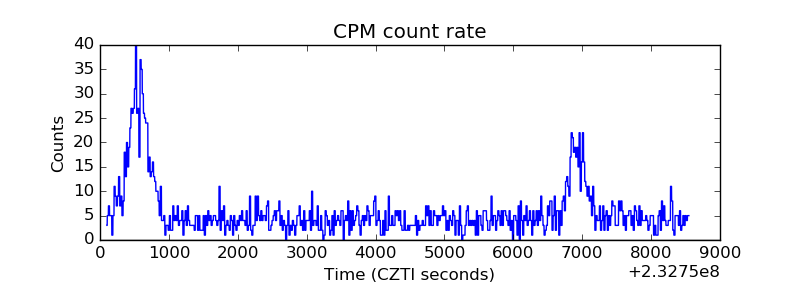 |
| CZT Counter | 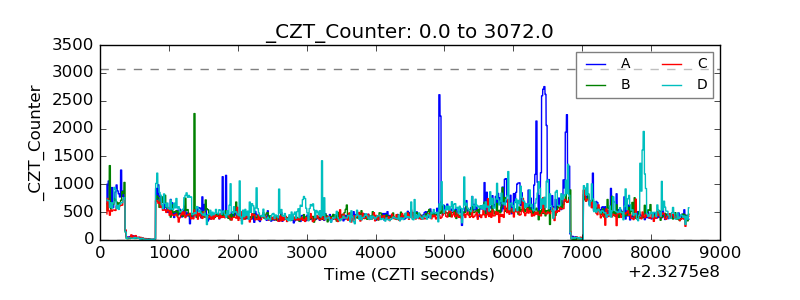 |
| +2.5 Volts monitor |  |
| +5 Volts monitor |  |
| _ROLL_ROT | 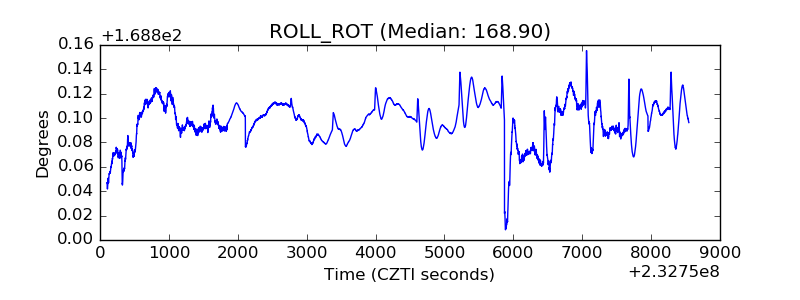 |
| _Roll_DEC | 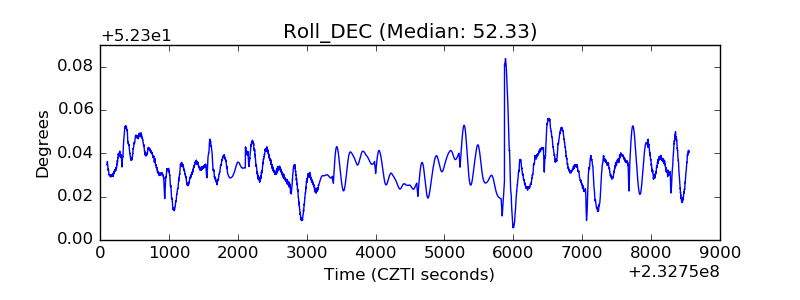 |
| _Roll_RA | 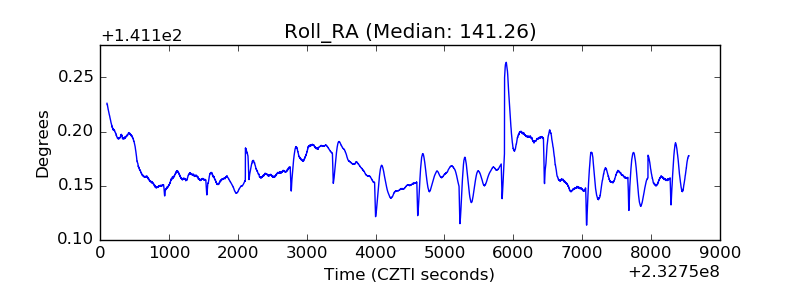 |
| Veto Counter | 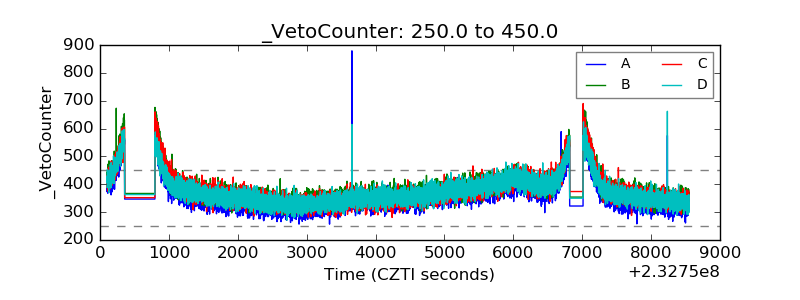 |