| Param | Original file | Final file |
|---|---|---|
| Filename | modeM0/AS1A03_036T01_9000001230_08851cztM0_level2.evt | modeM0/AS1A03_036T01_9000001230_08851cztM0_level2_quad_clean.evt |
| Size (bytes) | 689,129,280 | 113,904,000 |
| Size | 657.2 MB | 108.6 MB |
| Events in quadrant A | 6,090,953 | 688,452 |
| Events in quadrant B | 4,896,021 | 713,343 |
| Events in quadrant C | 4,212,089 | 702,654 |
| Events in quadrant D | 5,015,600 | 674,478 |
| Mode SS | |||
|---|---|---|---|
| Quadrant | BADHDUFLAG | Total packets | Discarded packets |
| A | 0 | 204 | 4 |
| B | 0 | 204 | 4 |
| C | 0 | 204 | 2 |
| D | 0 | 204 | 2 |
| Mode M9 | |||
|---|---|---|---|
| Quadrant | BADHDUFLAG | Total packets | Discarded packets |
| A | 0 | 8 | 0 |
| B | 0 | 8 | 0 |
| C | 0 | 8 | 0 |
| D | 0 | 8 | 0 |
| Mode M0 | |||
|---|---|---|---|
| Quadrant | BADHDUFLAG | Total packets | Discarded packets |
| A | 0 | 25351 | 803 |
| B | 0 | 21597 | 574 |
| C | 0 | 20230 | 603 |
| D | 0 | 22168 | 575 |
| Quadrant | Total seconds | Saturated seconds | Saturation percentage |
|---|---|---|---|
| A | 9639 | 275 | 2.852993% |
| B | 9677 | 180 | 1.860081% |
| C | 9647 | 71 | 0.735980% |
| D | 9681 | 92 | 0.950315% |
Noise dominated data is calculated using 1-second bins in cleaned event files. If a bin has >2000 counts, and if more than 50% of those come from <1% of pixels, then it is considered to be noise-dominated and hence unusable.
| Quadrant | # 1 sec bins | Bins with >0 counts | Bins with >2000 counts | High rate bins dominated by noise | Noise dominated (total time) | Noise dominated (detector-on time) | Marked lightcurve |
|---|---|---|---|---|---|---|---|
| A | 10727 | 9837 | 98 | 98 | 0.91% | 1.00% | 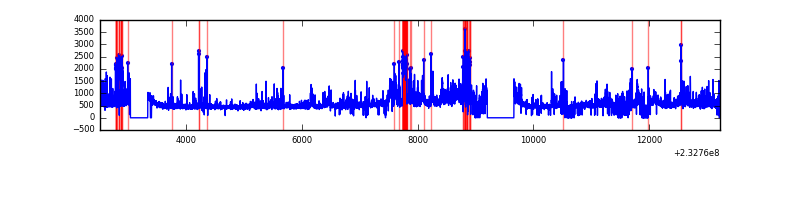 |
| B | 10727 | 9862 | 21 | 21 | 0.20% | 0.21% | 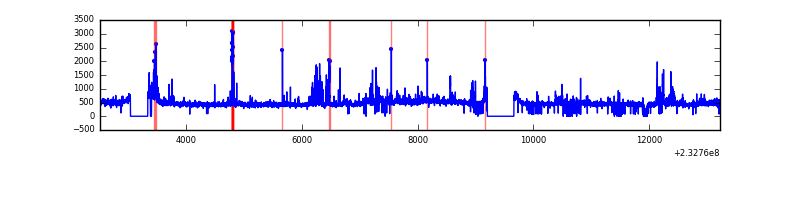 |
| C | 10727 | 9848 | 0 | 0 | 0.00% | 0.00% | 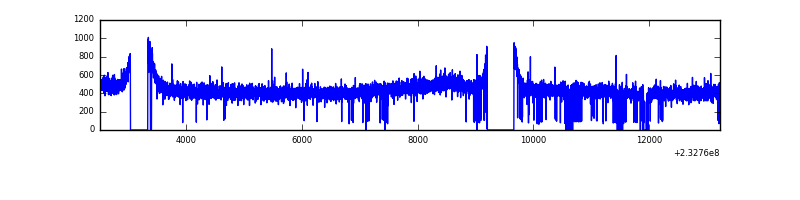 |
| D | 10727 | 9863 | 18 | 18 | 0.17% | 0.18% | 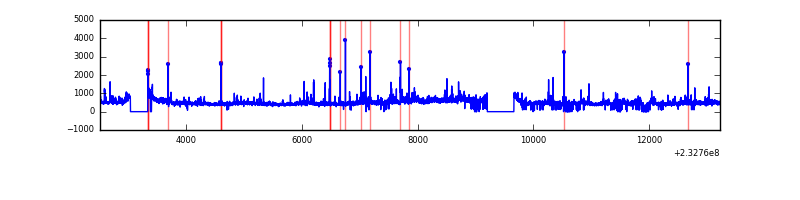 |
Top three noisy pixels from each quadrant. If the there are fewer than three noisy pixels in the level2.evt file, extra rows are filled as -1
| Pixel properties | Quadrant properties | ||||||
|---|---|---|---|---|---|---|---|
| Quadrant | DetID | PixID | Counts | Sigma | Mean | Median | Sigma |
| A | 8 | 5 | 1562737 | 7019.07 | 1098 | 1073 | 222.5 |
| A | 15 | 236 | 119542 | 532.47 | 1098 | 1073 | 222.5 |
| A | 15 | 174 | 78232 | 346.8 | 1098 | 1073 | 222.5 |
| B | 4 | 48 | 183994 | 857.04 | 1115 | 1087 | 213.4 |
| B | 10 | 252 | 87430 | 404.58 | 1115 | 1087 | 213.4 |
| B | 0 | 214 | 79260 | 366.29 | 1115 | 1087 | 213.4 |
| C | 13 | 61 | 8309 | 28.92 | 1077 | 1080 | 250.0 |
| C | 12 | 4 | 3914 | 11.34 | 1077 | 1080 | 250.0 |
| C | 14 | 67 | 3180 | 8.4 | 1077 | 1080 | 250.0 |
| D | 2 | 152 | 311803 | 1187.52 | 1079 | 1047 | 261.7 |
| D | 8 | 195 | 173791 | 660.12 | 1079 | 1047 | 261.7 |
| D | 11 | 129 | 129280 | 490.03 | 1079 | 1047 | 261.7 |
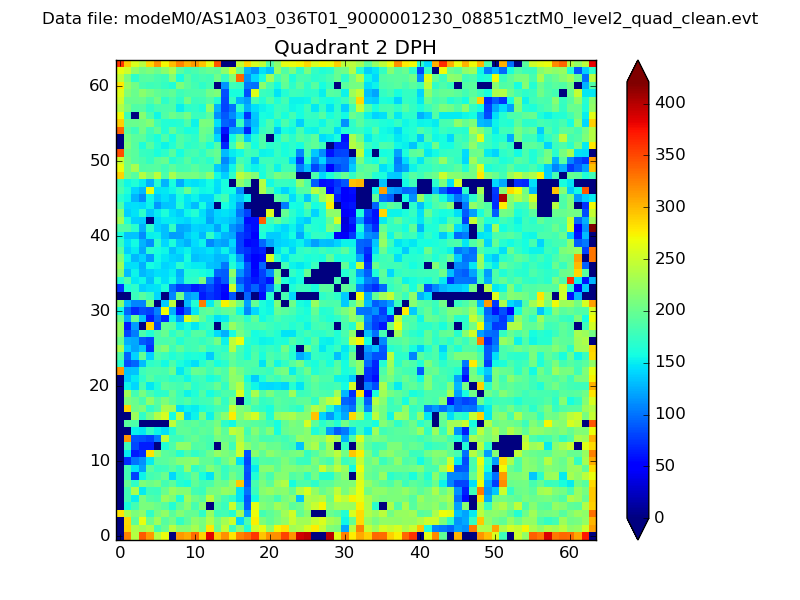
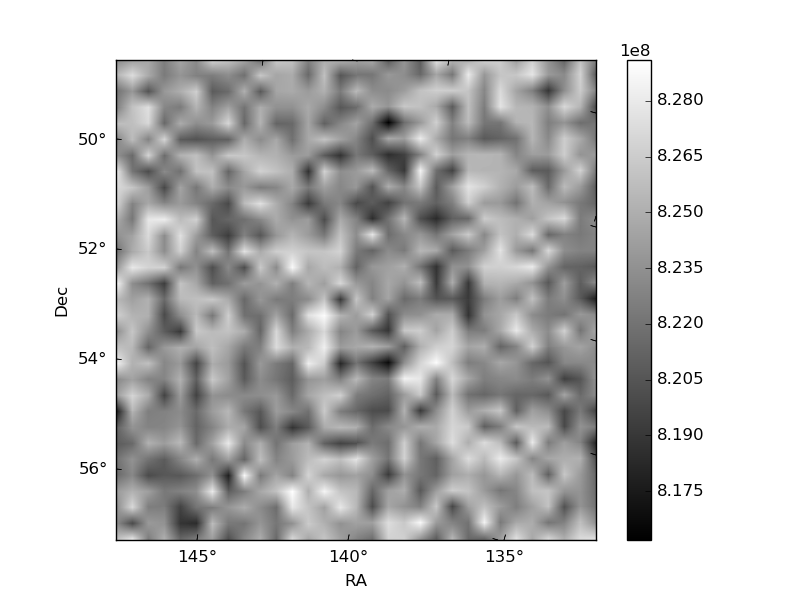
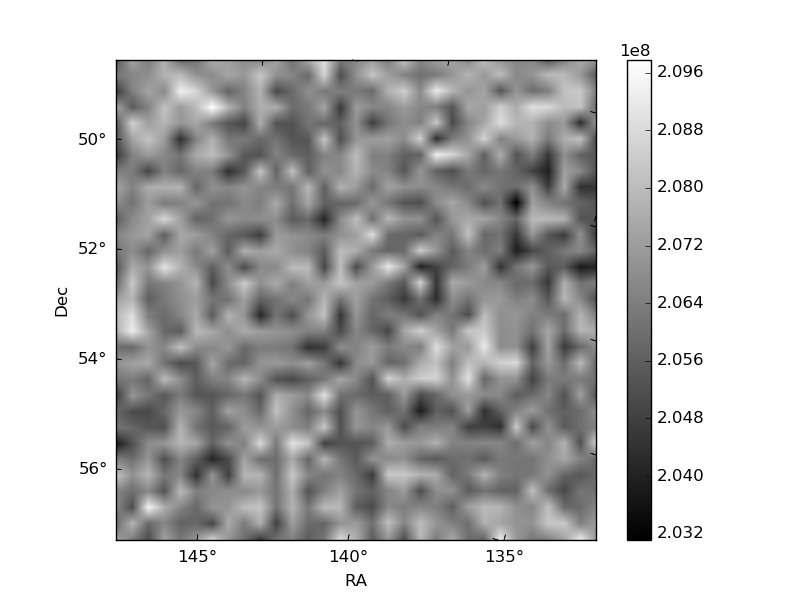
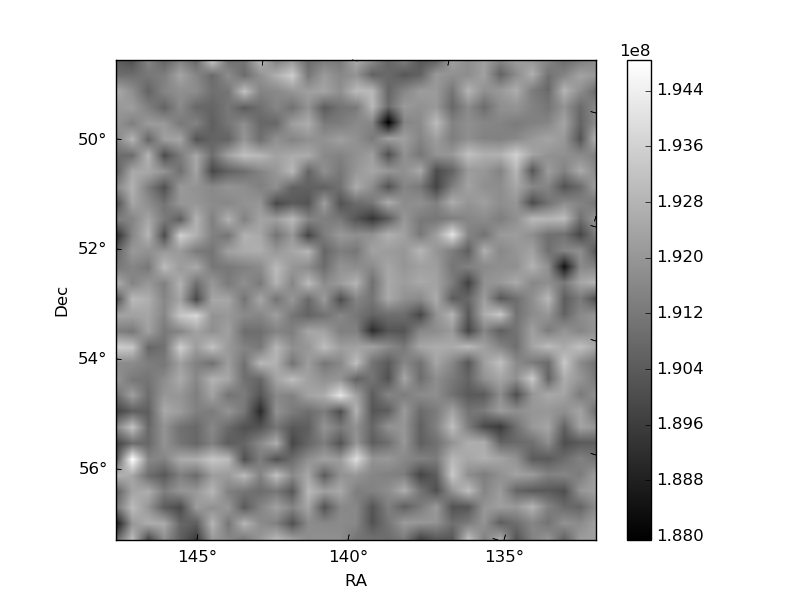
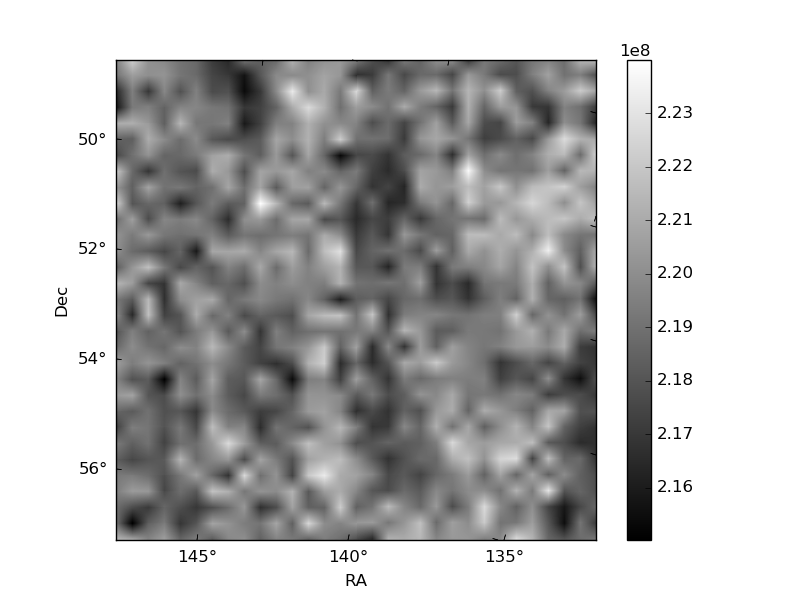
Histogram calculated using DETX and DETY for each event in the final _common_clean file
| Quadrant A | 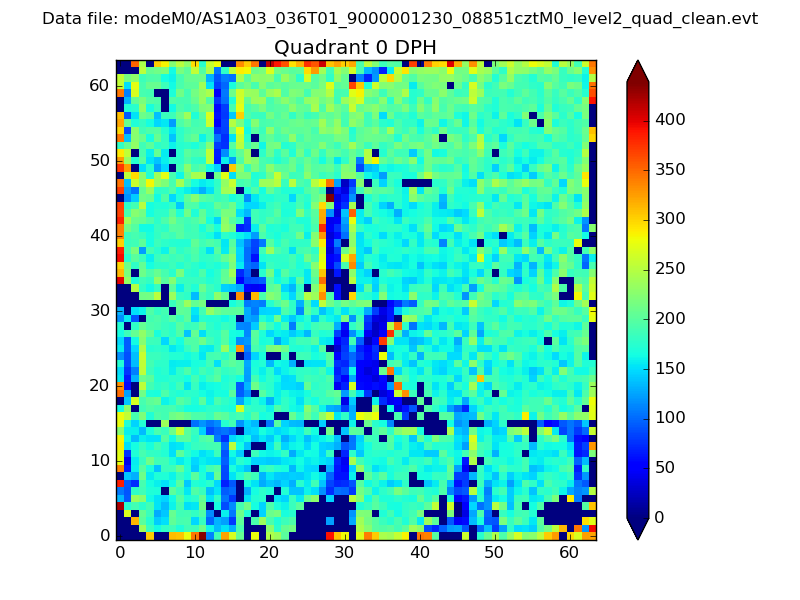 |
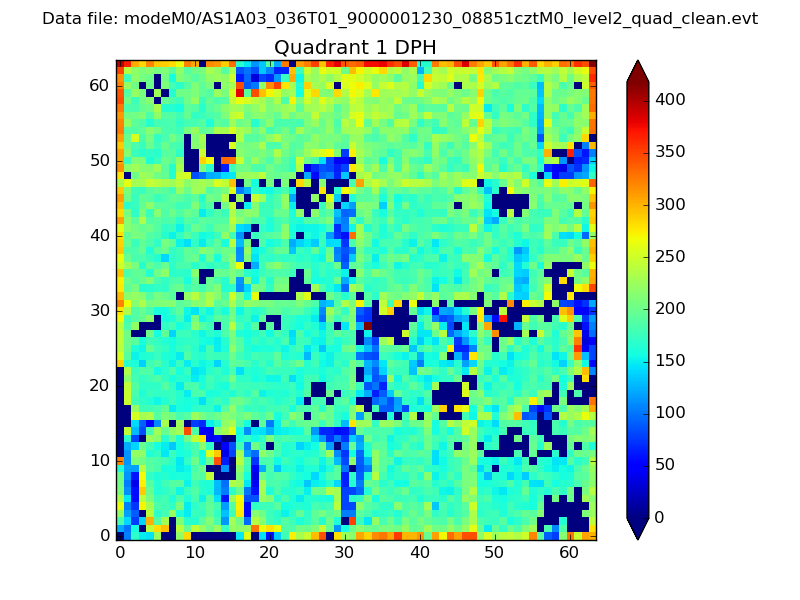 |
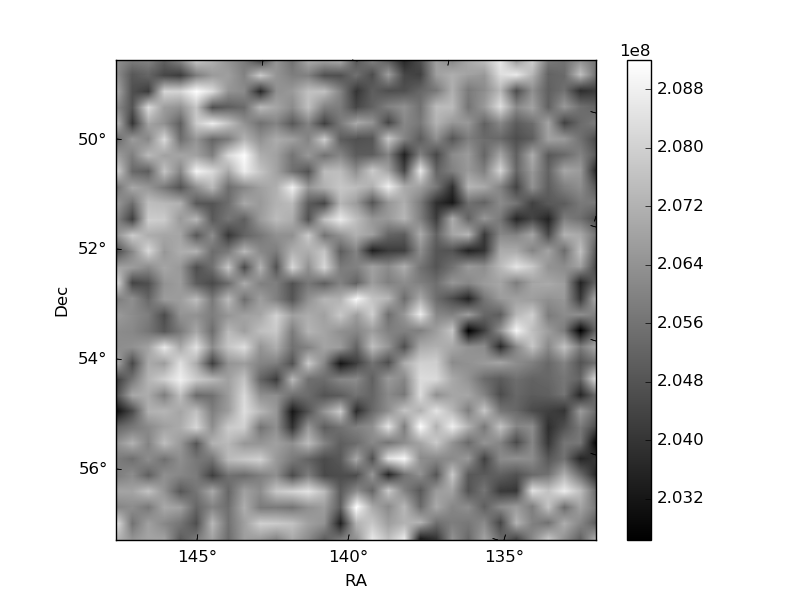
Quadrant B |
|---|---|---|---|
| Quadrant D | 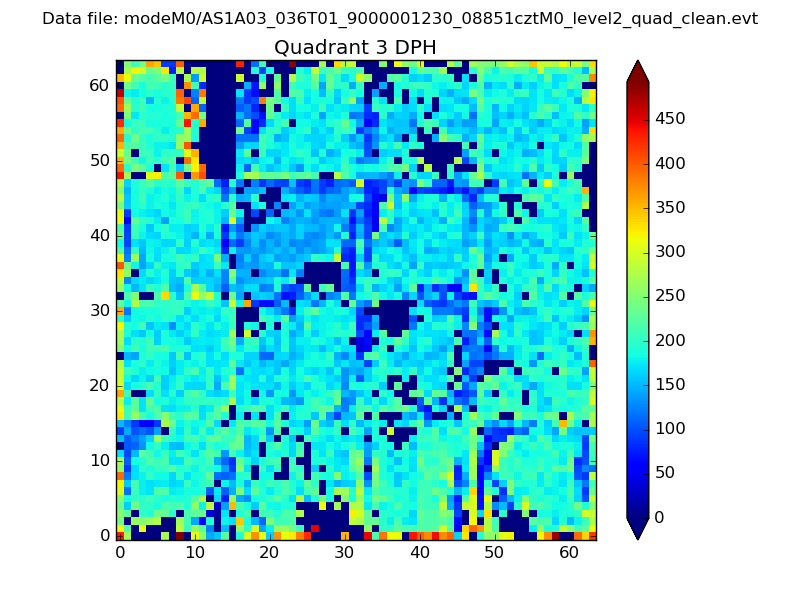 |
 |
Quadrant C |
| Plot type | Count rate plots | Images |
|---|---|---|
| Comparison with Poisson distribution Blue bars denote a histogram of data divided into 1 sec bins. Red curve is a Poisson curve with rate = median count rate of data. |
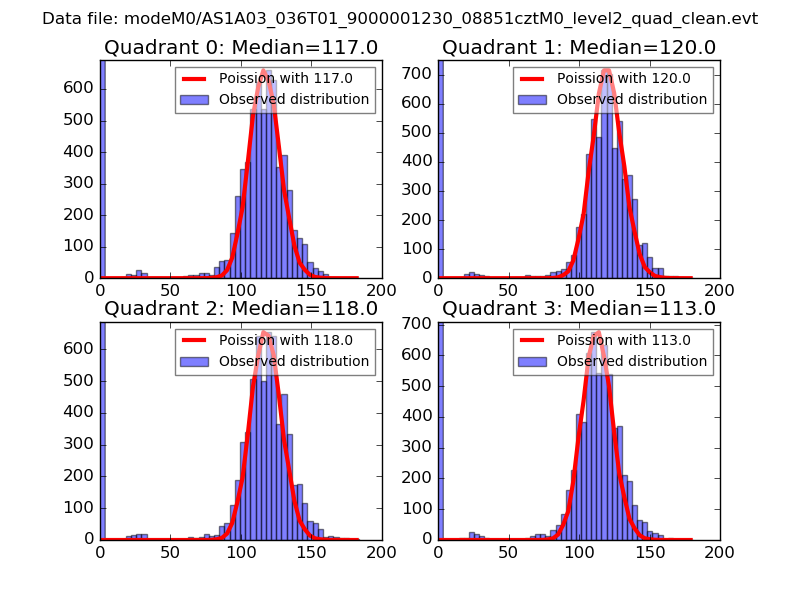 |
 |
| Quadrant-wise count rates Data is divided into 100 sec bins |
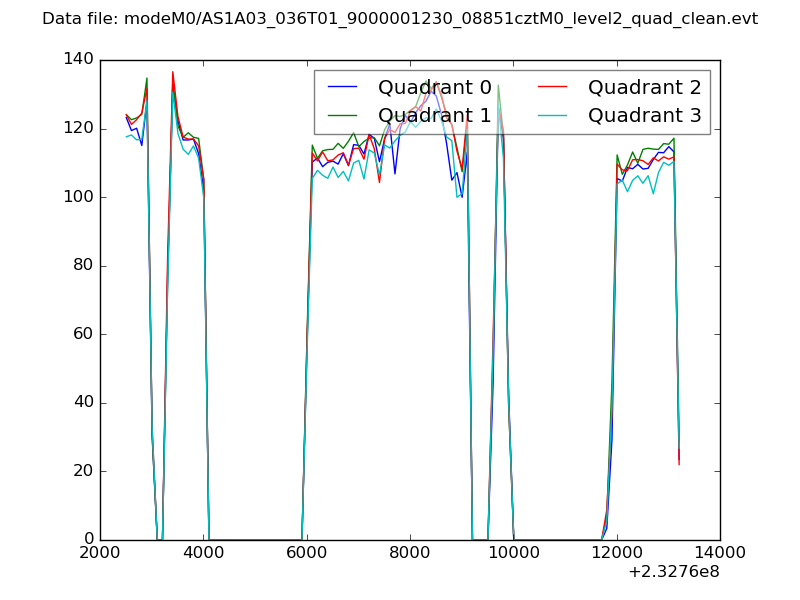 |
|
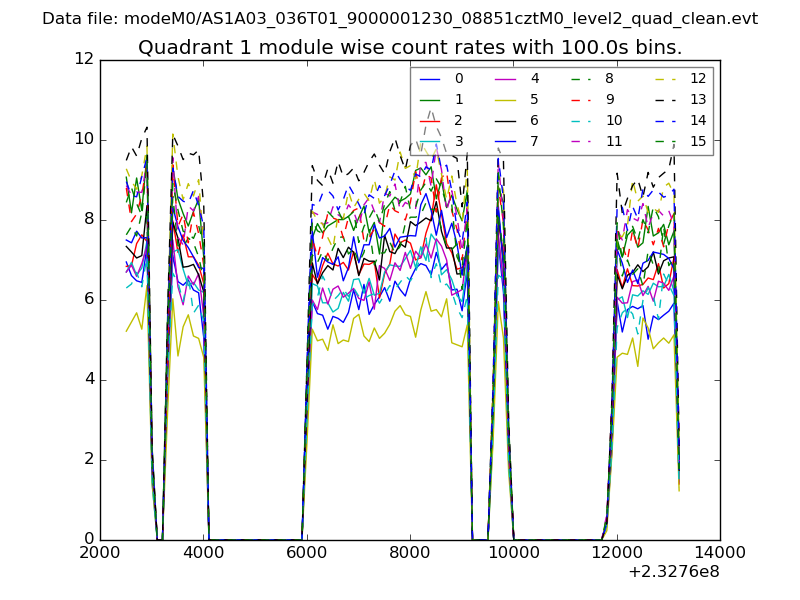
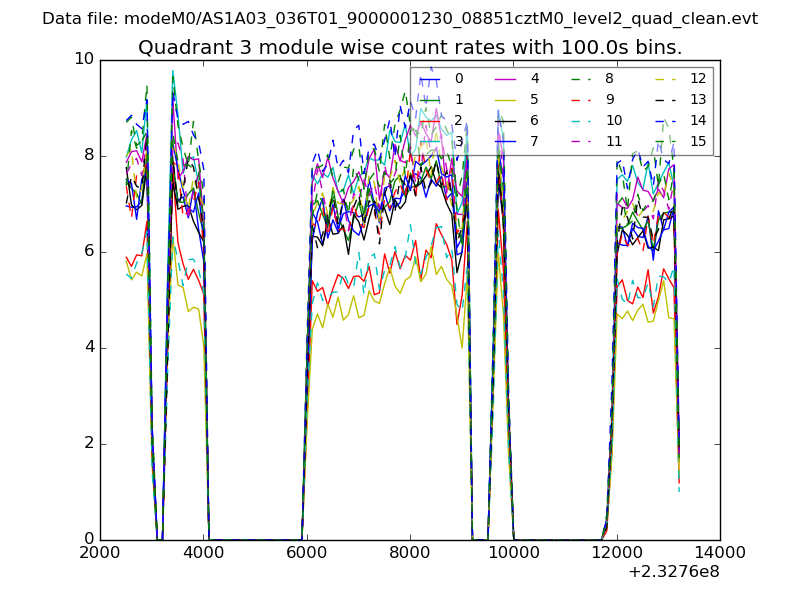
| Module-wise count rates for Quadrant A Data is divided into 100 sec bins |
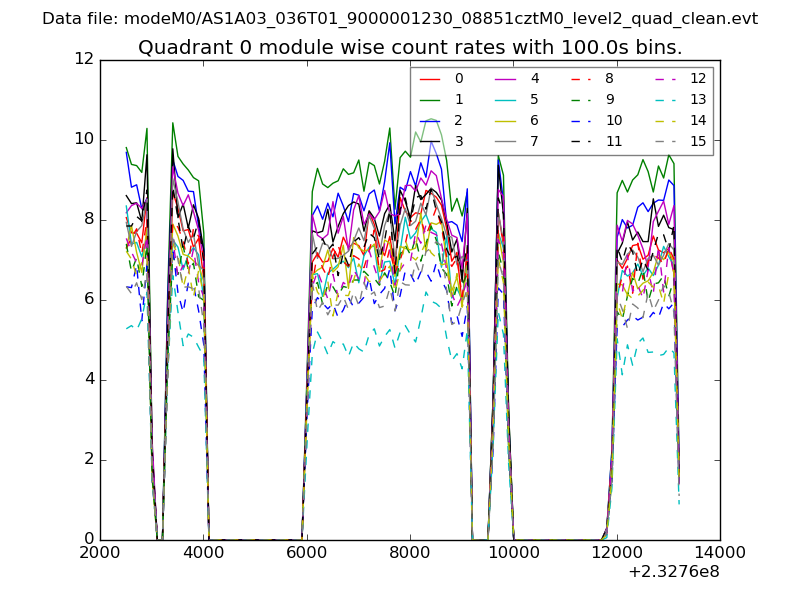 |
 |
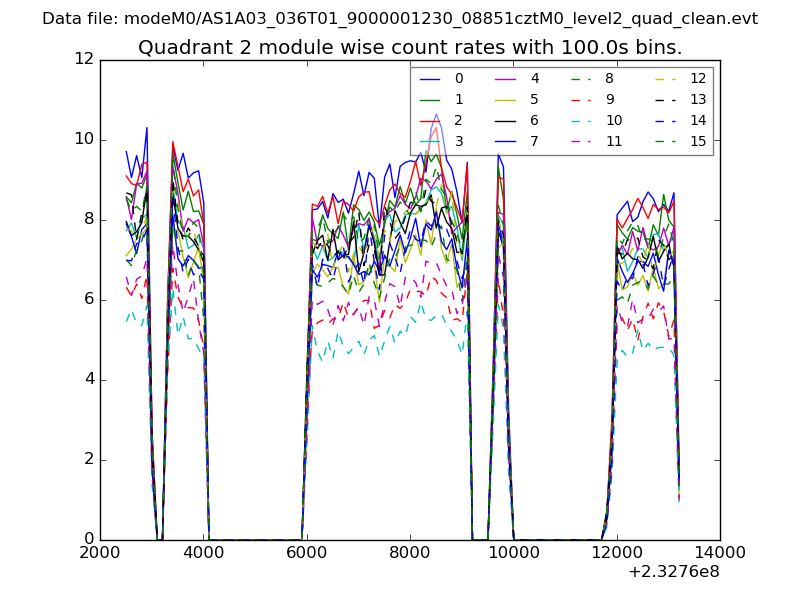
| Module-wise count rates for Quadrant B Data is divided into 100 sec bins |
 |
 |
| Module-wise count rates for Quadrant C Data is divided into 100 sec bins |
 |
 |
| Module-wise count rates for Quadrant D Data is divided into 100 sec bins |
 |
 |
| Parameter | Plot |
|---|---|
| CZT HV Monitor | 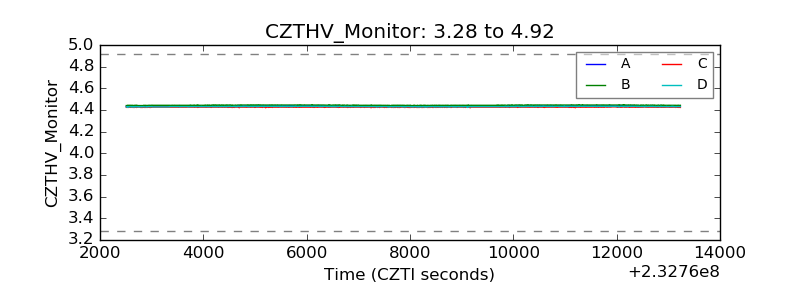 |
| D_VDD | 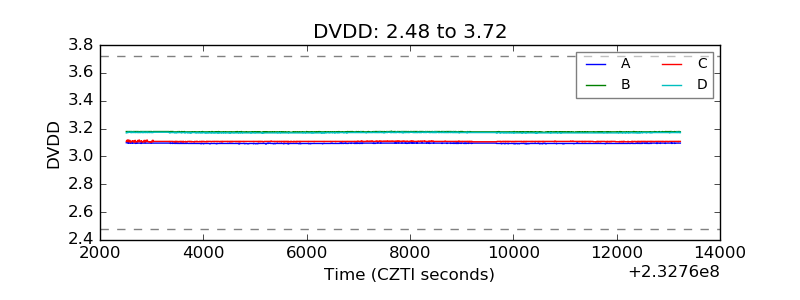 |
| Temperature 1 | 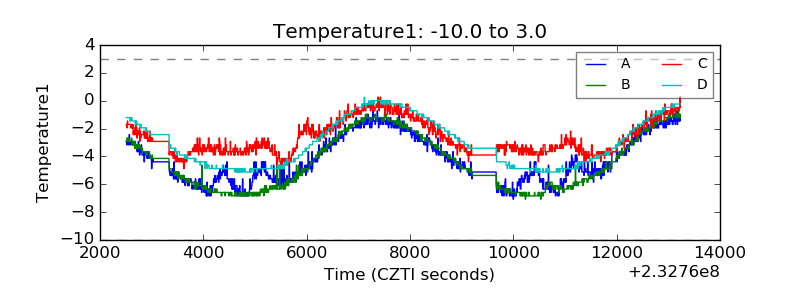 |
| Veto HV Monitor | 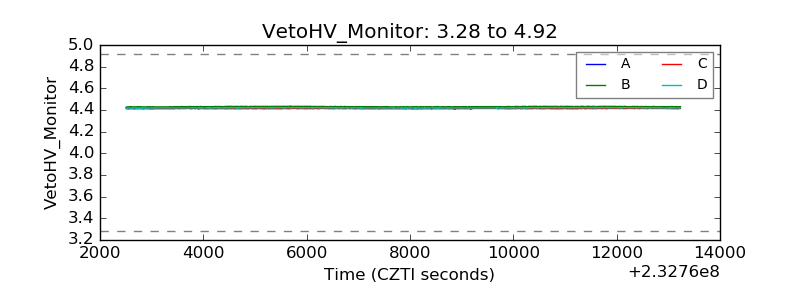 |
| Veto LLD | 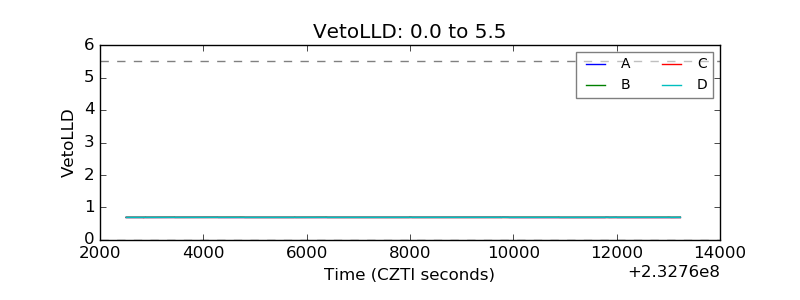 |
| Alpha Counter | 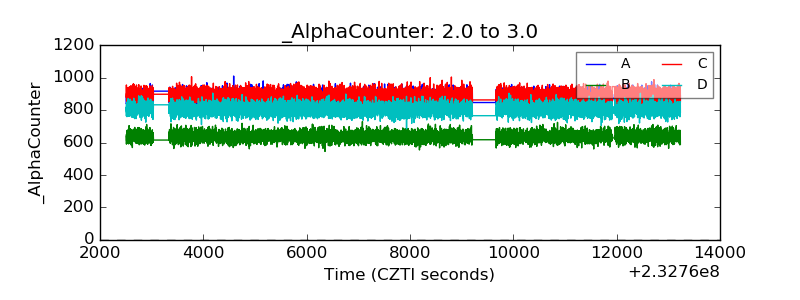 |
| _CPM_Rate | 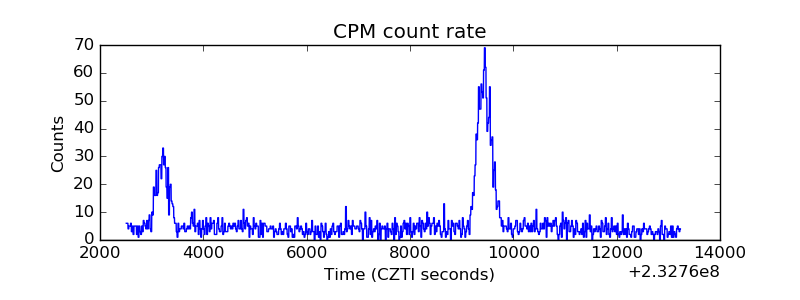 |
| CZT Counter | 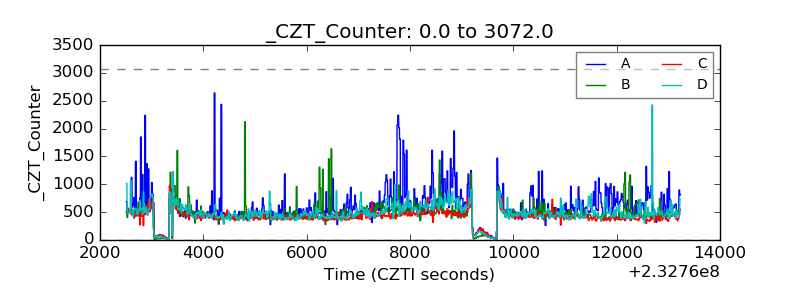 |
| +2.5 Volts monitor | 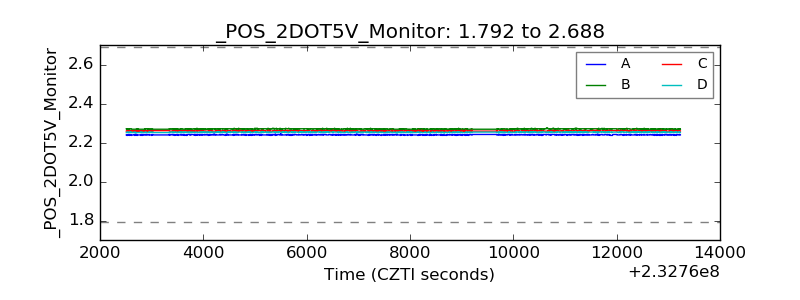 |
| +5 Volts monitor |  |
| _ROLL_ROT | 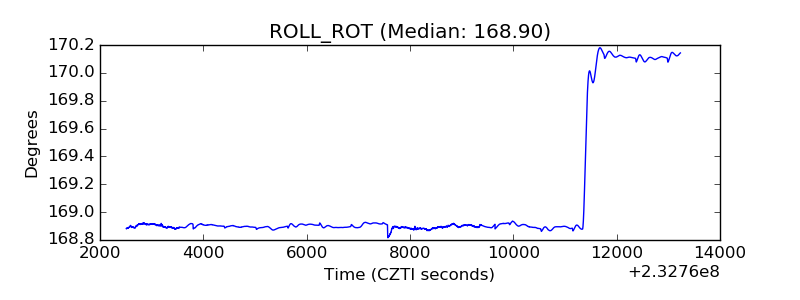 |
| _Roll_DEC | 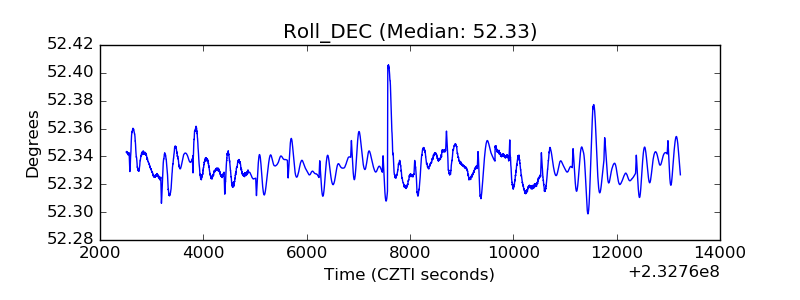 |
| _Roll_RA | 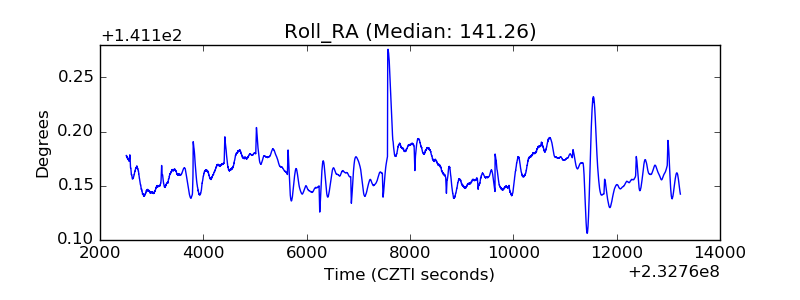 |
| Veto Counter | 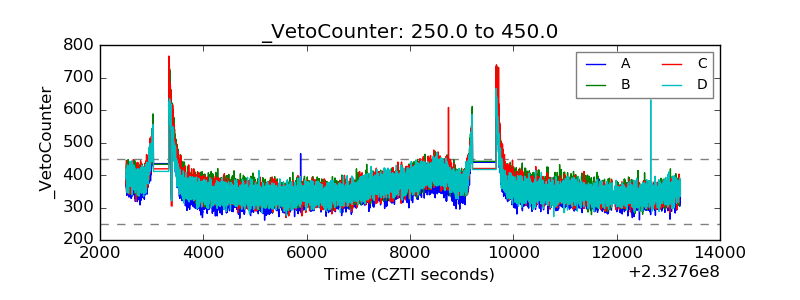 |