| Param | Original file | Final file |
|---|---|---|
| Filename | modeM0/AS1A03_036T01_9000001230_08853cztM0_level2.evt | modeM0/AS1A03_036T01_9000001230_08853cztM0_level2_quad_clean.evt |
| Size (bytes) | 452,525,760 | 84,922,560 |
| Size | 431.6 MB | 81.0 MB |
| Events in quadrant A | 3,575,025 | 528,129 |
| Events in quadrant B | 3,331,495 | 539,265 |
| Events in quadrant C | 2,991,286 | 528,420 |
| Events in quadrant D | 3,353,089 | 510,418 |
| Mode SS | |||
|---|---|---|---|
| Quadrant | BADHDUFLAG | Total packets | Discarded packets |
| A | 0 | 134 | 0 |
| B | 0 | 134 | 0 |
| C | 0 | 134 | 0 |
| D | 0 | 134 | 0 |
| Mode M9 | |||
|---|---|---|---|
| Quadrant | BADHDUFLAG | Total packets | Discarded packets |
| A | 0 | 10 | 0 |
| B | 0 | 10 | 0 |
| C | 0 | 10 | 0 |
| D | 0 | 10 | 0 |
| Mode M0 | |||
|---|---|---|---|
| Quadrant | BADHDUFLAG | Total packets | Discarded packets |
| A | 0 | 14924 | 9 |
| B | 0 | 14160 | 8 |
| C | 0 | 13572 | 1 |
| D | 0 | 13981 | 3 |
| Quadrant | Total seconds | Saturated seconds | Saturation percentage |
|---|---|---|---|
| A | 6679 | 138 | 2.066178% |
| B | 6679 | 118 | 1.766732% |
| C | 6682 | 54 | 0.808141% |
| D | 6681 | 66 | 0.987876% |
Noise dominated data is calculated using 1-second bins in cleaned event files. If a bin has >2000 counts, and if more than 50% of those come from <1% of pixels, then it is considered to be noise-dominated and hence unusable.
| Quadrant | # 1 sec bins | Bins with >0 counts | Bins with >2000 counts | High rate bins dominated by noise | Noise dominated (total time) | Noise dominated (detector-on time) | Marked lightcurve |
|---|---|---|---|---|---|---|---|
| A | 7627 | 6682 | 52 | 52 | 0.68% | 0.78% |  |
| B | 7627 | 6681 | 25 | 25 | 0.33% | 0.37% | 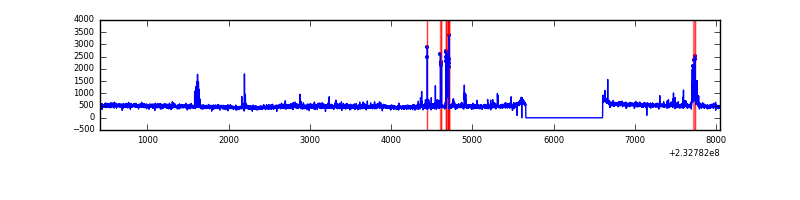 |
| C | 7627 | 6682 | 1 | 1 | 0.01% | 0.01% | 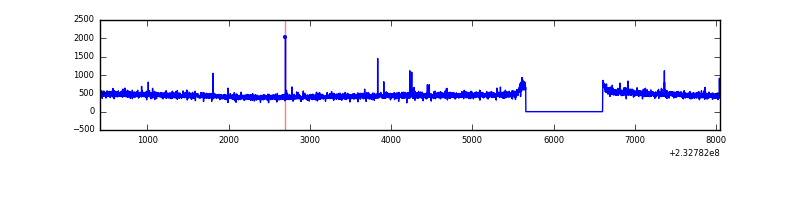 |
| D | 7627 | 6682 | 5 | 5 | 0.07% | 0.07% | 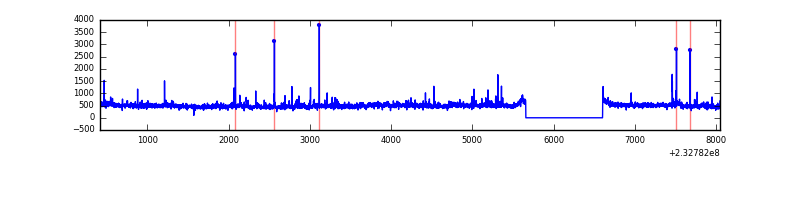 |
Top three noisy pixels from each quadrant. If the there are fewer than three noisy pixels in the level2.evt file, extra rows are filled as -1
| Pixel properties | Quadrant properties | ||||||
|---|---|---|---|---|---|---|---|
| Quadrant | DetID | PixID | Counts | Sigma | Mean | Median | Sigma |
| A | 8 | 5 | 315292 | 1948.82 | 788 | 769 | 161.4 |
| A | 15 | 174 | 175373 | 1081.87 | 788 | 769 | 161.4 |
| A | 14 | 31 | 39111 | 237.57 | 788 | 769 | 161.4 |
| B | 10 | 16 | 90048 | 591.68 | 791 | 773 | 150.9 |
| B | 4 | 48 | 70454 | 461.82 | 791 | 773 | 150.9 |
| B | 0 | 214 | 29916 | 193.15 | 791 | 773 | 150.9 |
| C | 1 | 3 | 15777 | 84.7 | 762 | 763 | 177.3 |
| C | 13 | 61 | 5633 | 27.47 | 762 | 763 | 177.3 |
| C | 12 | 4 | 2266 | 8.48 | 762 | 763 | 177.3 |
| D | 8 | 195 | 246057 | 1207.15 | 760 | 743 | 203.2 |
| D | 13 | 105 | 56758 | 275.64 | 760 | 743 | 203.2 |
| D | 2 | 152 | 38939 | 187.96 | 760 | 743 | 203.2 |
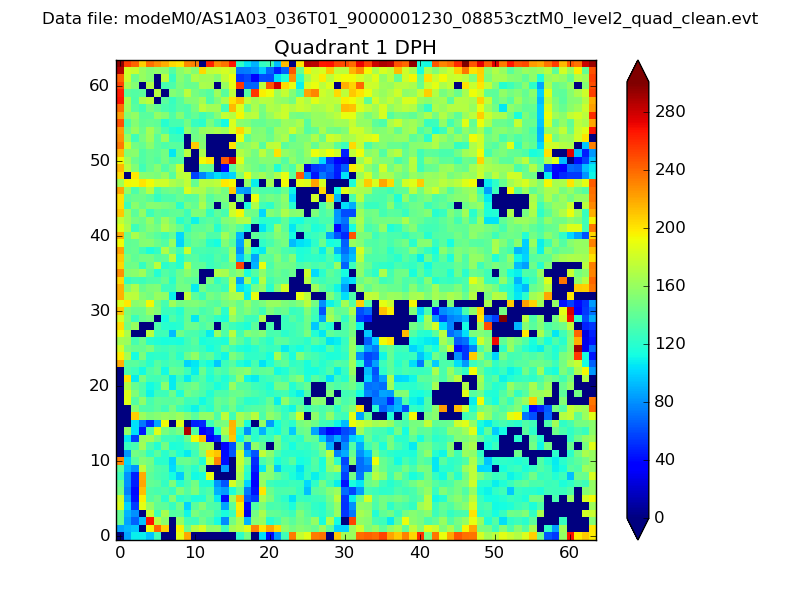
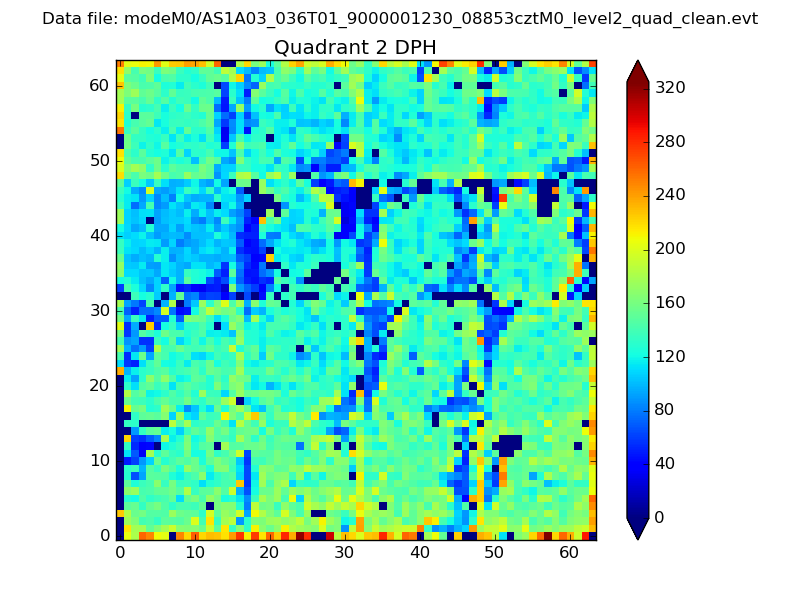
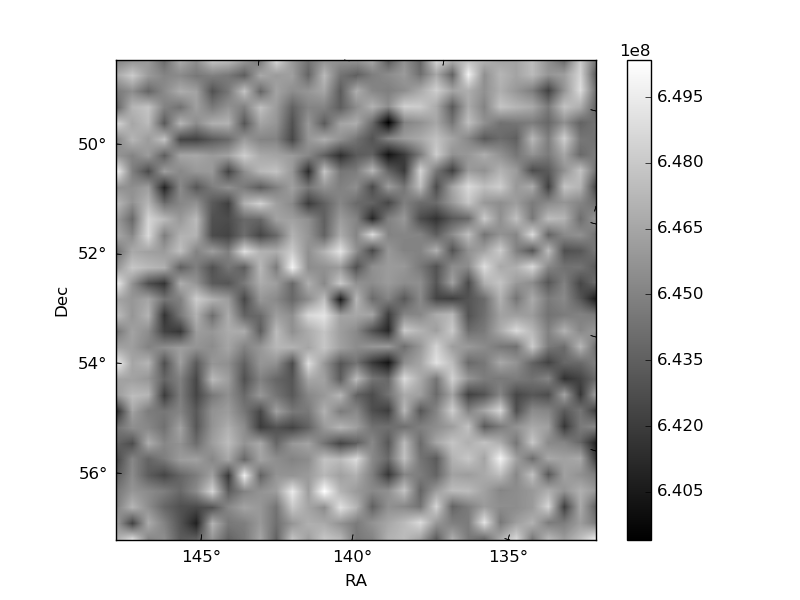
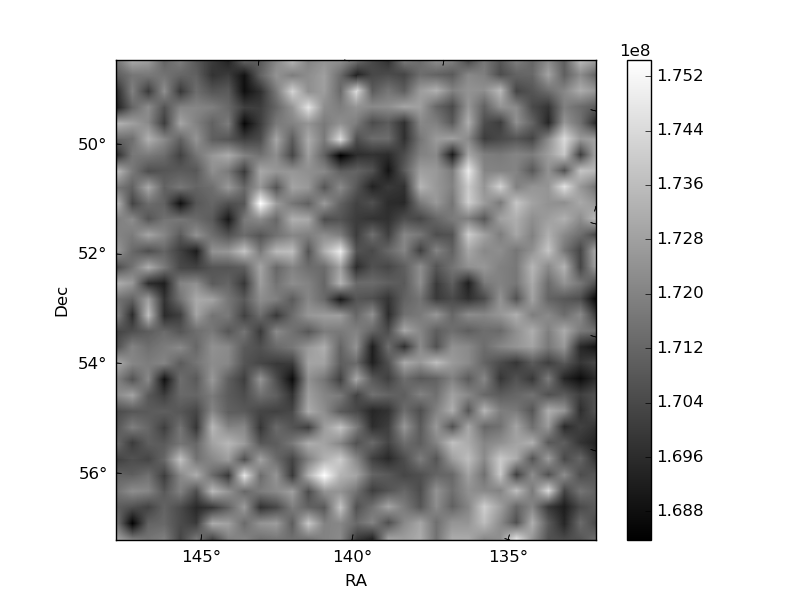
Histogram calculated using DETX and DETY for each event in the final _common_clean file
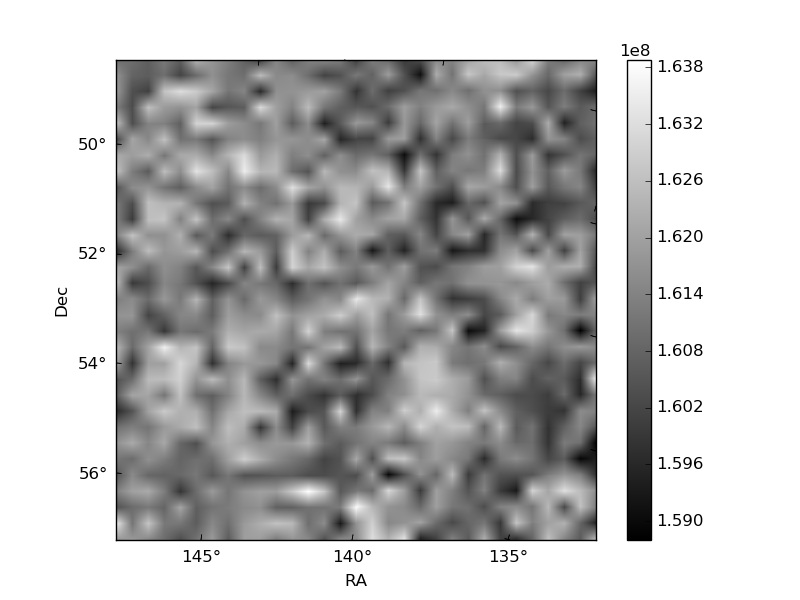
| Quadrant A | 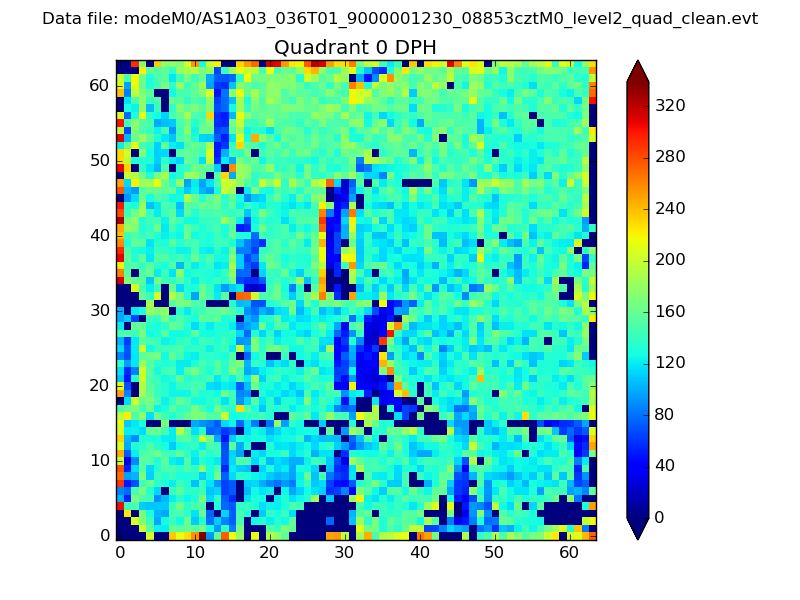 |
 |
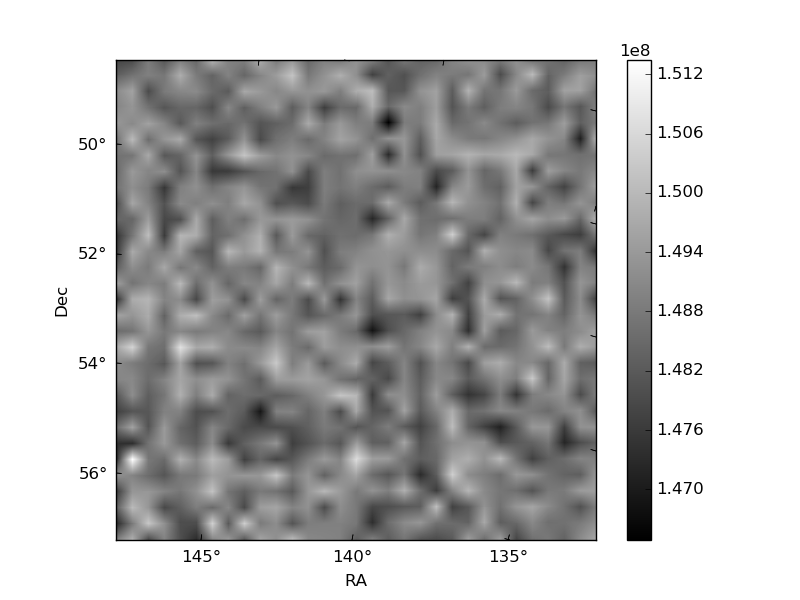
Quadrant B |
|---|---|---|---|
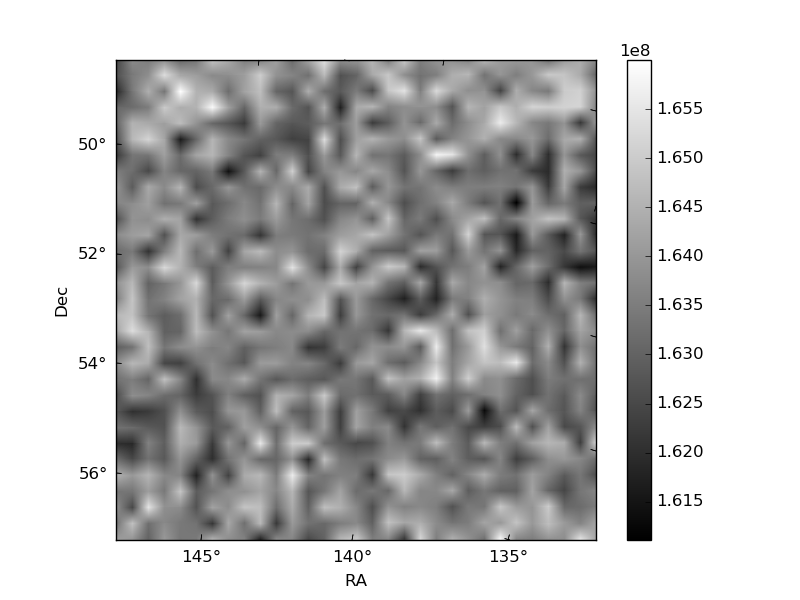
| Quadrant D | 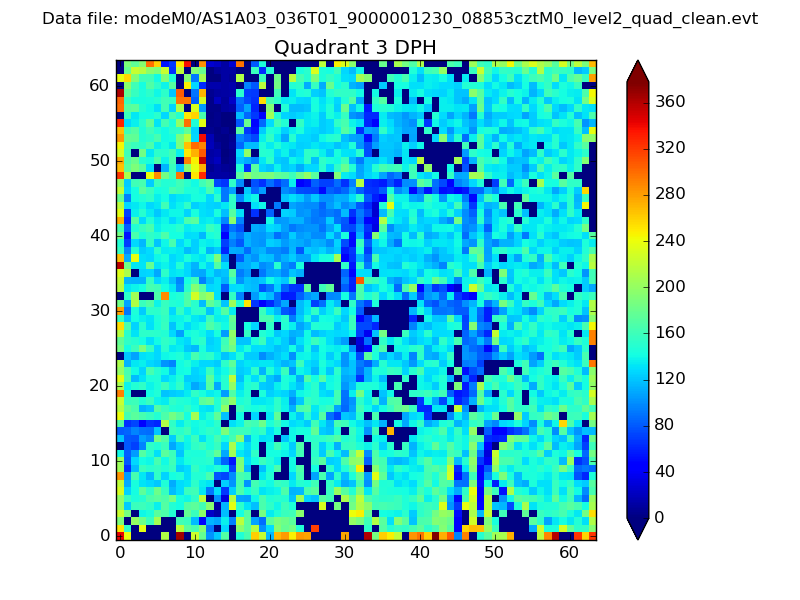 |
 |
Quadrant C |
| Plot type | Count rate plots | Images |
|---|---|---|
| Comparison with Poisson distribution Blue bars denote a histogram of data divided into 1 sec bins. Red curve is a Poisson curve with rate = median count rate of data. |
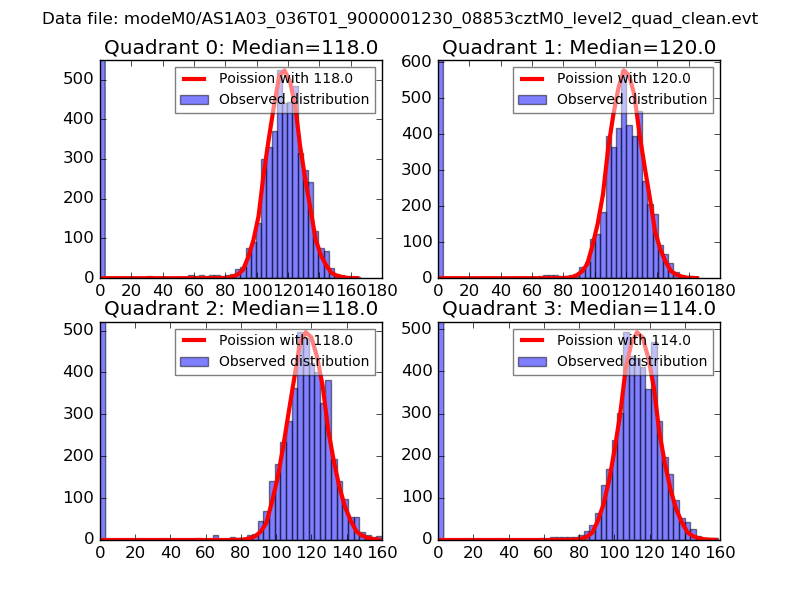 |
 |
| Quadrant-wise count rates Data is divided into 100 sec bins |
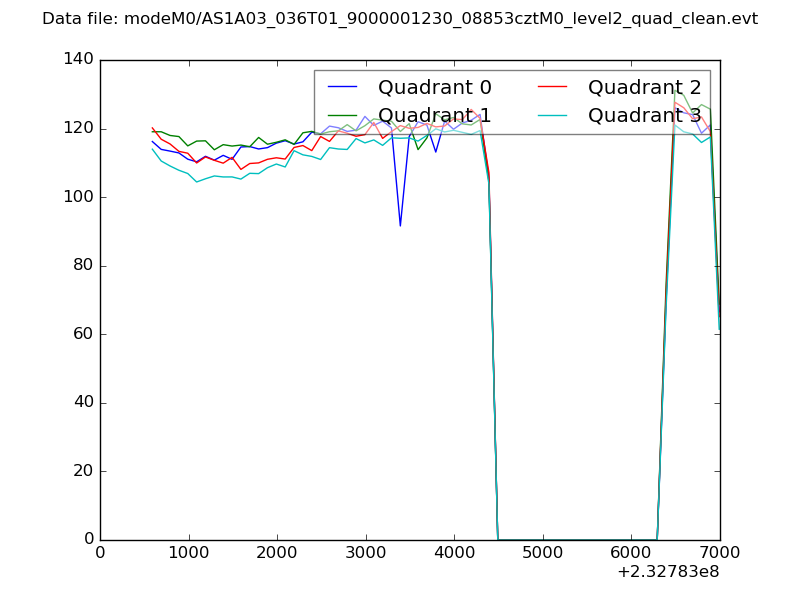 |
|
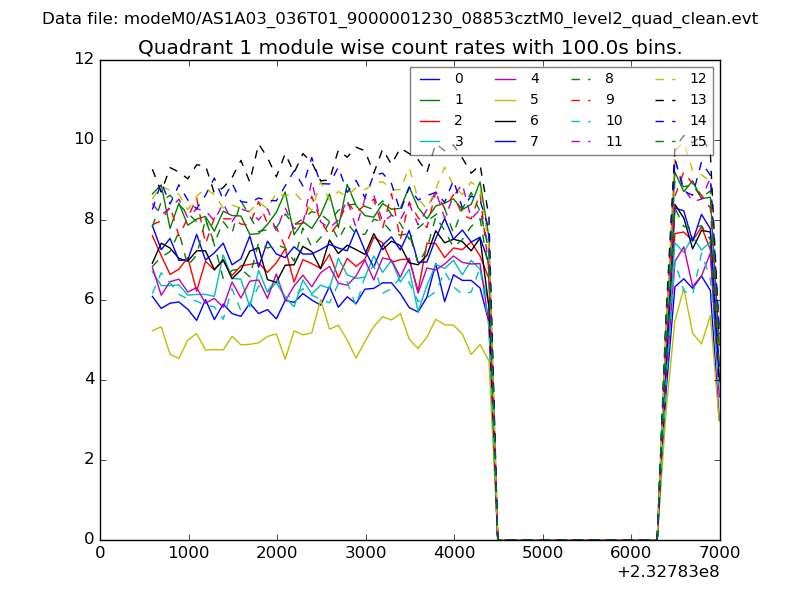
| Module-wise count rates for Quadrant A Data is divided into 100 sec bins |
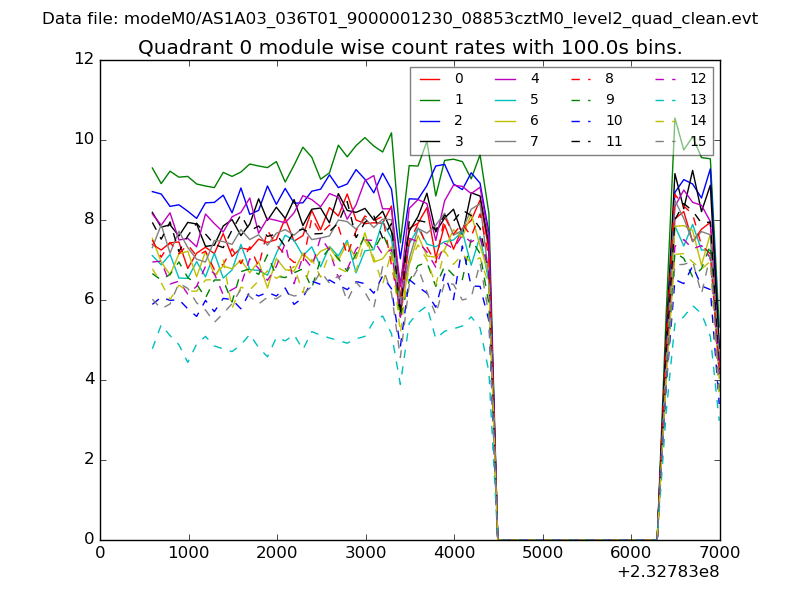 |
 |
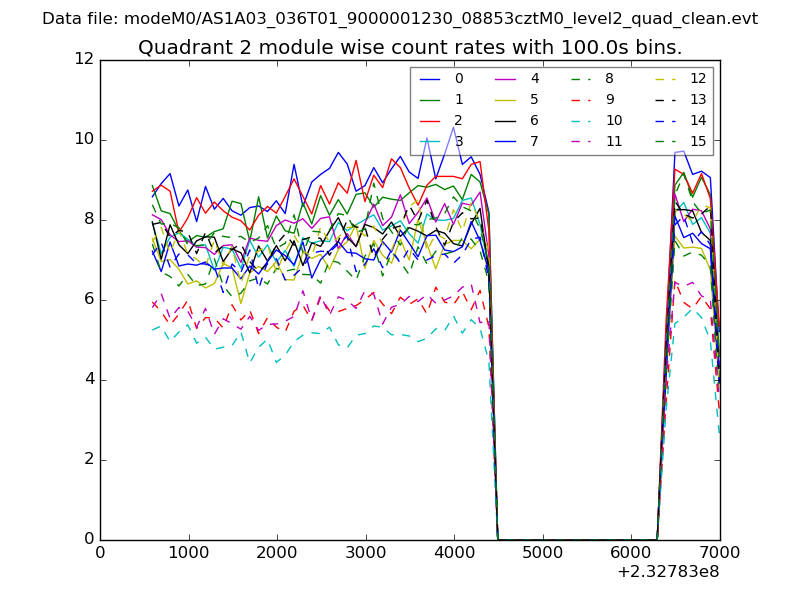
| Module-wise count rates for Quadrant B Data is divided into 100 sec bins |
 |
 |
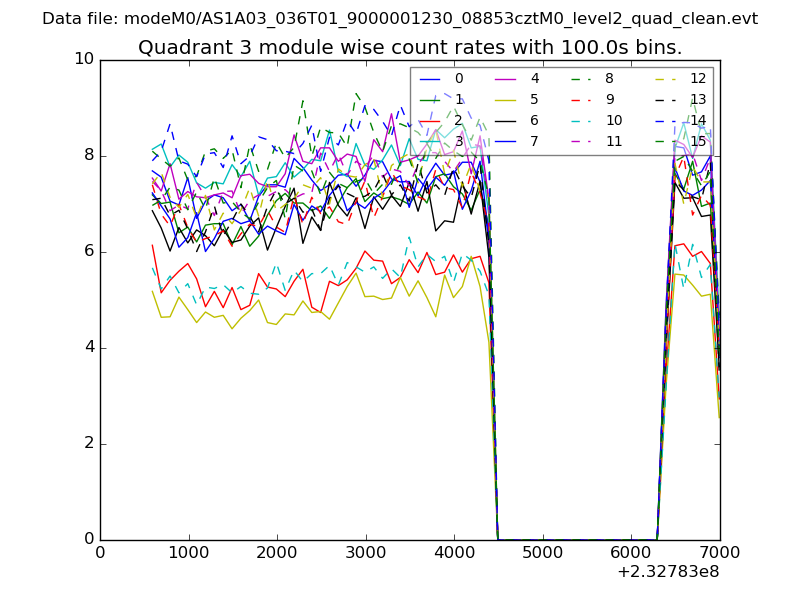
| Module-wise count rates for Quadrant C Data is divided into 100 sec bins |
 |
 |
| Module-wise count rates for Quadrant D Data is divided into 100 sec bins |
 |
 |
| Parameter | Plot |
|---|---|
| CZT HV Monitor | 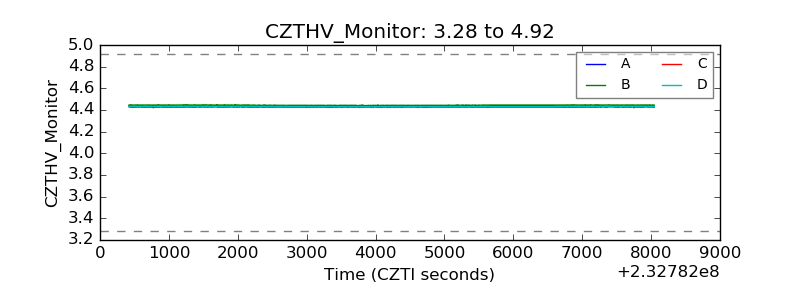 |
| D_VDD | 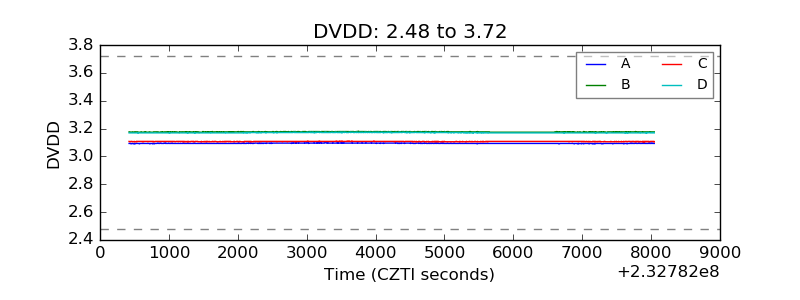 |
| Temperature 1 | 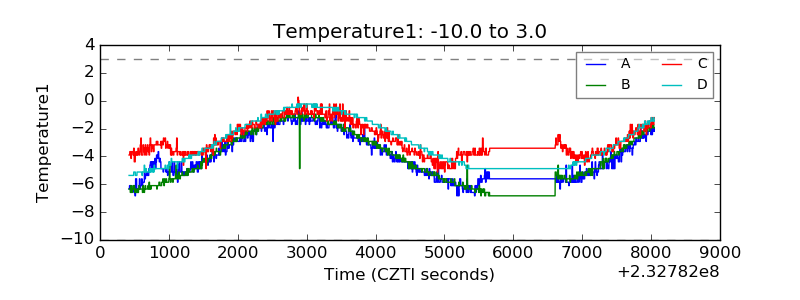 |
| Veto HV Monitor | 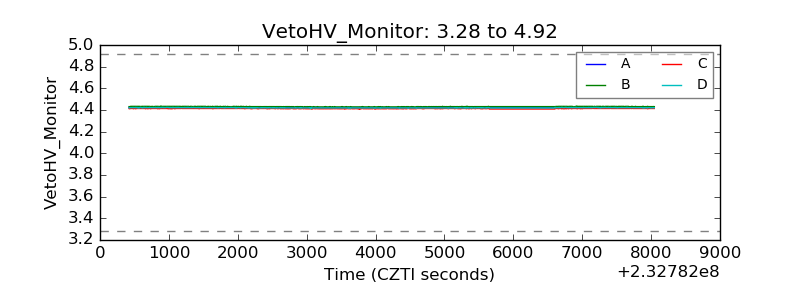 |
| Veto LLD | 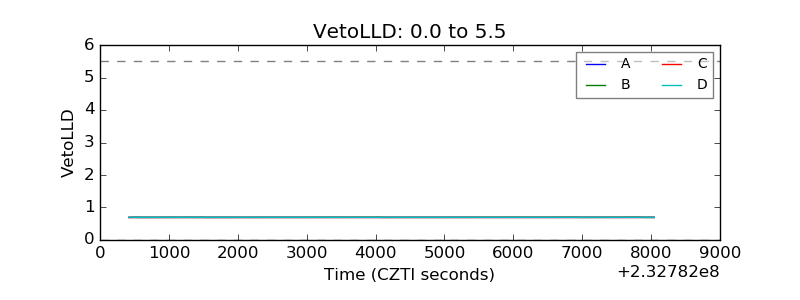 |
| Alpha Counter | 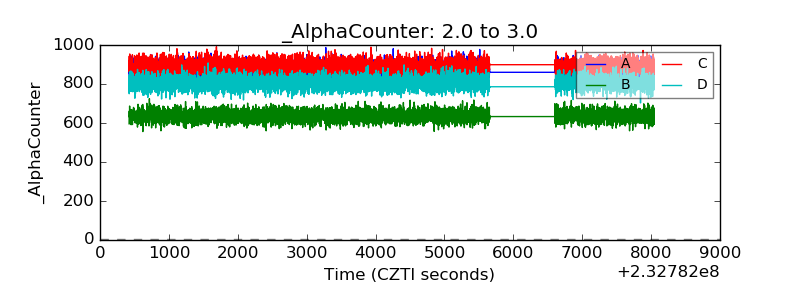 |
| _CPM_Rate | 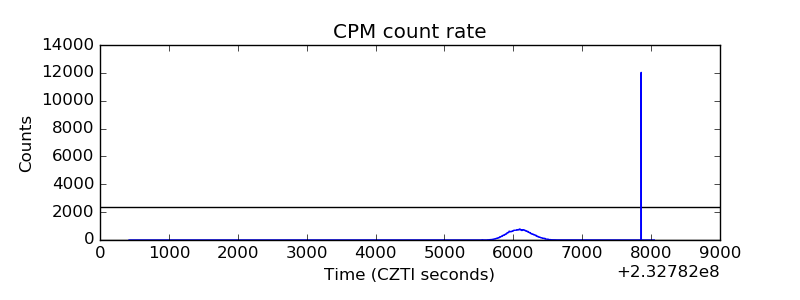 |
| CZT Counter | 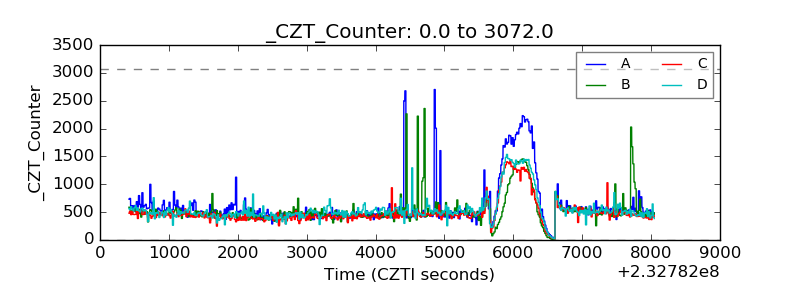 |
| +2.5 Volts monitor | 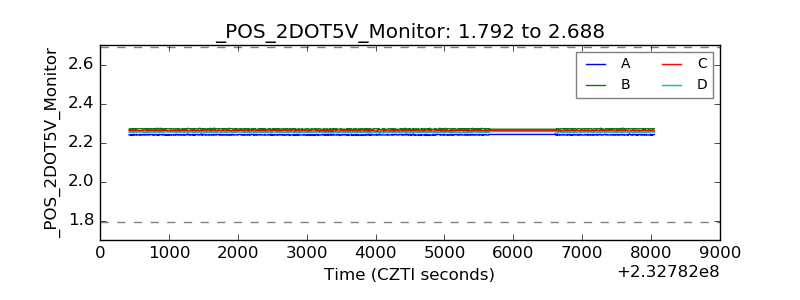 |
| +5 Volts monitor |  |
| _ROLL_ROT | 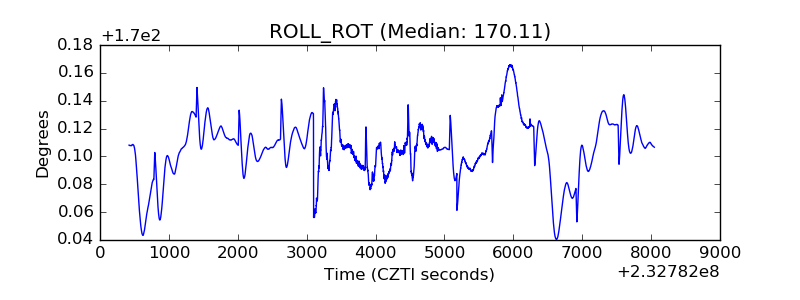 |
| _Roll_DEC | 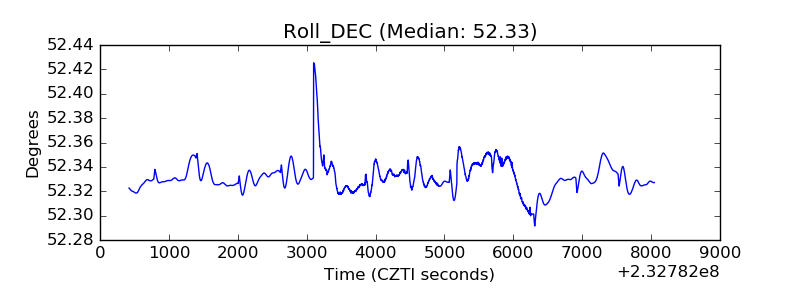 |
| _Roll_RA | 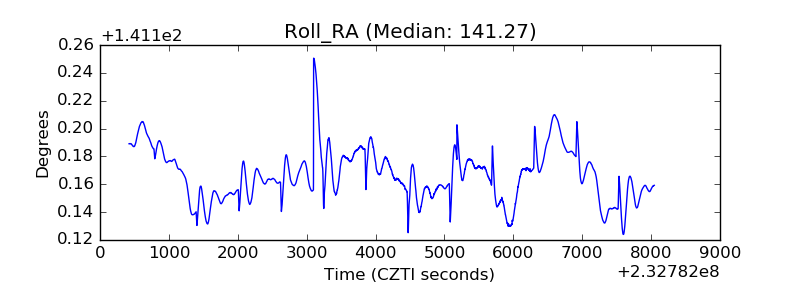 |
| Veto Counter | 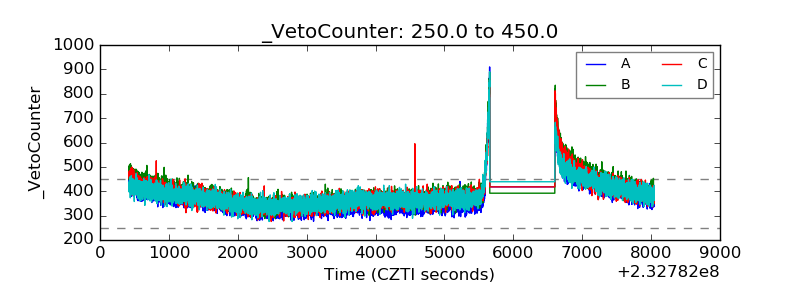 |