| Param | Original file | Final file |
|---|---|---|
| Filename | modeM0/AS1A03_036T01_9000001230_08855cztM0_level2.evt | modeM0/AS1A03_036T01_9000001230_08855cztM0_level2_quad_clean.evt |
| Size (bytes) | 429,618,240 | 91,728,000 |
| Size | 409.7 MB | 87.5 MB |
| Events in quadrant A | 3,461,784 | 597,885 |
| Events in quadrant B | 3,111,067 | 606,156 |
| Events in quadrant C | 2,693,268 | 588,752 |
| Events in quadrant D | 3,339,646 | 568,630 |
| Mode SS | |||
|---|---|---|---|
| Quadrant | BADHDUFLAG | Total packets | Discarded packets |
| A | 0 | 122 | 0 |
| B | 0 | 122 | 0 |
| C | 0 | 122 | 0 |
| D | 0 | 122 | 0 |
| Mode M9 | |||
|---|---|---|---|
| Quadrant | BADHDUFLAG | Total packets | Discarded packets |
| A | 0 | 11 | 0 |
| B | 0 | 11 | 0 |
| C | 0 | 11 | 0 |
| D | 0 | 11 | 0 |
| Mode M0 | |||
|---|---|---|---|
| Quadrant | BADHDUFLAG | Total packets | Discarded packets |
| A | 0 | 14249 | 19 |
| B | 0 | 13049 | 3 |
| C | 0 | 12169 | 7 |
| D | 0 | 13536 | 13 |
| Quadrant | Total seconds | Saturated seconds | Saturation percentage |
|---|---|---|---|
| A | 5958 | 119 | 1.997315% |
| B | 5961 | 96 | 1.610468% |
| C | 5959 | 33 | 0.553784% |
| D | 5957 | 53 | 0.889710% |
Noise dominated data is calculated using 1-second bins in cleaned event files. If a bin has >2000 counts, and if more than 50% of those come from <1% of pixels, then it is considered to be noise-dominated and hence unusable.
| Quadrant | # 1 sec bins | Bins with >0 counts | Bins with >2000 counts | High rate bins dominated by noise | Noise dominated (total time) | Noise dominated (detector-on time) | Marked lightcurve |
|---|---|---|---|---|---|---|---|
| A | 7062 | 5962 | 31 | 31 | 0.44% | 0.52% | 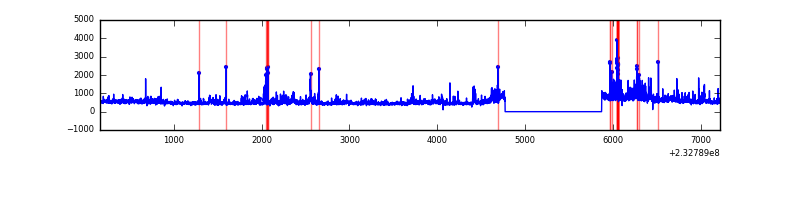 |
| B | 7062 | 5962 | 33 | 33 | 0.47% | 0.55% | 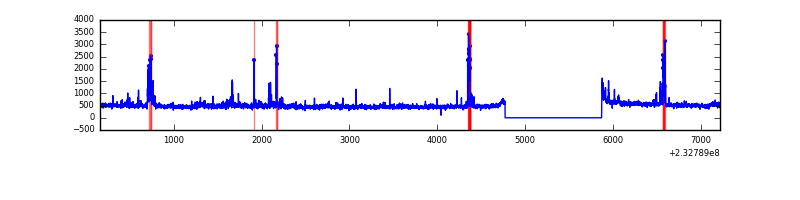 |
| C | 7062 | 5963 | 1 | 1 | 0.01% | 0.02% | 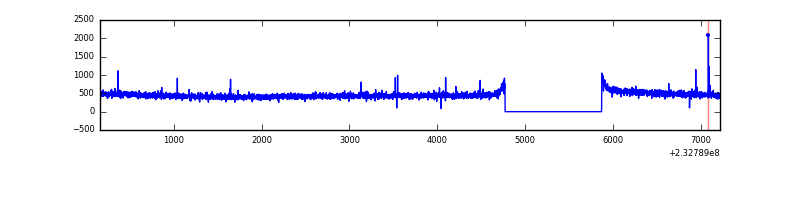 |
| D | 7062 | 5962 | 15 | 15 | 0.21% | 0.25% | 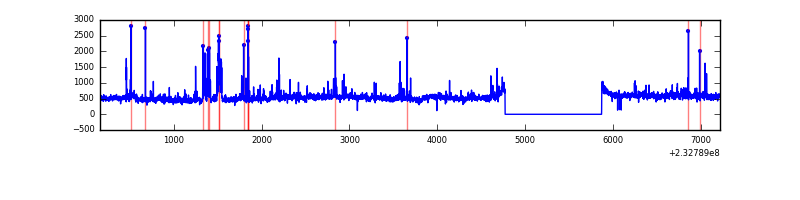 |
Top three noisy pixels from each quadrant. If the there are fewer than three noisy pixels in the level2.evt file, extra rows are filled as -1
| Pixel properties | Quadrant properties | ||||||
|---|---|---|---|---|---|---|---|
| Quadrant | DetID | PixID | Counts | Sigma | Mean | Median | Sigma |
| A | 8 | 5 | 626220 | 4324.6 | 712 | 697 | 144.6 |
| A | 5 | 16 | 49646 | 338.41 | 712 | 697 | 144.6 |
| A | 15 | 174 | 21974 | 147.1 | 712 | 697 | 144.6 |
| B | 10 | 16 | 152799 | 1114.53 | 711 | 693 | 136.5 |
| B | 4 | 48 | 72891 | 529.02 | 711 | 693 | 136.5 |
| B | 0 | 214 | 55805 | 403.82 | 711 | 693 | 136.5 |
| C | 1 | 3 | 15926 | 95.96 | 685 | 688 | 158.8 |
| C | 13 | 61 | 5235 | 28.63 | 685 | 688 | 158.8 |
| C | 8 | 222 | 2410 | 10.84 | 685 | 688 | 158.8 |
| D | 8 | 195 | 413641 | 2250.92 | 684 | 672 | 183.5 |
| D | 13 | 105 | 115976 | 628.47 | 684 | 672 | 183.5 |
| D | 5 | 97 | 61497 | 331.53 | 684 | 672 | 183.5 |
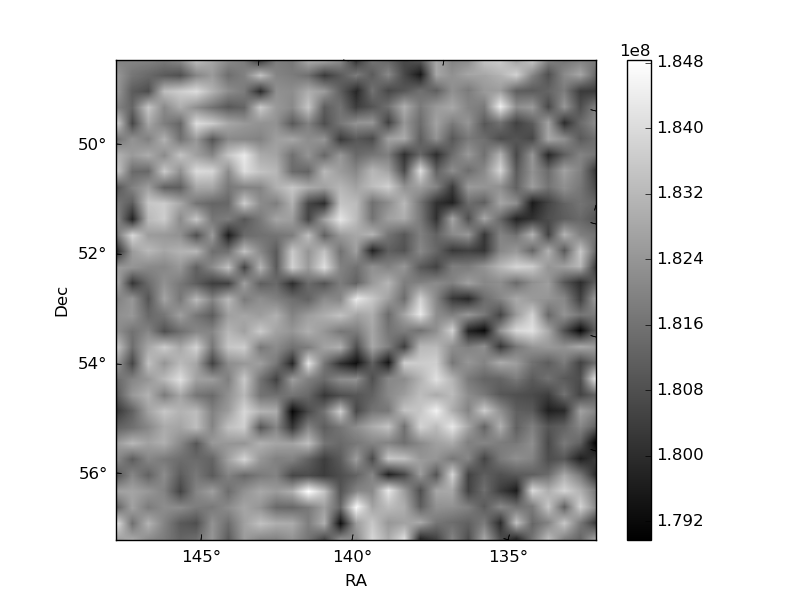
Histogram calculated using DETX and DETY for each event in the final _common_clean file
| Quadrant A | 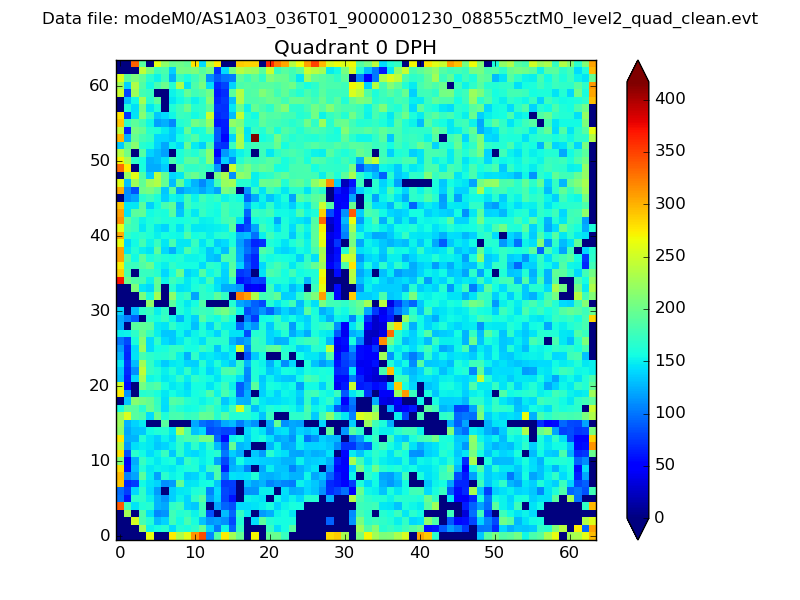 |
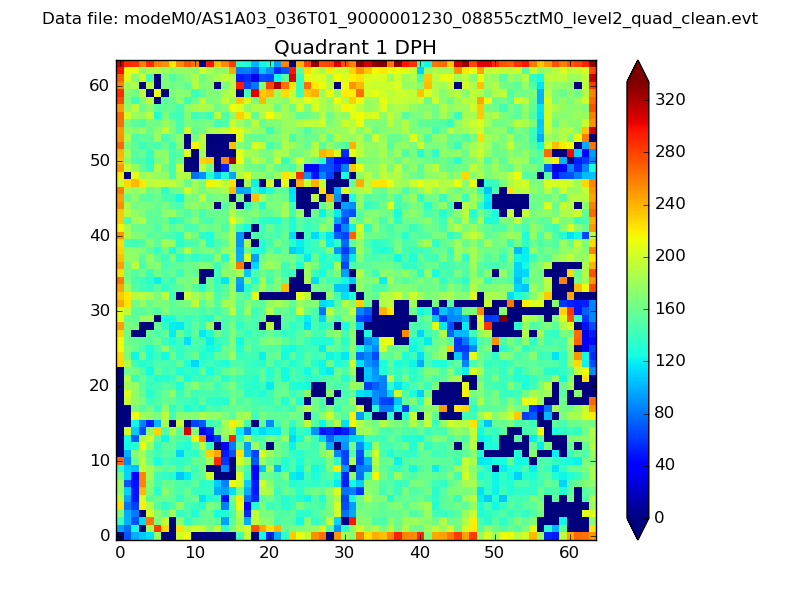 |
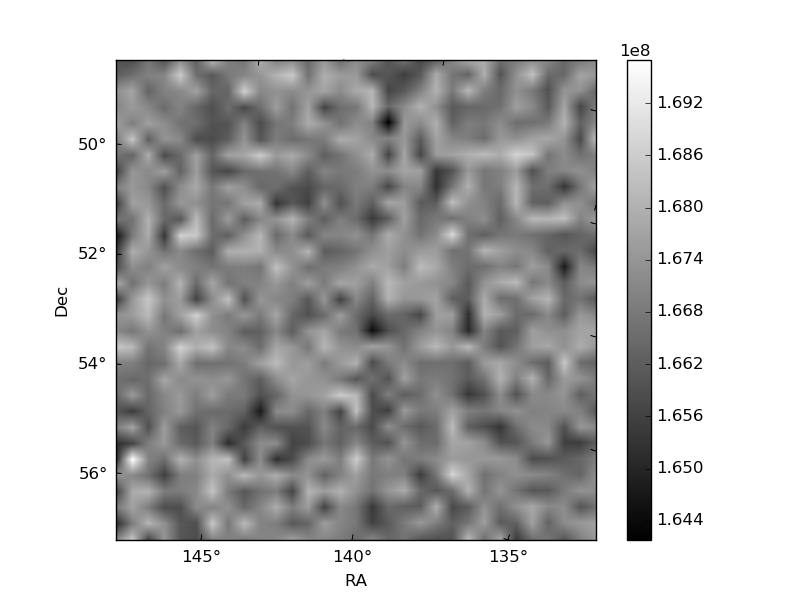
Quadrant B |
|---|---|---|---|
| Quadrant D | 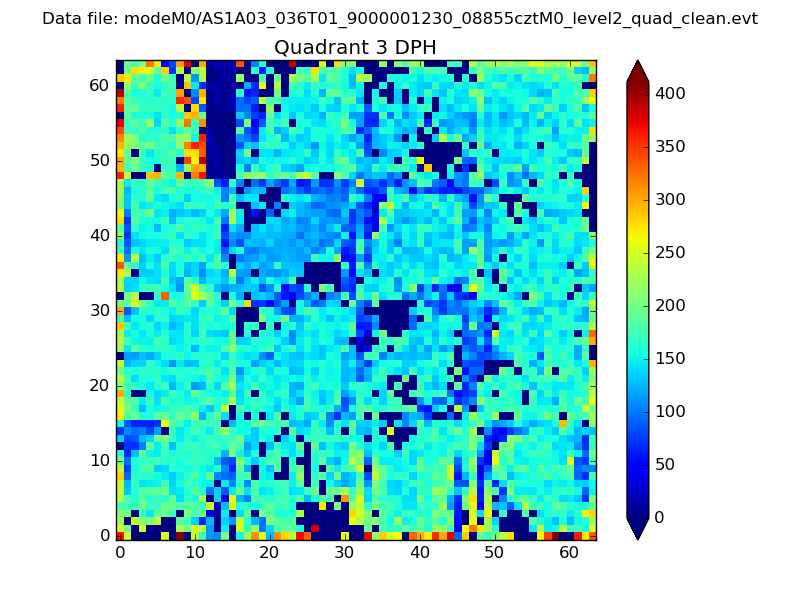 |
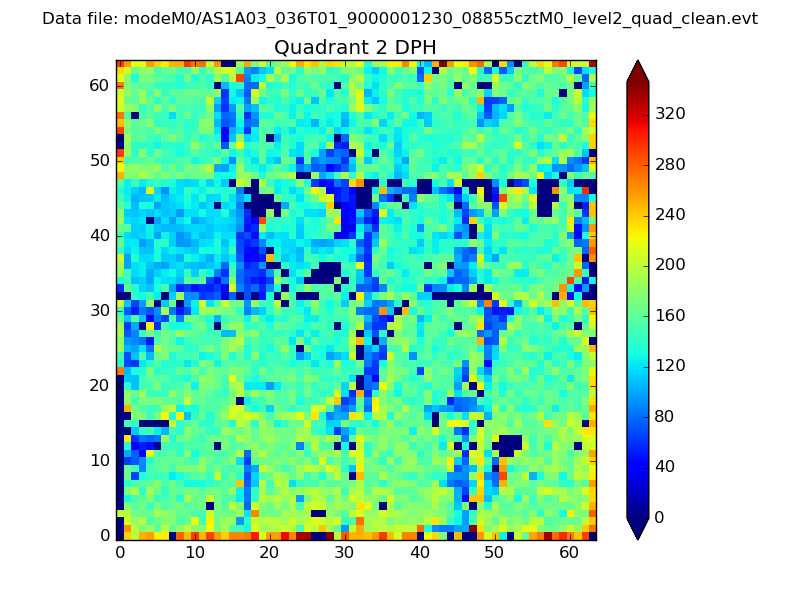 |
Quadrant C |
| Plot type | Count rate plots | Images |
|---|---|---|
| Comparison with Poisson distribution Blue bars denote a histogram of data divided into 1 sec bins. Red curve is a Poisson curve with rate = median count rate of data. |
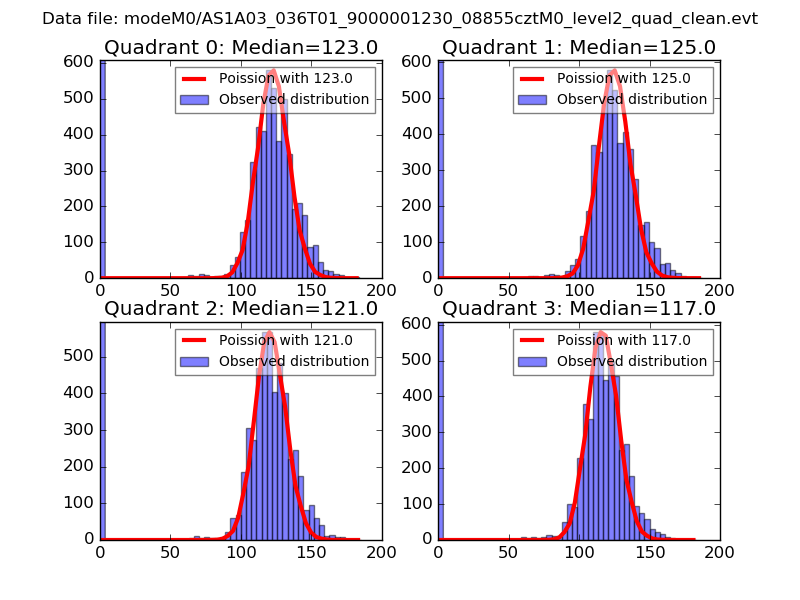 |
 |
| Quadrant-wise count rates Data is divided into 100 sec bins |
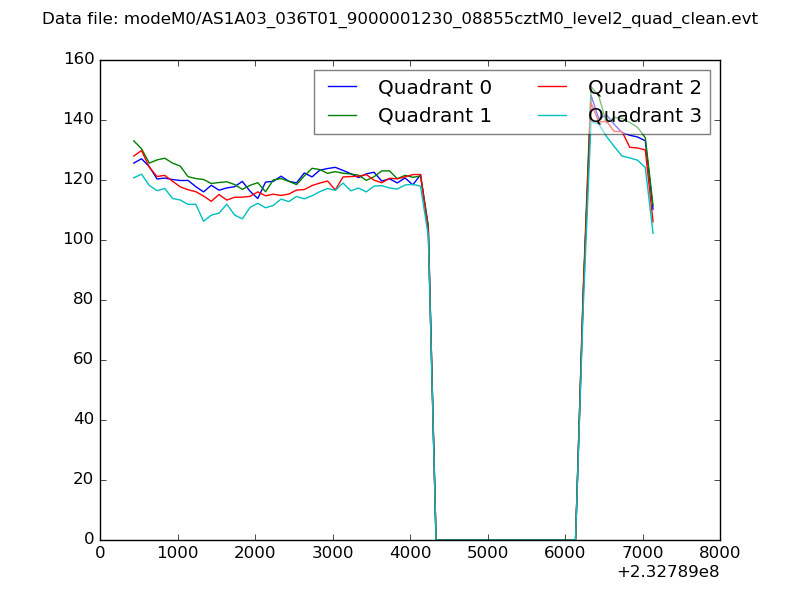 |
|
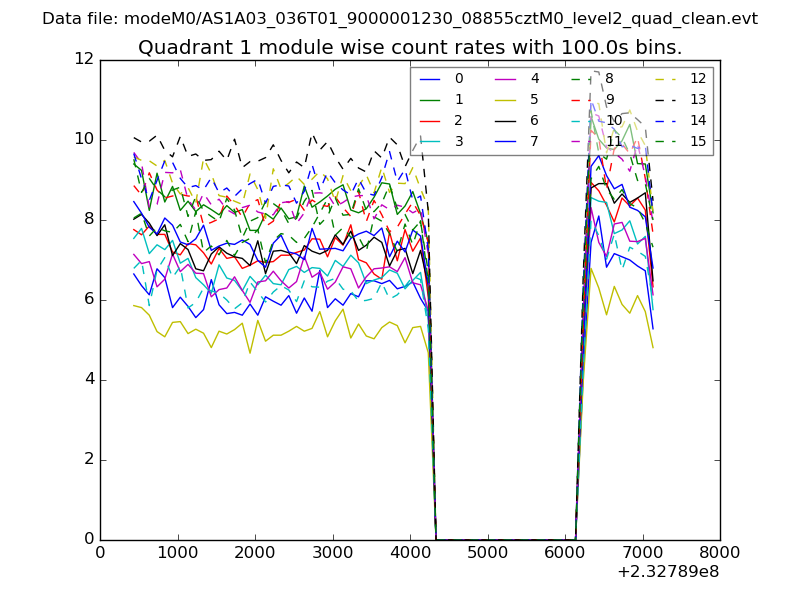
| Module-wise count rates for Quadrant A Data is divided into 100 sec bins |
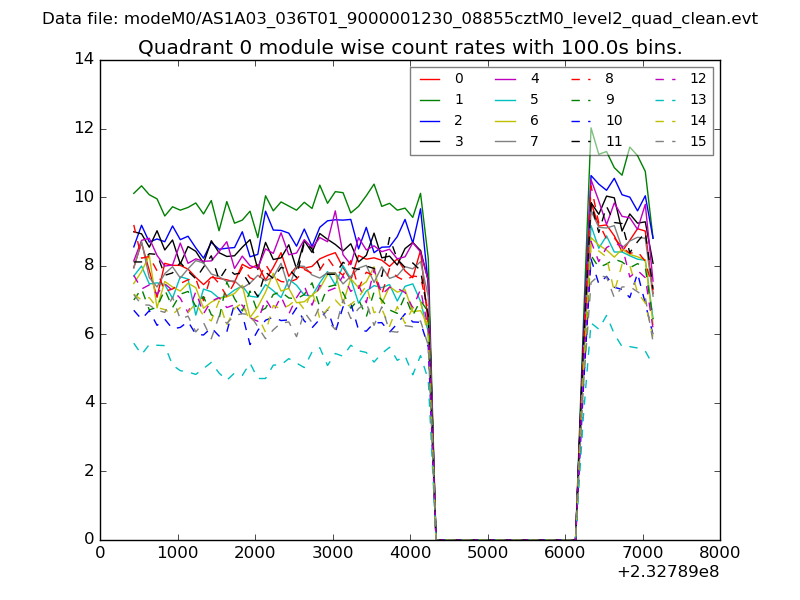 |
 |
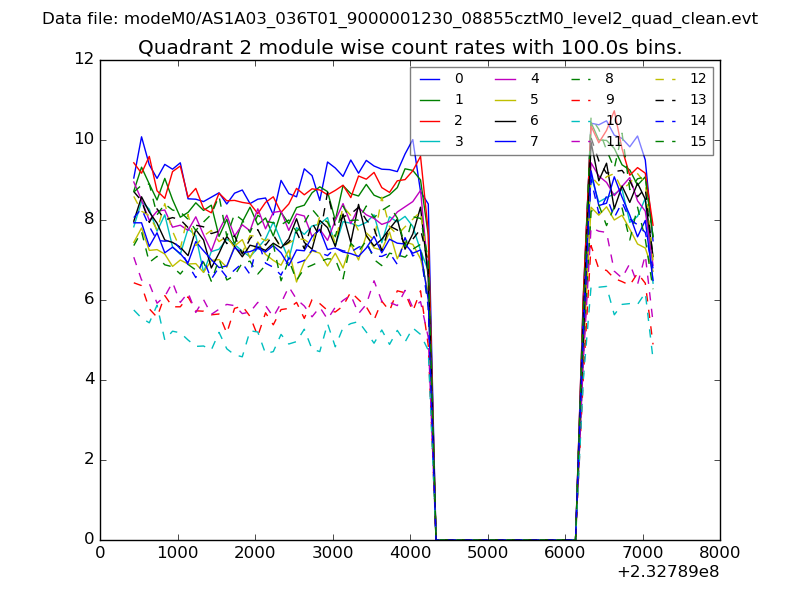
| Module-wise count rates for Quadrant B Data is divided into 100 sec bins |
 |
 |
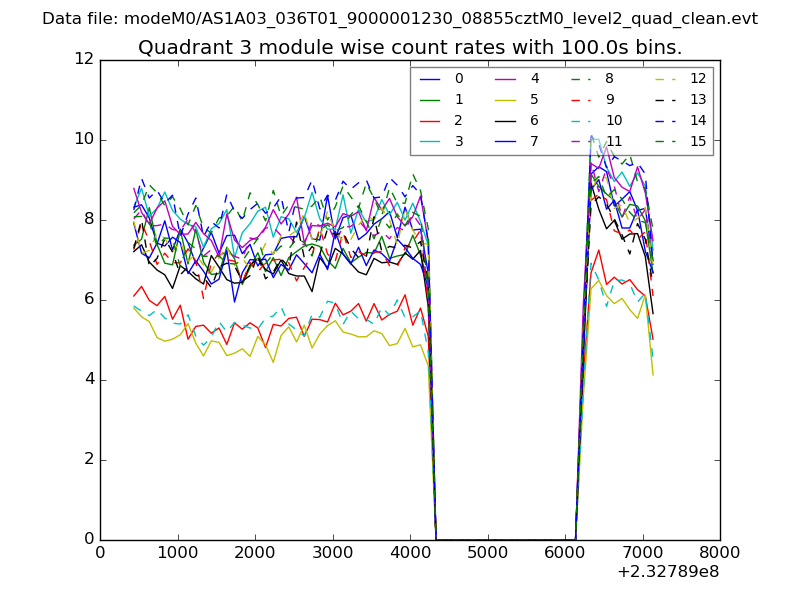
| Module-wise count rates for Quadrant C Data is divided into 100 sec bins |
 |
 |
| Module-wise count rates for Quadrant D Data is divided into 100 sec bins |
 |
 |
| Parameter | Plot |
|---|---|
| CZT HV Monitor | 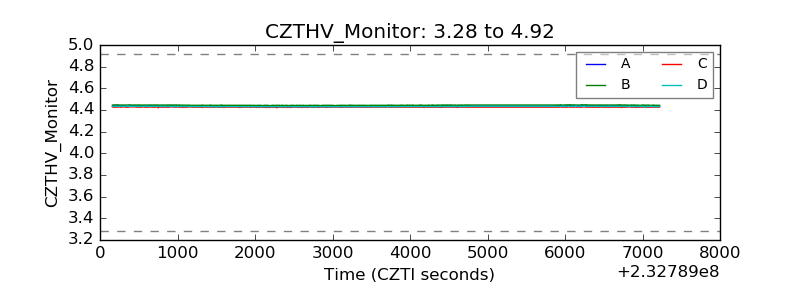 |
| D_VDD | 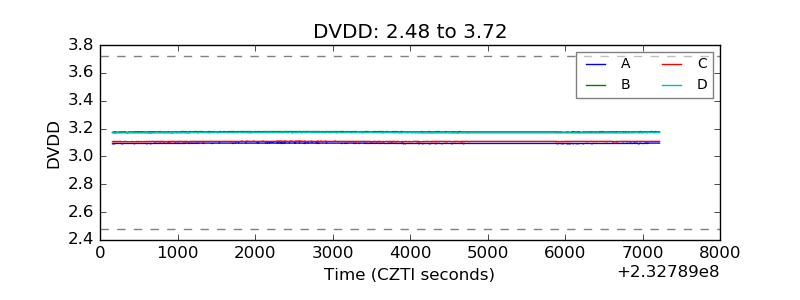 |
| Temperature 1 | 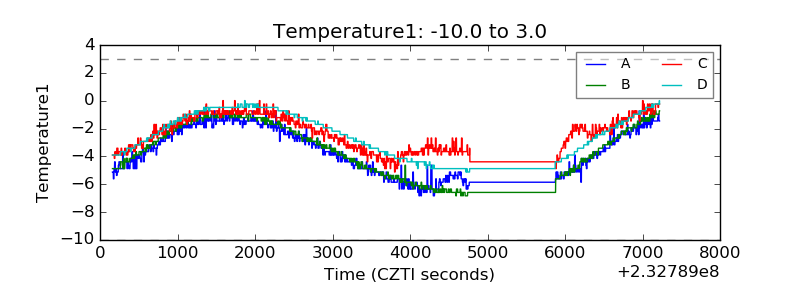 |
| Veto HV Monitor | 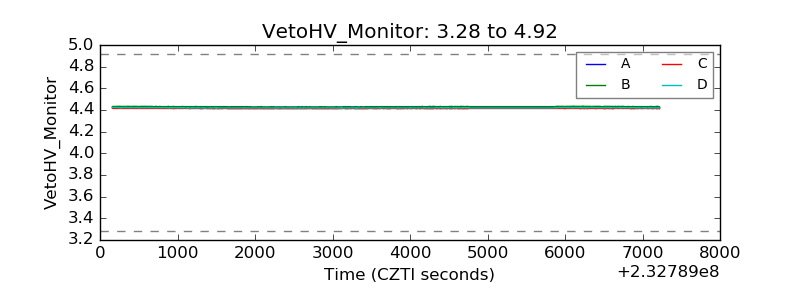 |
| Veto LLD | 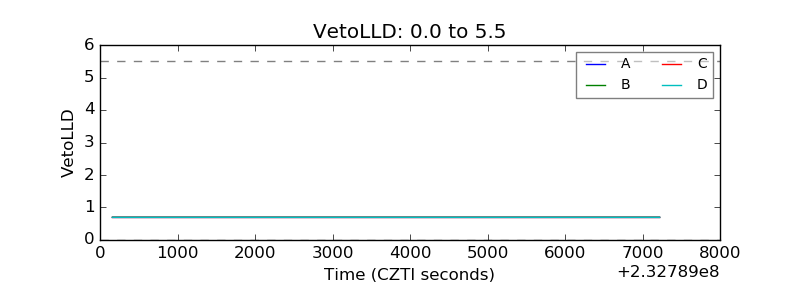 |
| Alpha Counter | 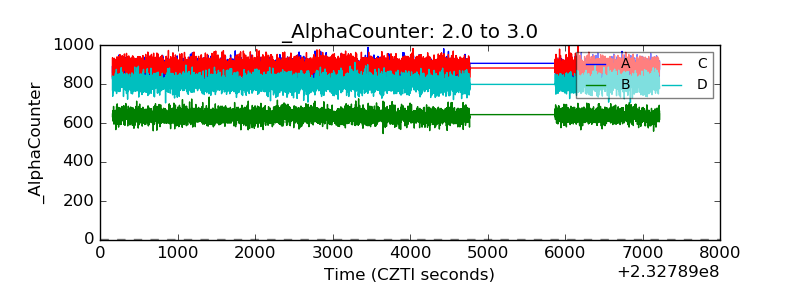 |
| _CPM_Rate | 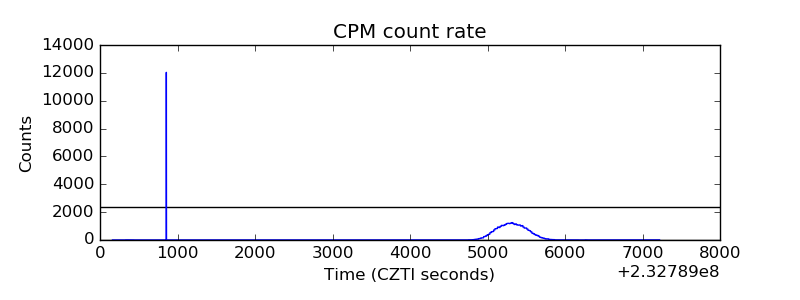 |
| CZT Counter | 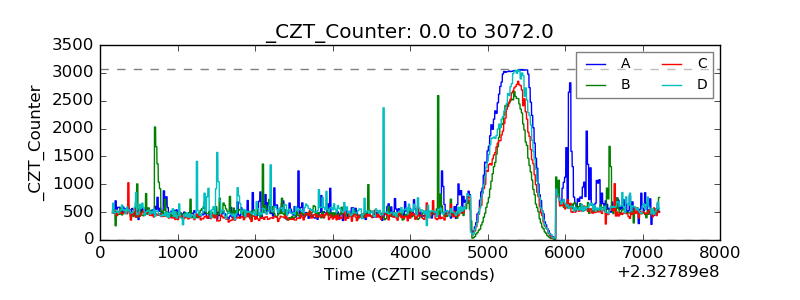 |
| +2.5 Volts monitor |  |
| +5 Volts monitor |  |
| _ROLL_ROT | 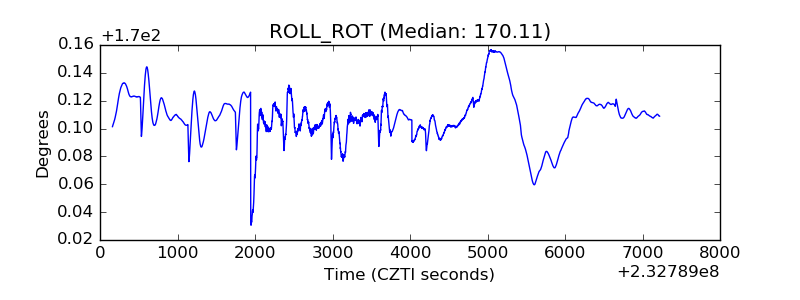 |
| _Roll_DEC | 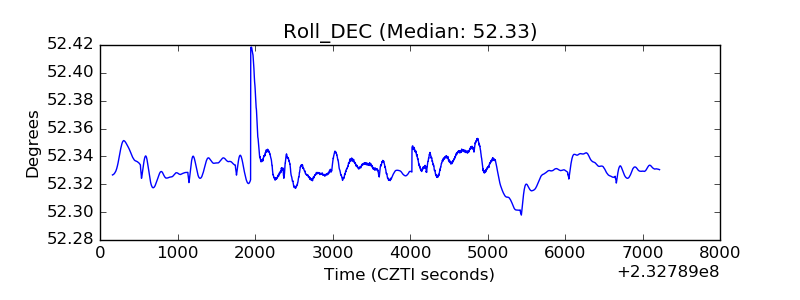 |
| _Roll_RA |  |
| Veto Counter | 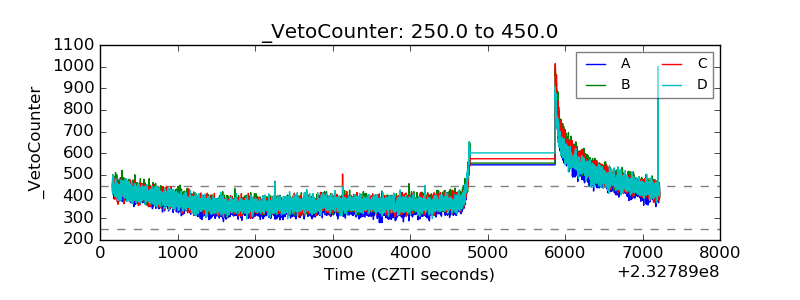 |