| Param | Original file | Final file |
|---|---|---|
| Filename | modeM0/AS1A03_036T01_9000001230_08857cztM0_level2.evt | modeM0/AS1A03_036T01_9000001230_08857cztM0_level2_quad_clean.evt |
| Size (bytes) | 433,460,160 | 94,389,120 |
| Size | 413.4 MB | 90.0 MB |
| Events in quadrant A | 3,444,010 | 624,007 |
| Events in quadrant B | 3,088,556 | 628,045 |
| Events in quadrant C | 2,666,208 | 613,357 |
| Events in quadrant D | 3,544,014 | 597,155 |
| Mode SS | |||
|---|---|---|---|
| Quadrant | BADHDUFLAG | Total packets | Discarded packets |
| A | 0 | 114 | 0 |
| B | 0 | 114 | 0 |
| C | 0 | 114 | 0 |
| D | 0 | 114 | 0 |
| Mode M9 | |||
|---|---|---|---|
| Quadrant | BADHDUFLAG | Total packets | Discarded packets |
| A | 0 | 13 | 0 |
| B | 0 | 13 | 0 |
| C | 0 | 13 | 0 |
| D | 0 | 13 | 0 |
| Mode M0 | |||
|---|---|---|---|
| Quadrant | BADHDUFLAG | Total packets | Discarded packets |
| A | 0 | 13945 | 2 |
| B | 0 | 12951 | 1 |
| C | 0 | 11668 | 1 |
| D | 0 | 14444 | 1 |
| Quadrant | Total seconds | Saturated seconds | Saturation percentage |
|---|---|---|---|
| A | 5665 | 156 | 2.753751% |
| B | 5665 | 91 | 1.606355% |
| C | 5665 | 59 | 1.041483% |
| D | 5665 | 66 | 1.165049% |
Noise dominated data is calculated using 1-second bins in cleaned event files. If a bin has >2000 counts, and if more than 50% of those come from <1% of pixels, then it is considered to be noise-dominated and hence unusable.
| Quadrant | # 1 sec bins | Bins with >0 counts | Bins with >2000 counts | High rate bins dominated by noise | Noise dominated (total time) | Noise dominated (detector-on time) | Marked lightcurve |
|---|---|---|---|---|---|---|---|
| A | 6940 | 5665 | 51 | 51 | 0.73% | 0.90% | 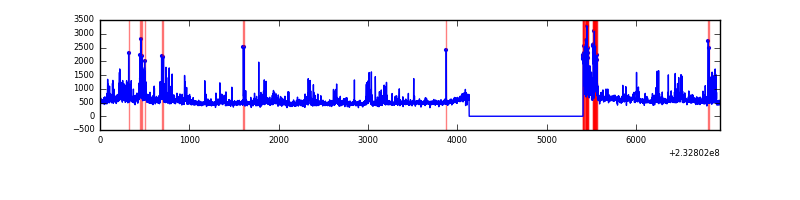 |
| B | 6940 | 5665 | 27 | 27 | 0.39% | 0.48% | 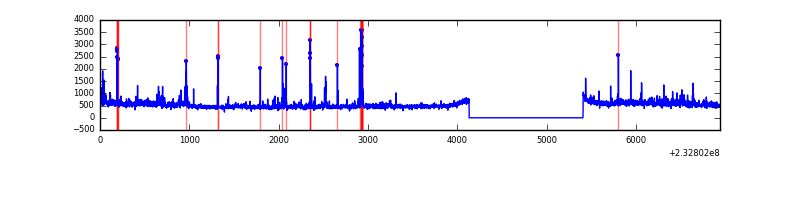 |
| C | 6940 | 5665 | 2 | 2 | 0.03% | 0.04% | 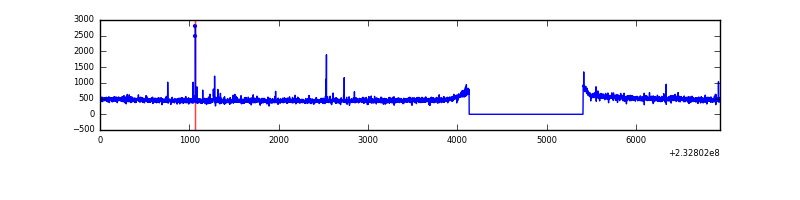 |
| D | 6940 | 5665 | 12 | 12 | 0.17% | 0.21% |  |
Top three noisy pixels from each quadrant. If the there are fewer than three noisy pixels in the level2.evt file, extra rows are filled as -1
| Pixel properties | Quadrant properties | ||||||
|---|---|---|---|---|---|---|---|
| Quadrant | DetID | PixID | Counts | Sigma | Mean | Median | Sigma |
| A | 8 | 5 | 717226 | 5183.28 | 693 | 679 | 138.2 |
| A | 15 | 174 | 31624 | 223.85 | 693 | 679 | 138.2 |
| A | 3 | 1 | 14758 | 101.84 | 693 | 679 | 138.2 |
| B | 0 | 214 | 144401 | 1102.4 | 694 | 679 | 130.4 |
| B | 10 | 16 | 96856 | 737.71 | 694 | 679 | 130.4 |
| B | 0 | 230 | 27495 | 205.69 | 694 | 679 | 130.4 |
| C | 1 | 3 | 27401 | 173.4 | 674 | 677 | 154.1 |
| C | 13 | 61 | 5230 | 29.54 | 674 | 677 | 154.1 |
| C | 14 | 234 | 3750 | 19.94 | 674 | 677 | 154.1 |
| D | 8 | 195 | 605155 | 3331.43 | 675 | 659 | 181.5 |
| D | 2 | 152 | 100786 | 551.81 | 675 | 659 | 181.5 |
| D | 7 | 71 | 75574 | 412.86 | 675 | 659 | 181.5 |
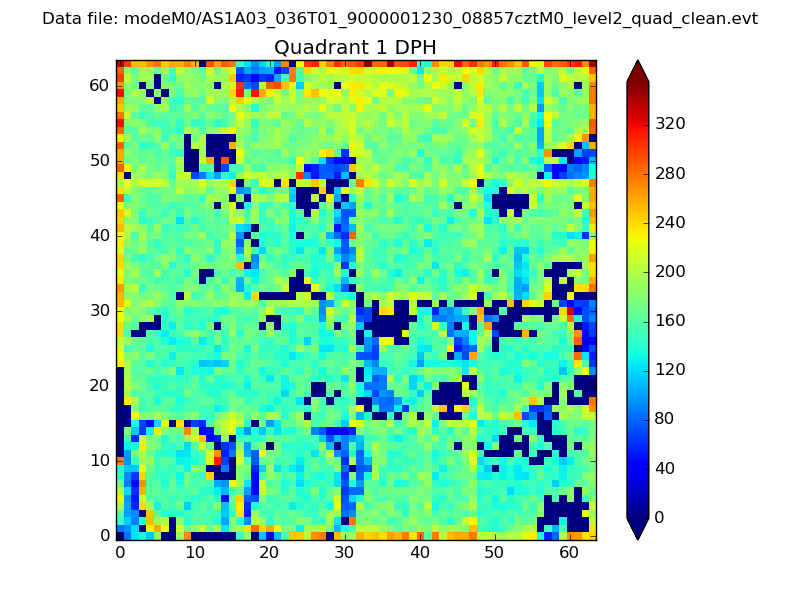
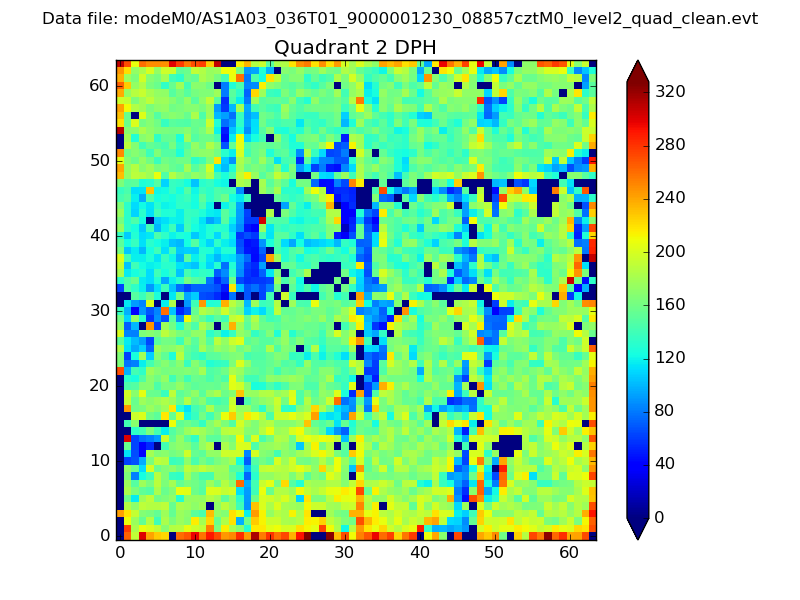
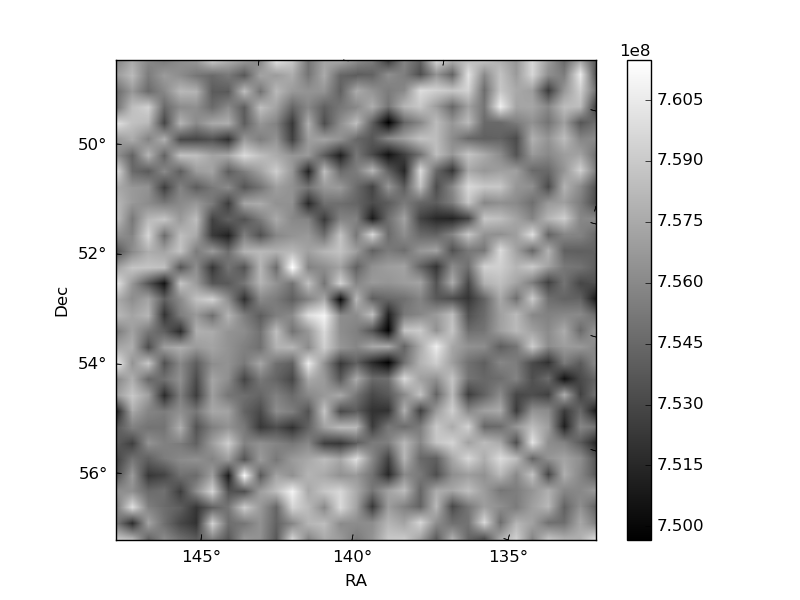
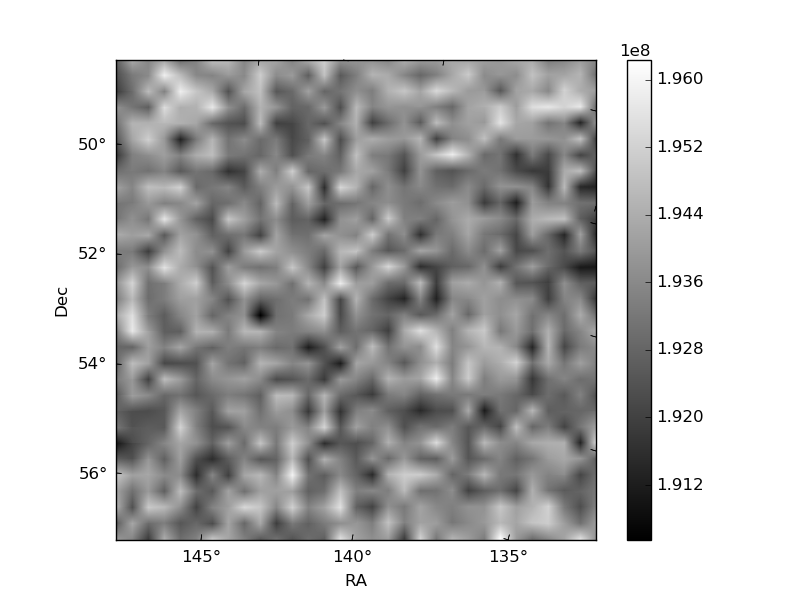
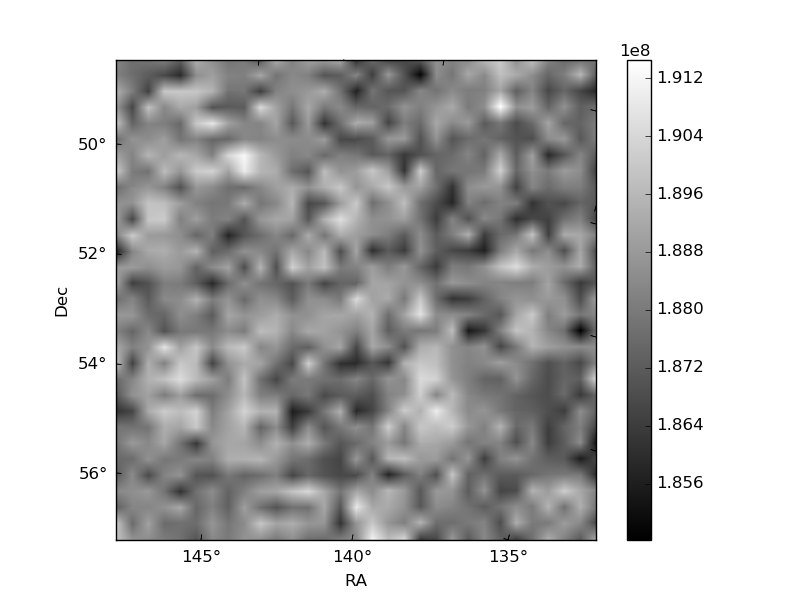
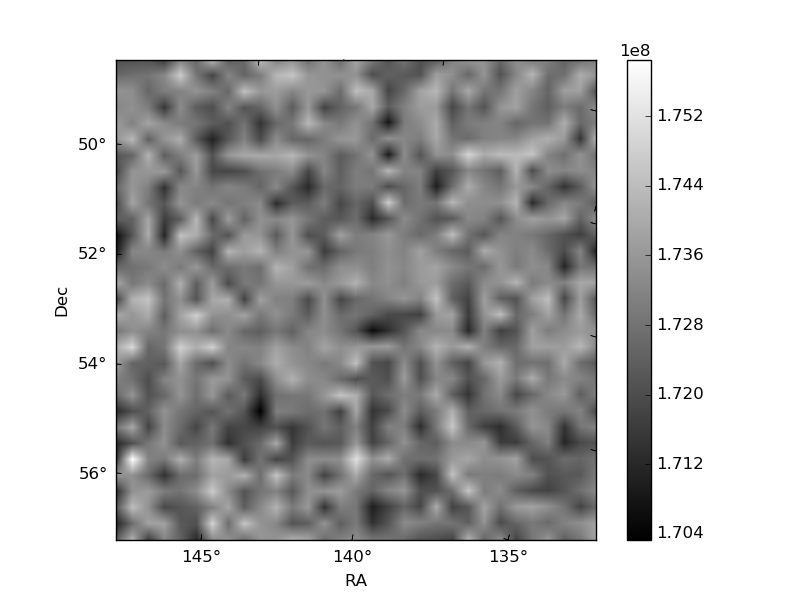
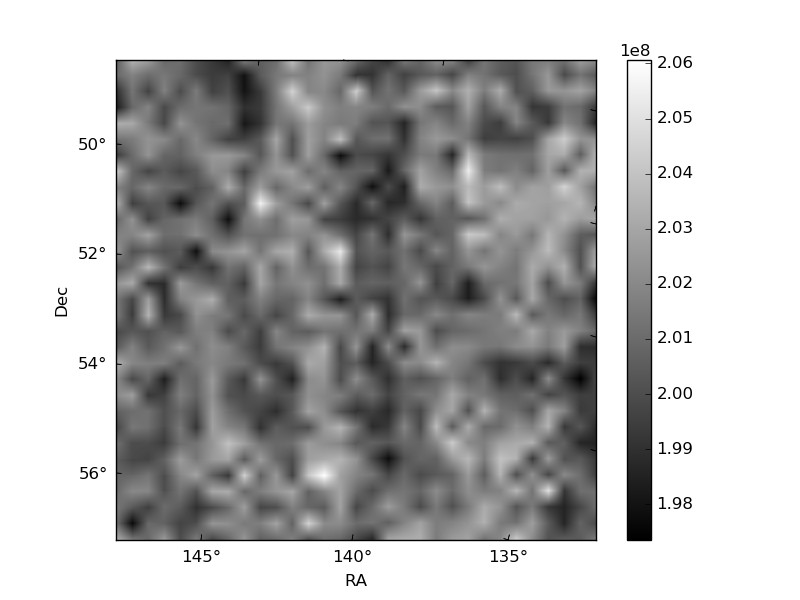
Histogram calculated using DETX and DETY for each event in the final _common_clean file
| Quadrant A | 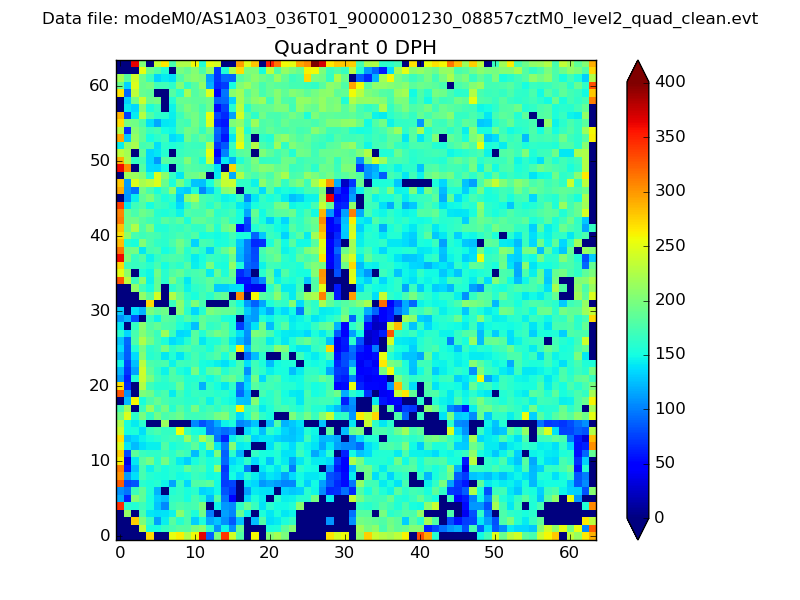 |
 |
Quadrant B |
|---|---|---|---|
| Quadrant D | 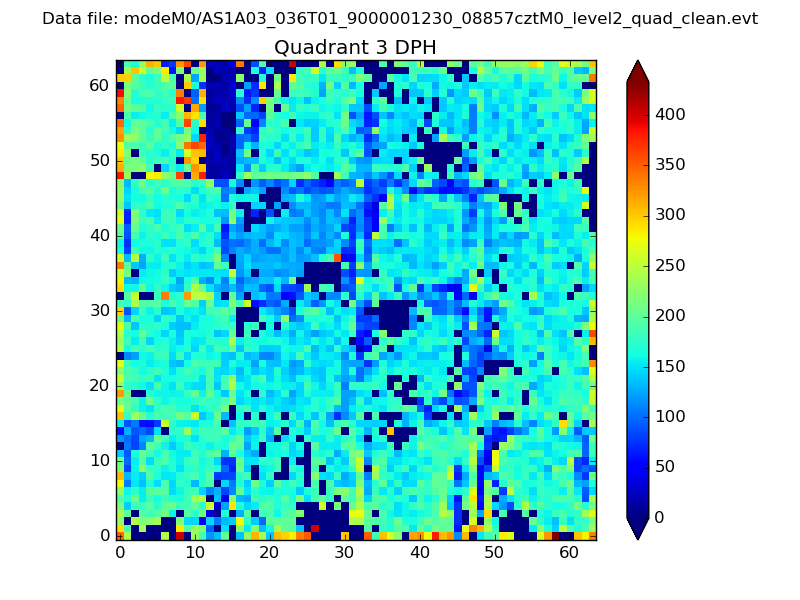 |
 |
Quadrant C |
| Plot type | Count rate plots | Images |
|---|---|---|
| Comparison with Poisson distribution Blue bars denote a histogram of data divided into 1 sec bins. Red curve is a Poisson curve with rate = median count rate of data. |
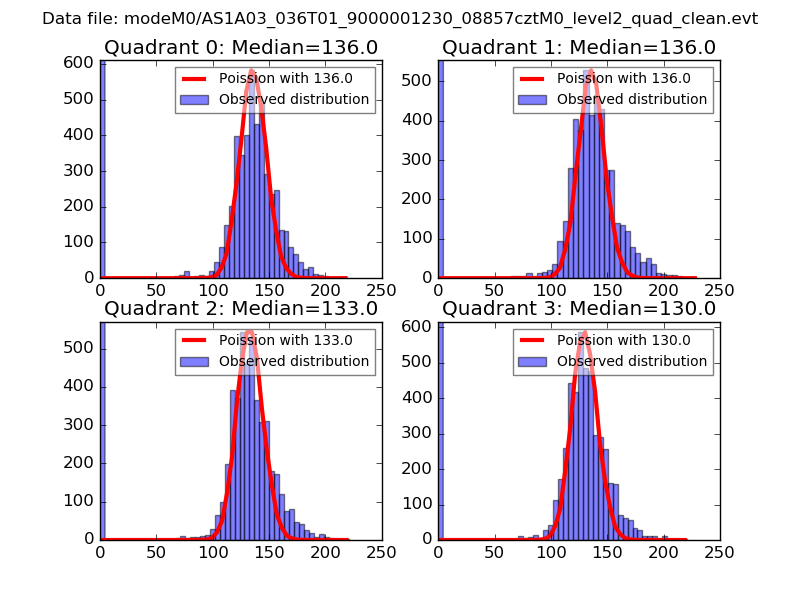 |
 |
| Quadrant-wise count rates Data is divided into 100 sec bins |
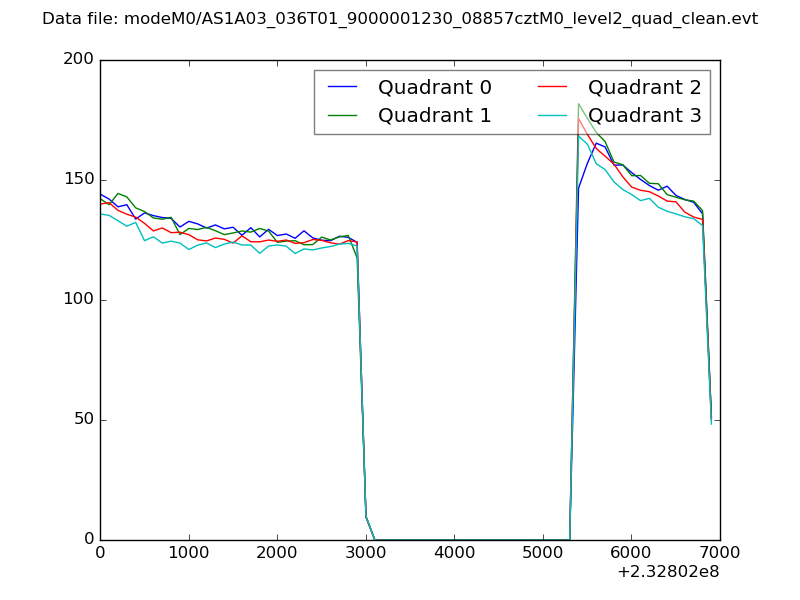 |
|
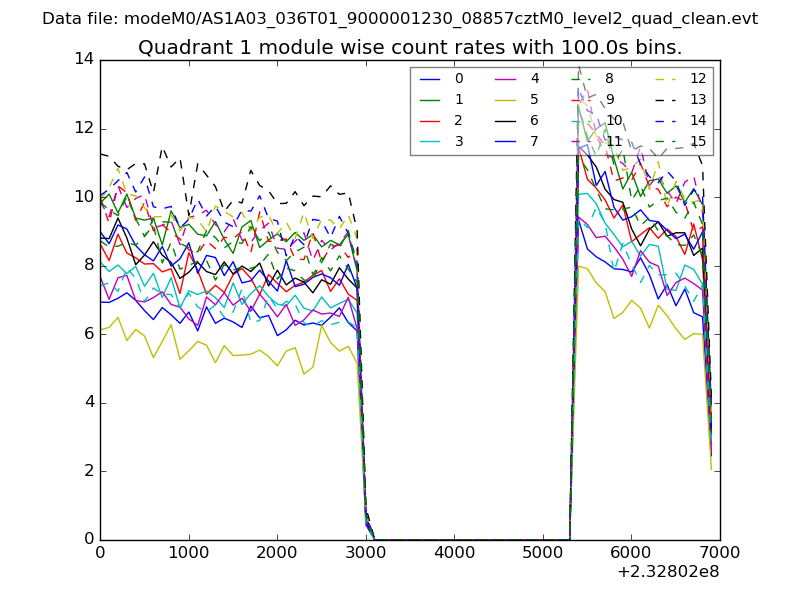
| Module-wise count rates for Quadrant A Data is divided into 100 sec bins |
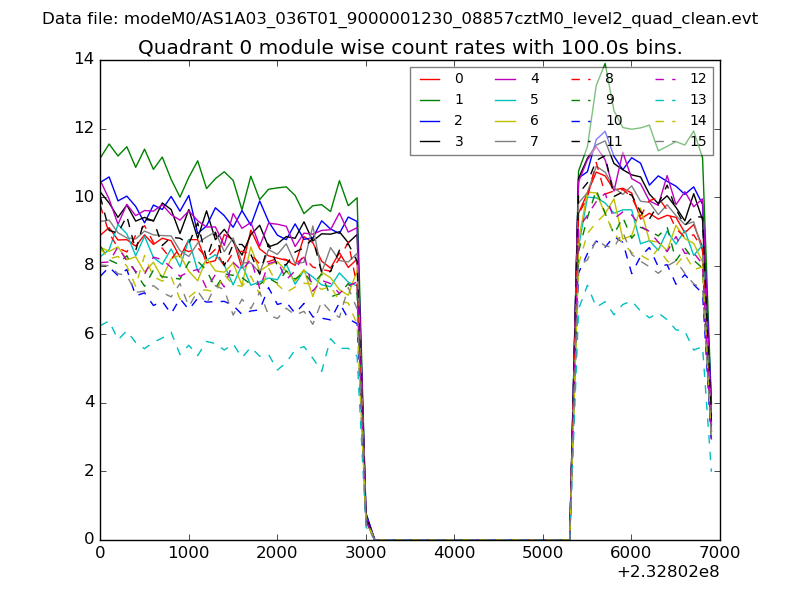 |
 |
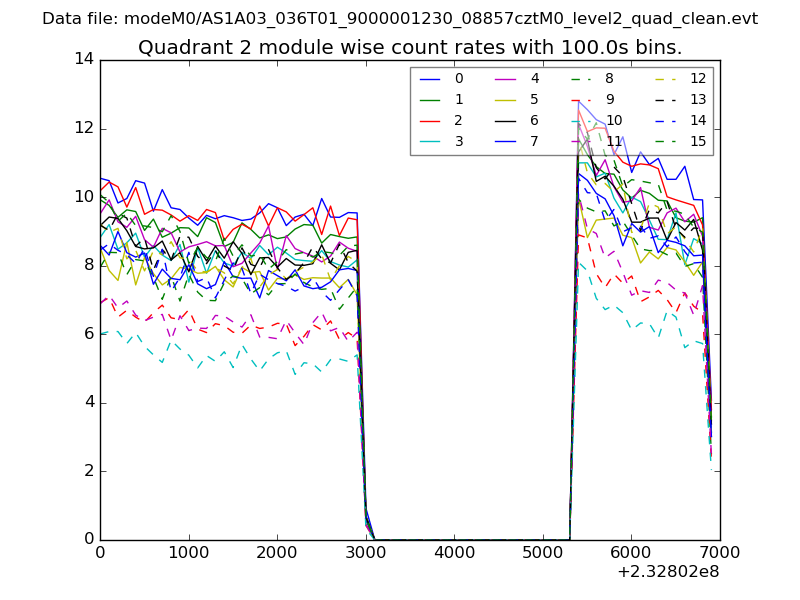
| Module-wise count rates for Quadrant B Data is divided into 100 sec bins |
 |
 |
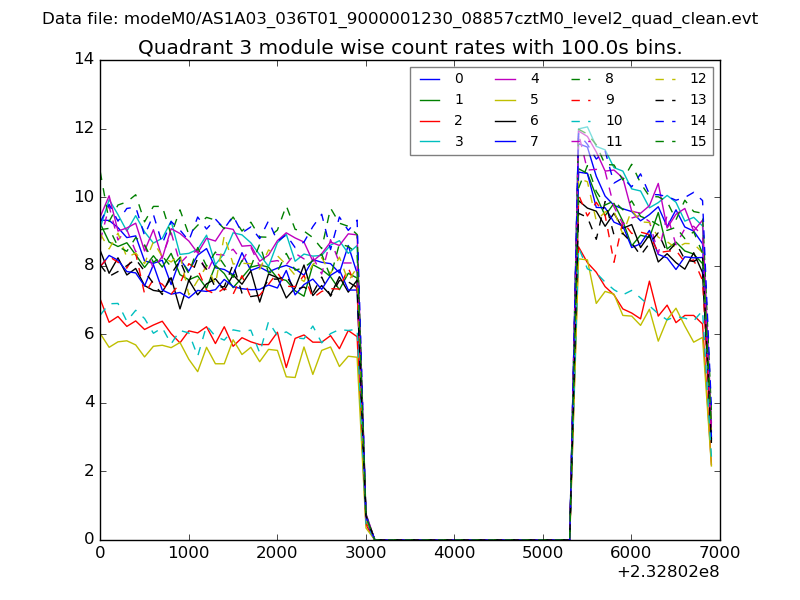
| Module-wise count rates for Quadrant C Data is divided into 100 sec bins |
 |
 |
| Module-wise count rates for Quadrant D Data is divided into 100 sec bins |
 |
 |
| Parameter | Plot |
|---|---|
| CZT HV Monitor | 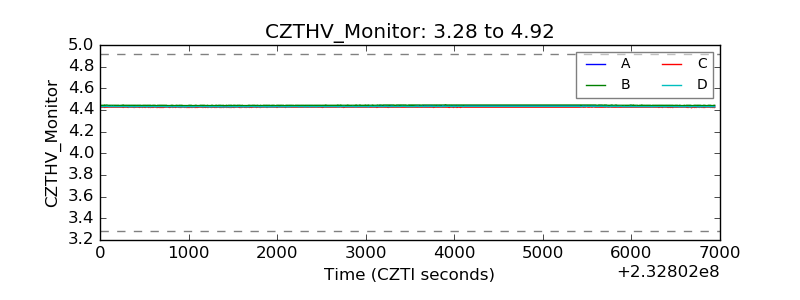 |
| D_VDD | 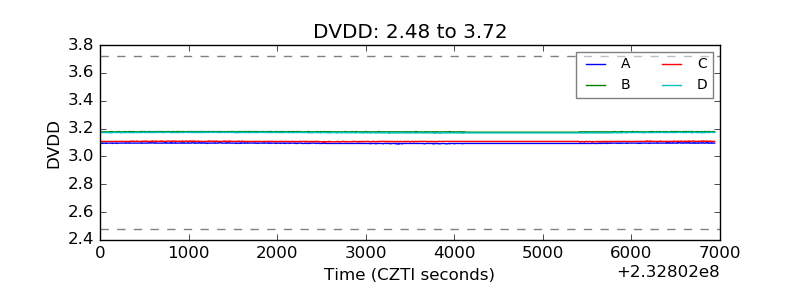 |
| Temperature 1 |  |
| Veto HV Monitor | 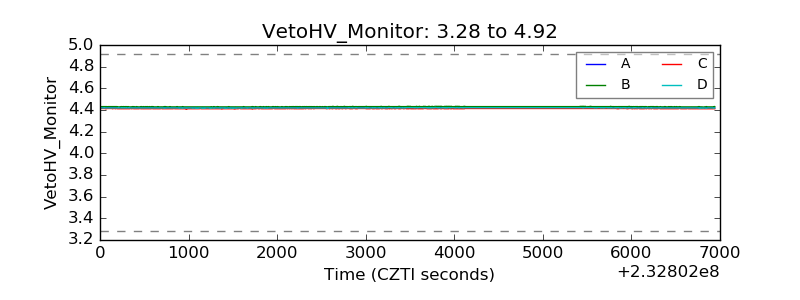 |
| Veto LLD | 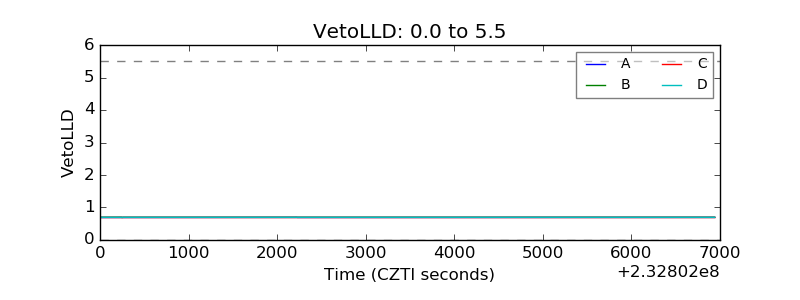 |
| Alpha Counter | 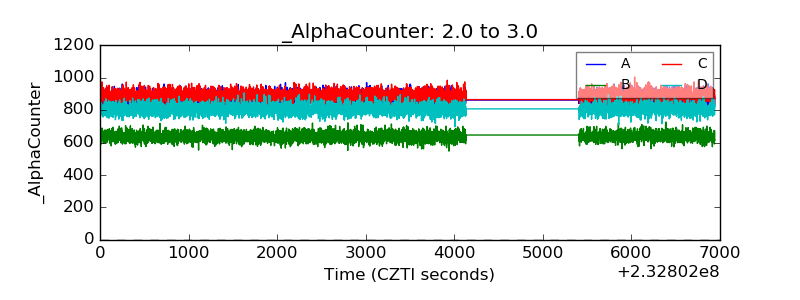 |
| _CPM_Rate | 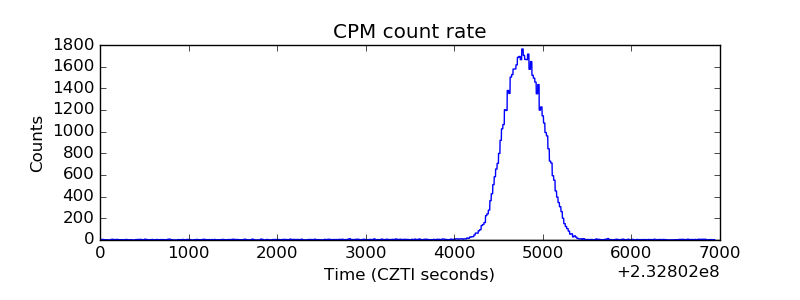 |
| CZT Counter | 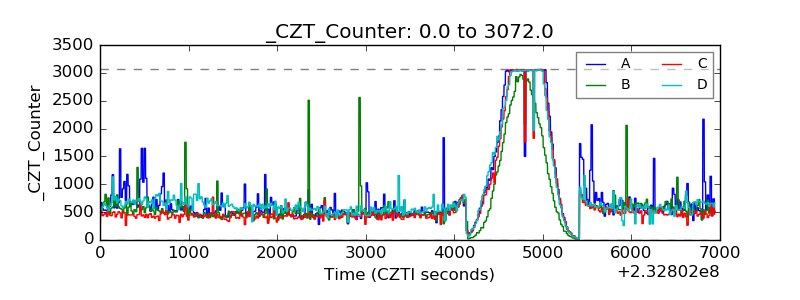 |
| +2.5 Volts monitor |  |
| +5 Volts monitor |  |
| _ROLL_ROT | 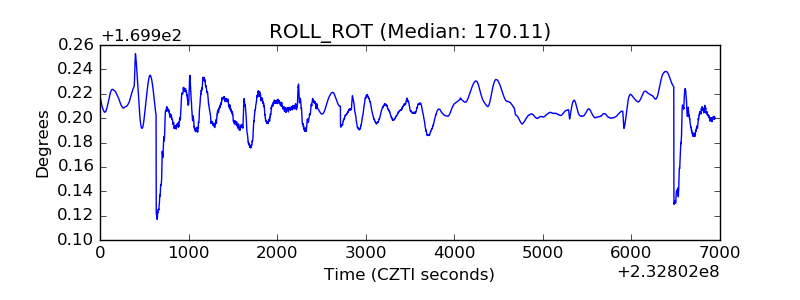 |
| _Roll_DEC | 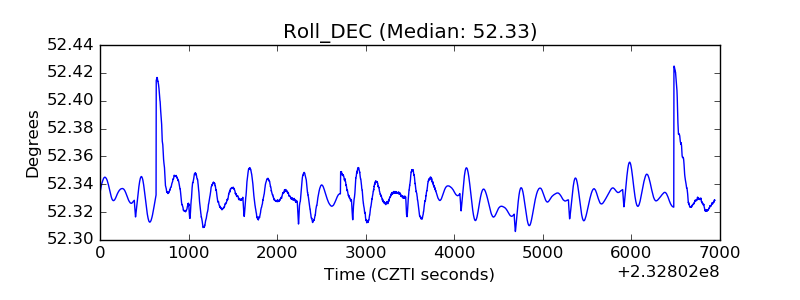 |
| _Roll_RA | 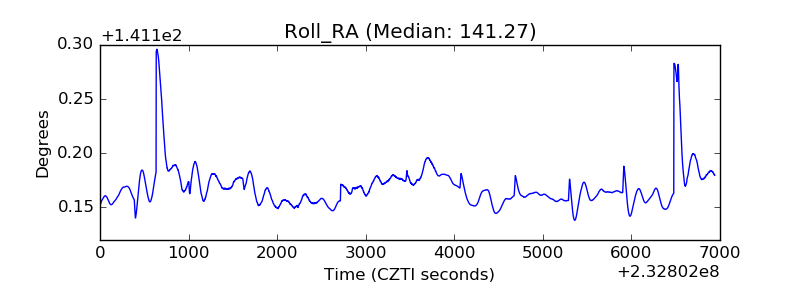 |
| Veto Counter | 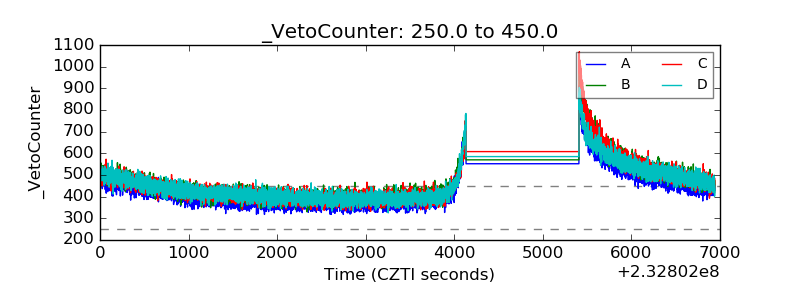 |