| Param | Original file | Final file |
|---|---|---|
| Filename | modeM0/AS1A03_036T01_9000001230_08858cztM0_level2.evt | modeM0/AS1A03_036T01_9000001230_08858cztM0_level2_quad_clean.evt |
| Size (bytes) | 490,530,240 | 97,626,240 |
| Size | 467.8 MB | 93.1 MB |
| Events in quadrant A | 4,133,437 | 639,990 |
| Events in quadrant B | 3,579,589 | 638,273 |
| Events in quadrant C | 2,915,761 | 636,633 |
| Events in quadrant D | 3,810,918 | 613,594 |
| Mode SS | |||
|---|---|---|---|
| Quadrant | BADHDUFLAG | Total packets | Discarded packets |
| A | 0 | 124 | 0 |
| B | 0 | 124 | 0 |
| C | 0 | 124 | 0 |
| D | 0 | 124 | 0 |
| Mode M9 | |||
|---|---|---|---|
| Quadrant | BADHDUFLAG | Total packets | Discarded packets |
| A | 0 | 13 | 0 |
| B | 0 | 13 | 0 |
| C | 0 | 13 | 0 |
| D | 0 | 13 | 0 |
| Mode M0 | |||
|---|---|---|---|
| Quadrant | BADHDUFLAG | Total packets | Discarded packets |
| A | 0 | 16297 | 2 |
| B | 0 | 14684 | 1 |
| C | 0 | 12617 | 1 |
| D | 0 | 15257 | 1 |
| Quadrant | Total seconds | Saturated seconds | Saturation percentage |
|---|---|---|---|
| A | 6133 | 279 | 4.549160% |
| B | 6133 | 224 | 3.652372% |
| C | 6133 | 39 | 0.635904% |
| D | 6133 | 97 | 1.581608% |
Noise dominated data is calculated using 1-second bins in cleaned event files. If a bin has >2000 counts, and if more than 50% of those come from <1% of pixels, then it is considered to be noise-dominated and hence unusable.
| Quadrant | # 1 sec bins | Bins with >0 counts | Bins with >2000 counts | High rate bins dominated by noise | Noise dominated (total time) | Noise dominated (detector-on time) | Marked lightcurve |
|---|---|---|---|---|---|---|---|
| A | 7448 | 6134 | 126 | 126 | 1.69% | 2.05% | 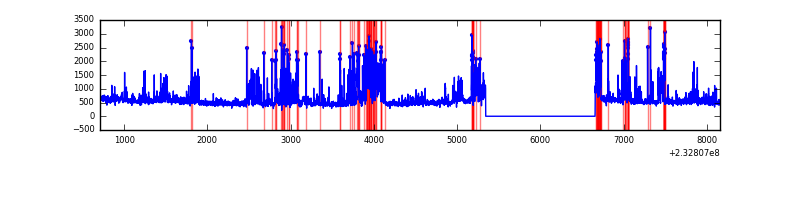 |
| B | 7448 | 6134 | 150 | 150 | 2.01% | 2.45% | 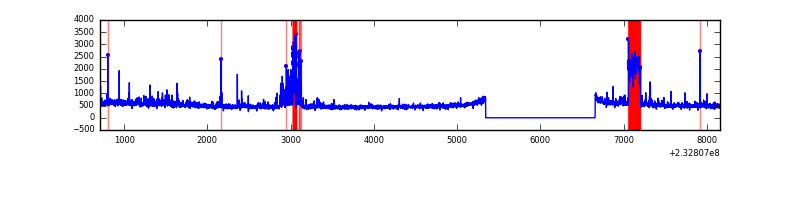 |
| C | 7448 | 6134 | 0 | 0 | 0.00% | 0.00% | 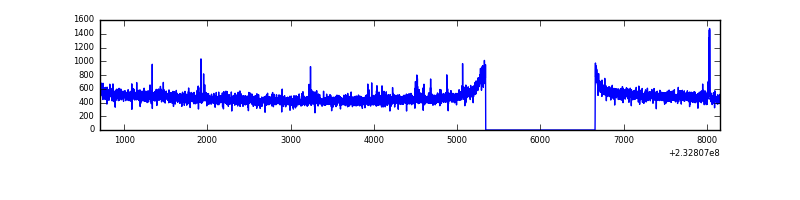 |
| D | 7448 | 6134 | 28 | 28 | 0.38% | 0.46% | 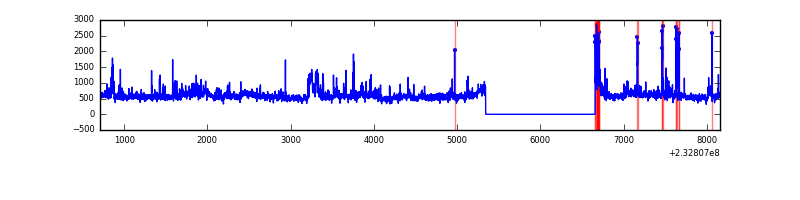 |
Top three noisy pixels from each quadrant. If the there are fewer than three noisy pixels in the level2.evt file, extra rows are filled as -1
| Pixel properties | Quadrant properties | ||||||
|---|---|---|---|---|---|---|---|
| Quadrant | DetID | PixID | Counts | Sigma | Mean | Median | Sigma |
| A | 8 | 5 | 1215592 | 8097.58 | 750 | 734 | 150.0 |
| A | 3 | 1 | 17440 | 111.35 | 750 | 734 | 150.0 |
| A | 0 | 226 | 7401 | 44.44 | 750 | 734 | 150.0 |
| B | 4 | 48 | 465550 | 3313.96 | 747 | 730 | 140.3 |
| B | 0 | 214 | 95338 | 674.51 | 747 | 730 | 140.3 |
| B | 0 | 219 | 26948 | 186.92 | 747 | 730 | 140.3 |
| C | 14 | 234 | 13993 | 79.14 | 738 | 742 | 167.4 |
| C | 9 | 54 | 8304 | 45.16 | 738 | 742 | 167.4 |
| C | 12 | 4 | 7100 | 37.97 | 738 | 742 | 167.4 |
| D | 8 | 195 | 536402 | 2994.44 | 742 | 721 | 178.9 |
| D | 1 | 52 | 150256 | 835.9 | 742 | 721 | 178.9 |
| D | 7 | 71 | 88736 | 492.0 | 742 | 721 | 178.9 |
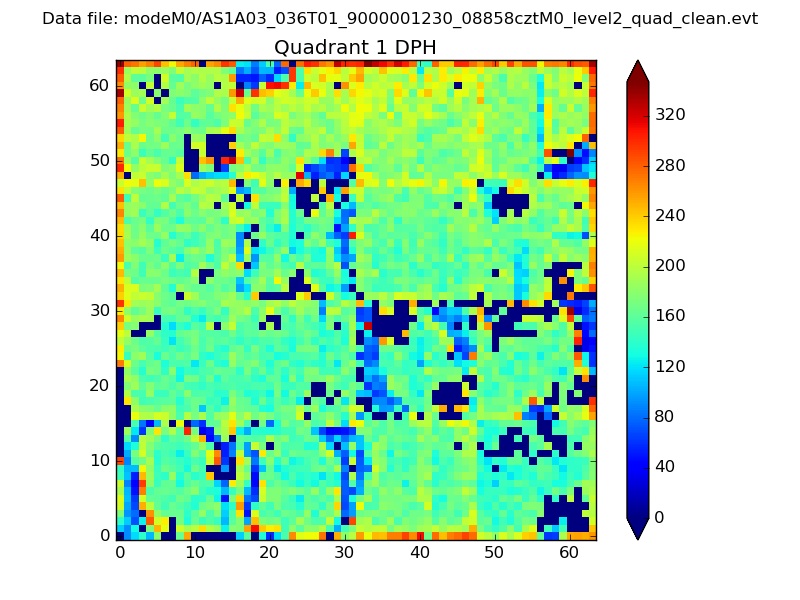
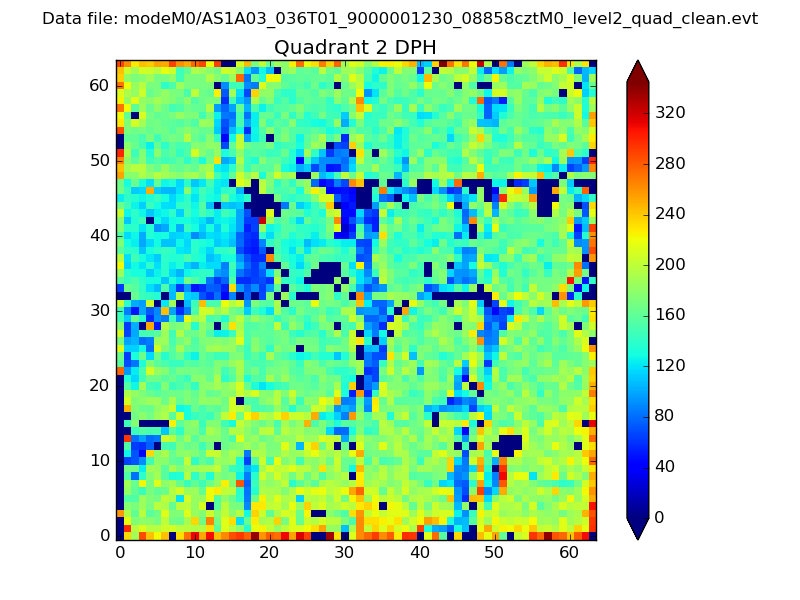
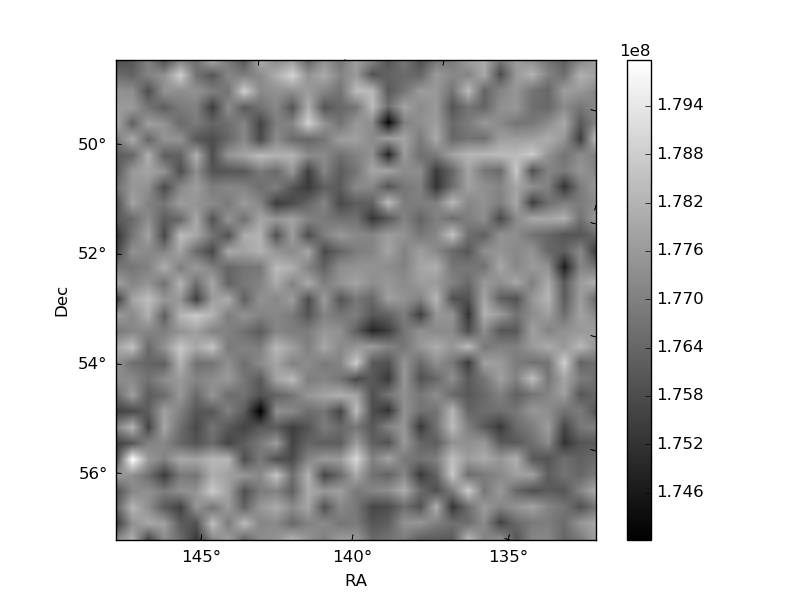
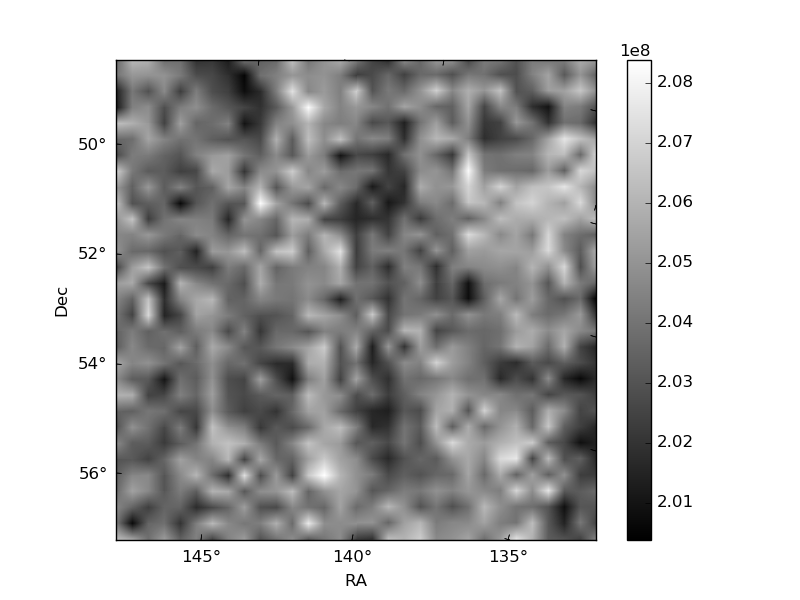
Histogram calculated using DETX and DETY for each event in the final _common_clean file
| Quadrant A |  |
 |
Quadrant B |
|---|---|---|---|
| Quadrant D |  |
 |
Quadrant C |
| Plot type | Count rate plots | Images |
|---|---|---|
| Comparison with Poisson distribution Blue bars denote a histogram of data divided into 1 sec bins. Red curve is a Poisson curve with rate = median count rate of data. |
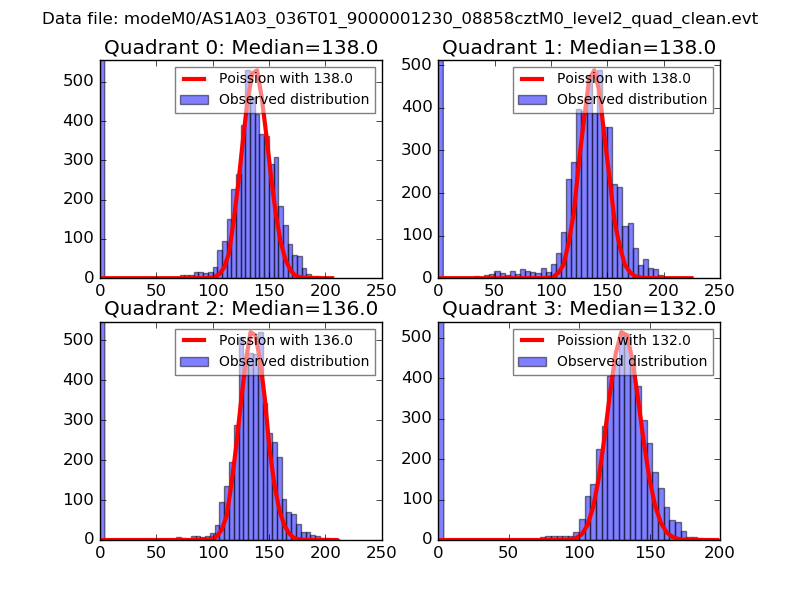 |
 |
| Quadrant-wise count rates Data is divided into 100 sec bins |
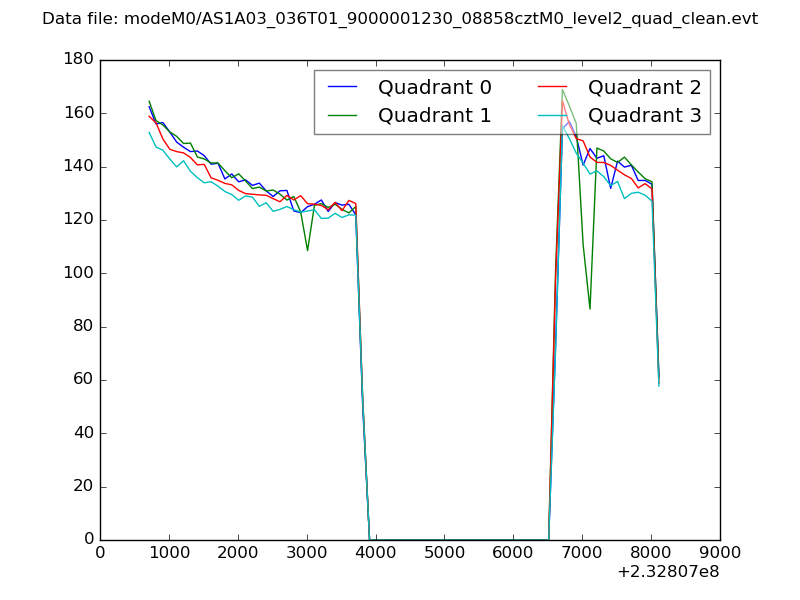 |
|
| Module-wise count rates for Quadrant A Data is divided into 100 sec bins |
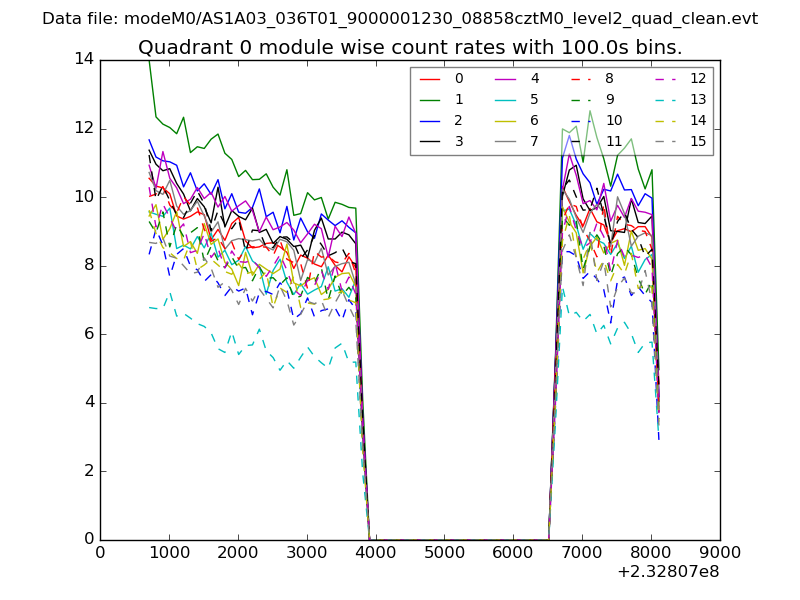 |
 |
| Module-wise count rates for Quadrant B Data is divided into 100 sec bins |
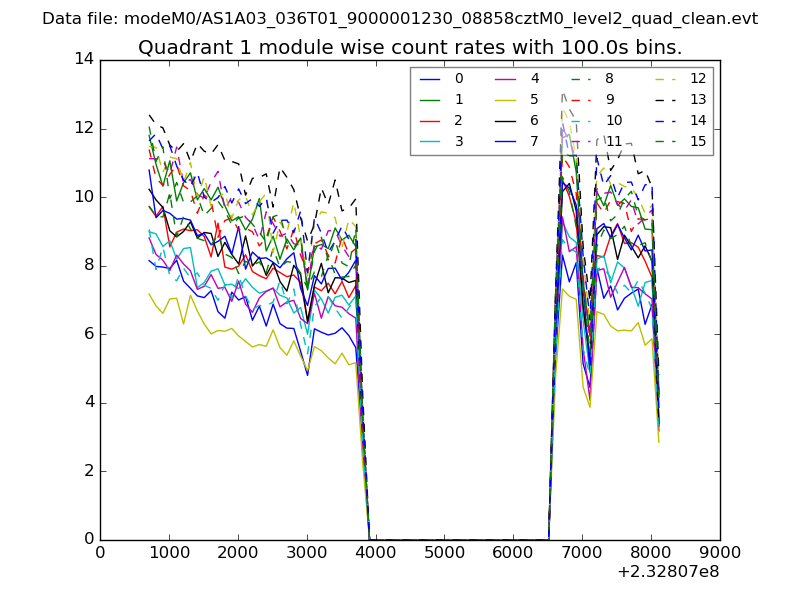 |
 |
| Module-wise count rates for Quadrant C Data is divided into 100 sec bins |
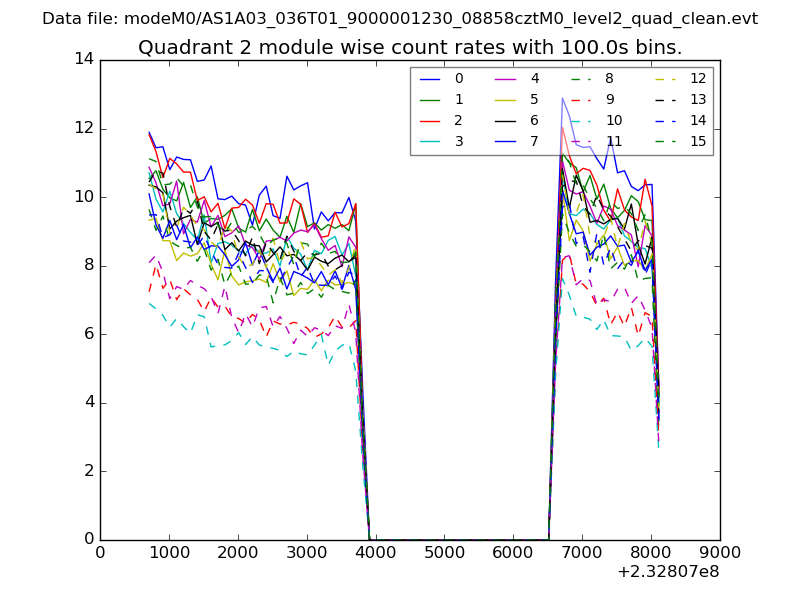 |
 |
| Module-wise count rates for Quadrant D Data is divided into 100 sec bins |
 |
 |
| Parameter | Plot |
|---|---|
| CZT HV Monitor | 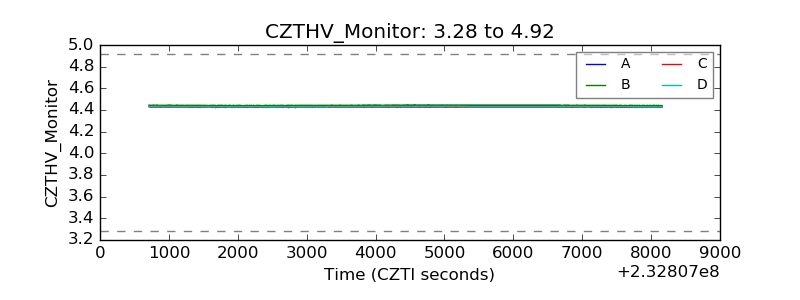 |
| D_VDD | 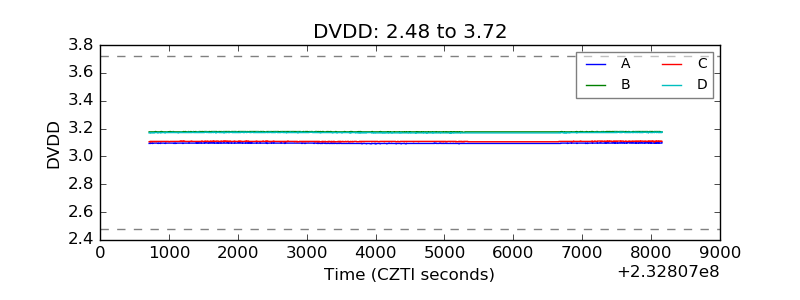 |
| Temperature 1 | 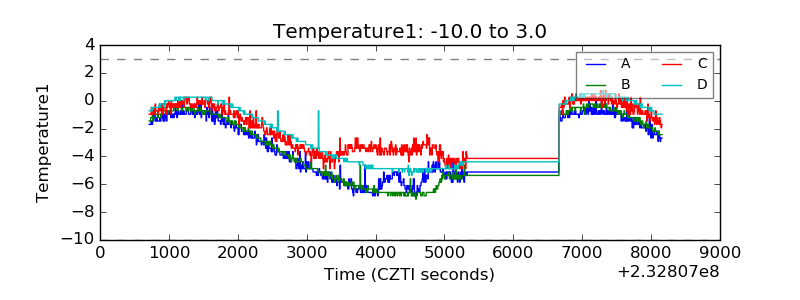 |
| Veto HV Monitor |  |
| Veto LLD | 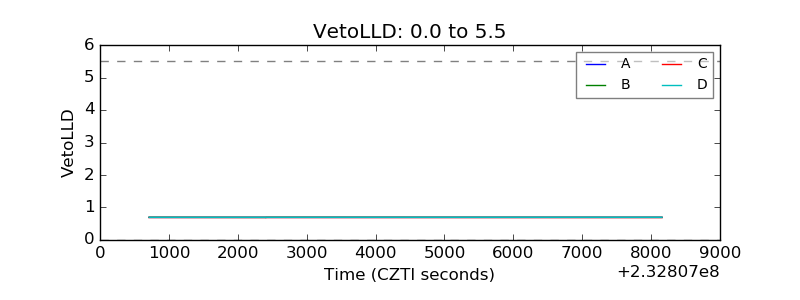 |
| Alpha Counter | 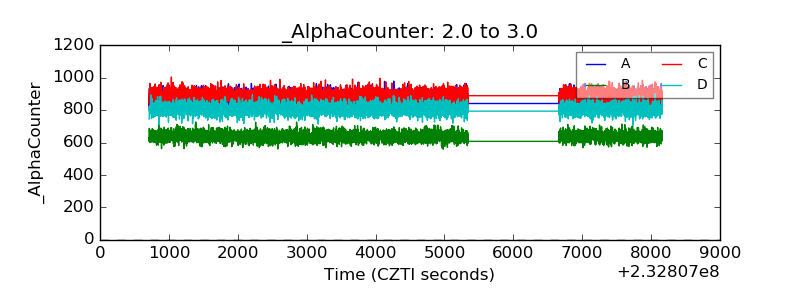 |
| _CPM_Rate |  |
| CZT Counter | 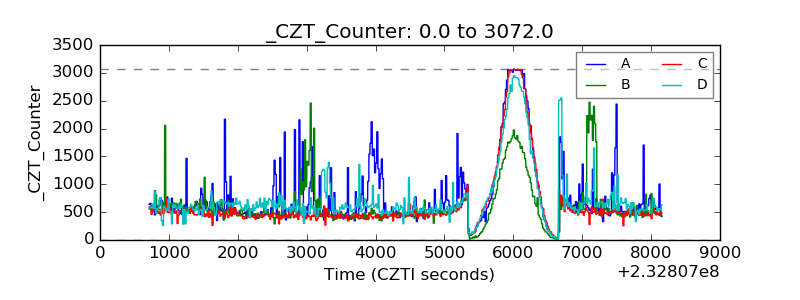 |
| +2.5 Volts monitor | 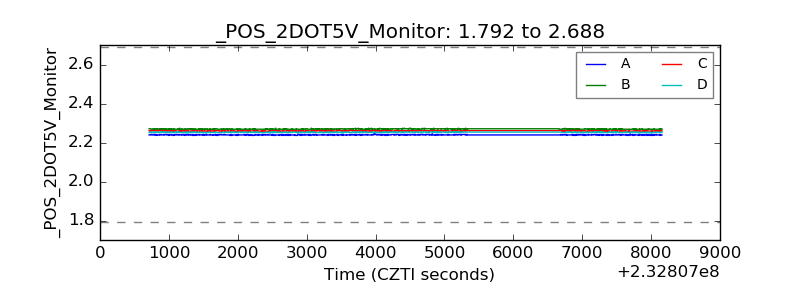 |
| +5 Volts monitor | 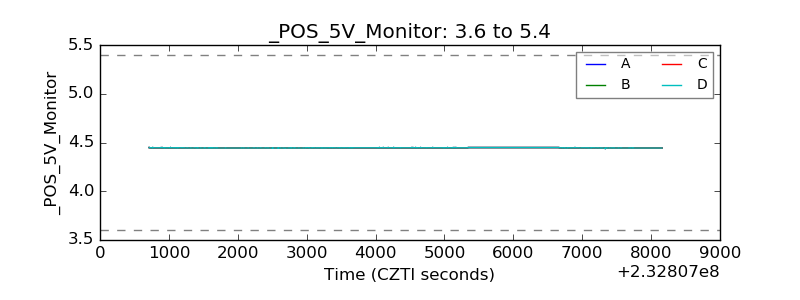 |
| _ROLL_ROT | 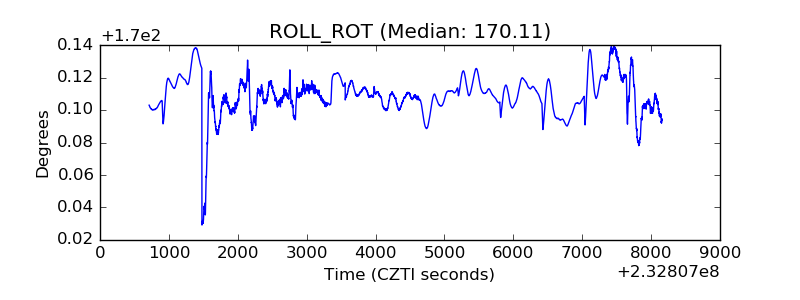 |
| _Roll_DEC | 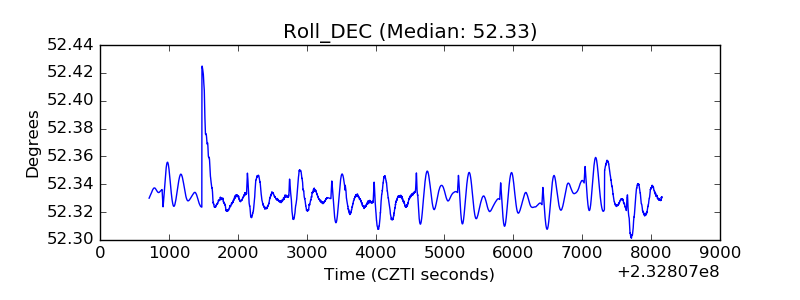 |
| _Roll_RA | 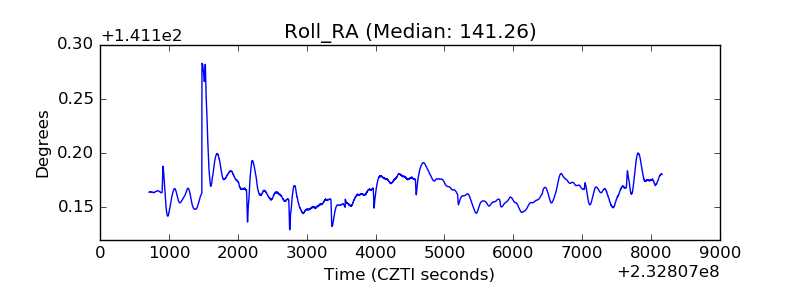 |
| Veto Counter | 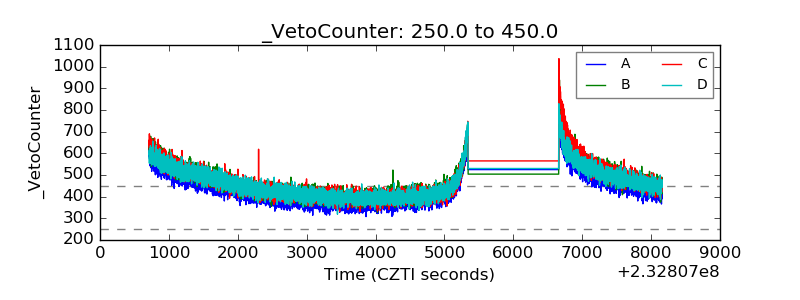 |