| Param | Original file | Final file |
|---|---|---|
| Filename | modeM0/AS1A03_036T01_9000001230_08859cztM0_level2.evt | modeM0/AS1A03_036T01_9000001230_08859cztM0_level2_quad_clean.evt |
| Size (bytes) | 382,155,840 | 67,311,360 |
| Size | 364.5 MB | 64.2 MB |
| Events in quadrant A | 2,754,802 | 428,796 |
| Events in quadrant B | 2,847,440 | 422,364 |
| Events in quadrant C | 2,406,116 | 429,528 |
| Events in quadrant D | 3,213,722 | 395,703 |
| Mode SS | |||
|---|---|---|---|
| Quadrant | BADHDUFLAG | Total packets | Discarded packets |
| A | 0 | 120 | 12 |
| B | 0 | 120 | 10 |
| C | 0 | 120 | 10 |
| D | 0 | 120 | 16 |
| Mode M9 | |||
|---|---|---|---|
| Quadrant | BADHDUFLAG | Total packets | Discarded packets |
| A | 0 | 13 | 0 |
| B | 0 | 13 | 0 |
| C | 0 | 13 | 0 |
| D | 0 | 13 | 0 |
| Mode M0 | |||
|---|---|---|---|
| Quadrant | BADHDUFLAG | Total packets | Discarded packets |
| A | 0 | 13382 | 1851 |
| B | 0 | 14301 | 2525 |
| C | 0 | 12087 | 1411 |
| D | 0 | 15146 | 2327 |
| Quadrant | Total seconds | Saturated seconds | Saturation percentage |
|---|---|---|---|
| A | 5167 | 68 | 1.316044% |
| B | 5134 | 114 | 2.220491% |
| C | 5200 | 26 | 0.500000% |
| D | 5062 | 105 | 2.074279% |
Noise dominated data is calculated using 1-second bins in cleaned event files. If a bin has >2000 counts, and if more than 50% of those come from <1% of pixels, then it is considered to be noise-dominated and hence unusable.
| Quadrant | # 1 sec bins | Bins with >0 counts | Bins with >2000 counts | High rate bins dominated by noise | Noise dominated (total time) | Noise dominated (detector-on time) | Marked lightcurve |
|---|---|---|---|---|---|---|---|
| A | 7185 | 5577 | 15 | 15 | 0.21% | 0.27% |  |
| B | 7077 | 5552 | 73 | 73 | 1.03% | 1.31% |  |
| C | 7191 | 5626 | 0 | 0 | 0.00% | 0.00% |  |
| D | 7182 | 5515 | 71 | 71 | 0.99% | 1.29% |  |
Top three noisy pixels from each quadrant. If the there are fewer than three noisy pixels in the level2.evt file, extra rows are filled as -1
| Pixel properties | Quadrant properties | ||||||
|---|---|---|---|---|---|---|---|
| Quadrant | DetID | PixID | Counts | Sigma | Mean | Median | Sigma |
| A | 8 | 5 | 367783 | 2953.7 | 614 | 600 | 124.3 |
| A | 3 | 1 | 8096 | 60.3 | 614 | 600 | 124.3 |
| A | 5 | 16 | 7307 | 53.95 | 614 | 600 | 124.3 |
| B | 4 | 48 | 139800 | 1207.7 | 611 | 598 | 115.3 |
| B | 10 | 16 | 115880 | 1000.17 | 611 | 598 | 115.3 |
| B | 0 | 219 | 81479 | 701.71 | 611 | 598 | 115.3 |
| C | 9 | 54 | 12643 | 85.93 | 608 | 611 | 140.0 |
| C | 14 | 234 | 11724 | 79.36 | 608 | 611 | 140.0 |
| C | 1 | 16 | 4979 | 31.19 | 608 | 611 | 140.0 |
| D | 8 | 195 | 297163 | 2092.84 | 589 | 570 | 141.7 |
| D | 1 | 52 | 235633 | 1658.67 | 589 | 570 | 141.7 |
| D | 12 | 233 | 184931 | 1300.9 | 589 | 570 | 141.7 |
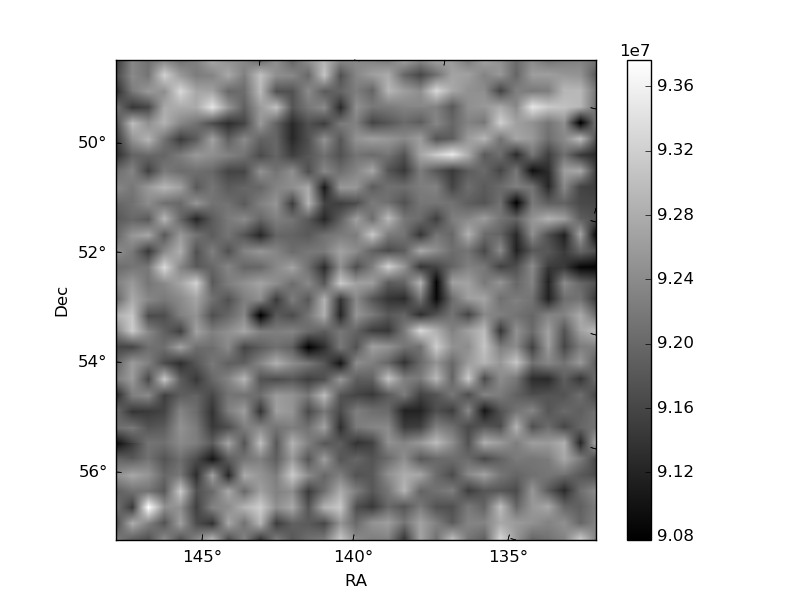
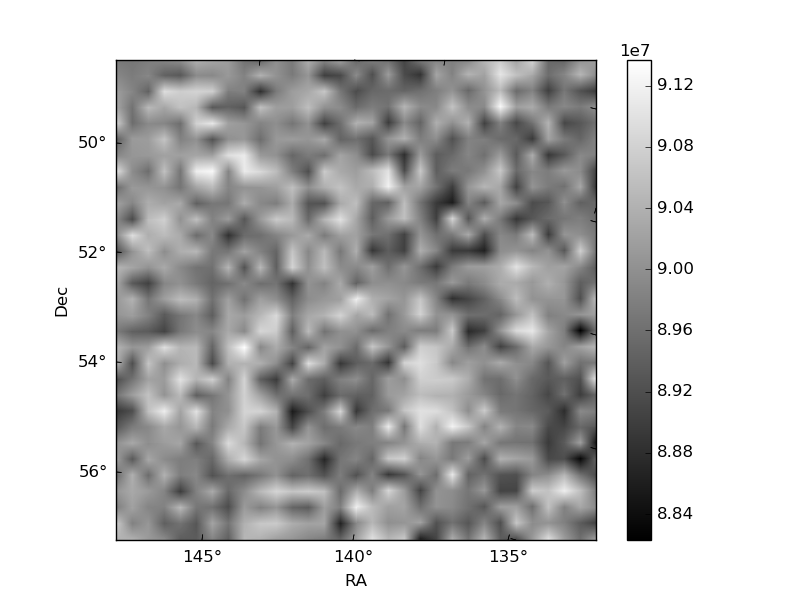
Histogram calculated using DETX and DETY for each event in the final _common_clean file
| Quadrant A | 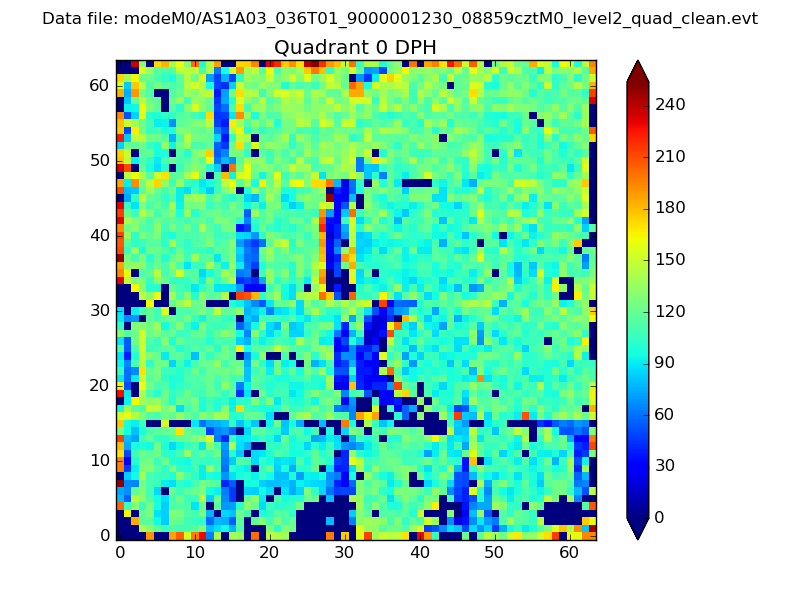 |
 |
Quadrant B |
|---|---|---|---|
| Quadrant D |  |
 |
Quadrant C |
| Plot type | Count rate plots | Images |
|---|---|---|
| Comparison with Poisson distribution Blue bars denote a histogram of data divided into 1 sec bins. Red curve is a Poisson curve with rate = median count rate of data. |
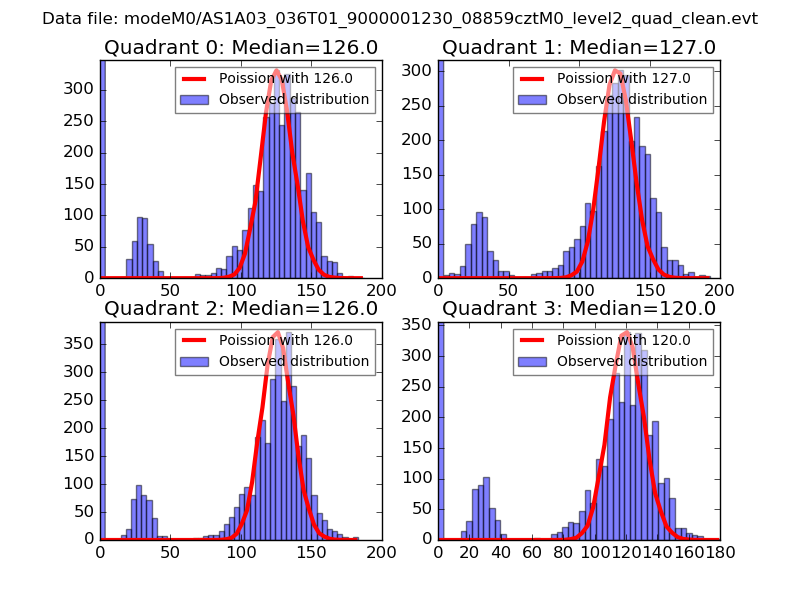 |
 |
| Quadrant-wise count rates Data is divided into 100 sec bins |
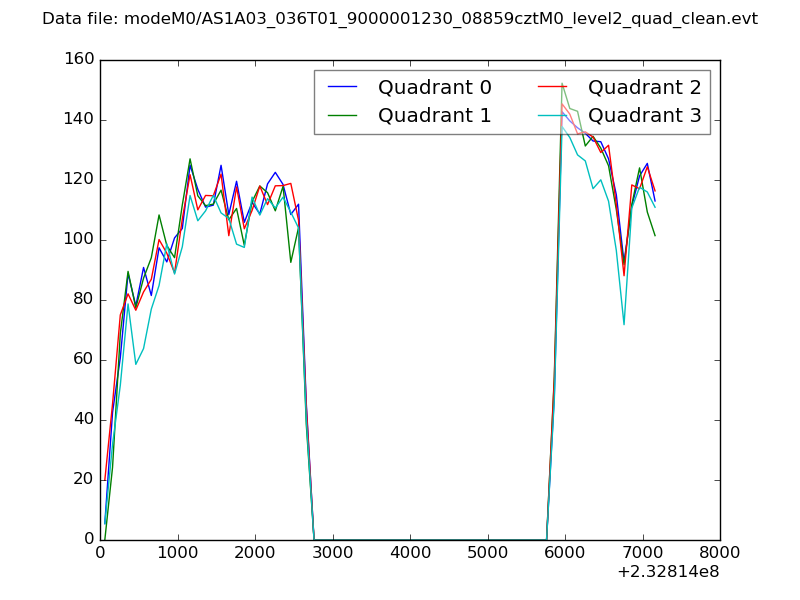 |
|
| Module-wise count rates for Quadrant A Data is divided into 100 sec bins |
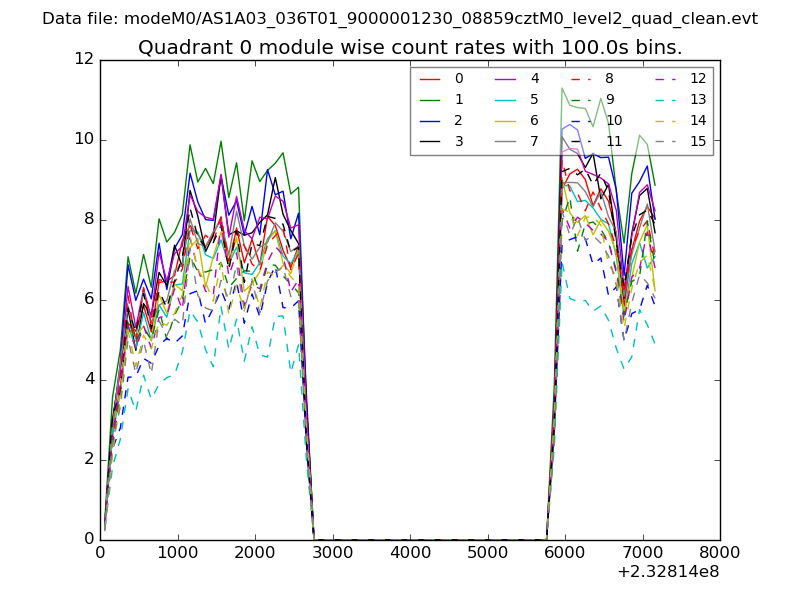 |
 |
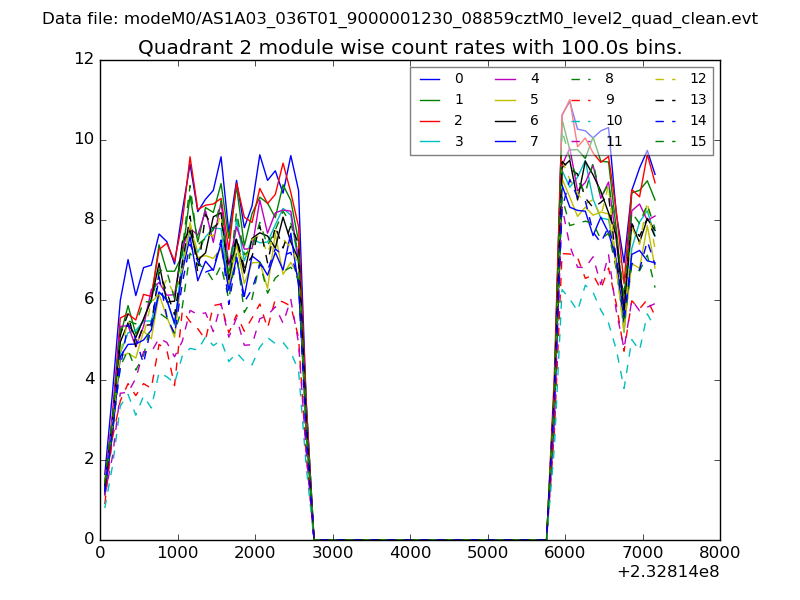
| Module-wise count rates for Quadrant B Data is divided into 100 sec bins |
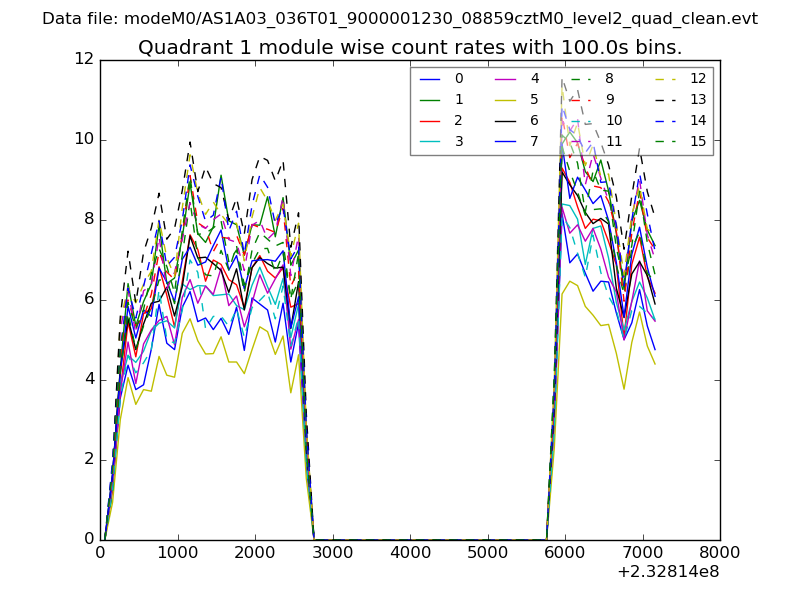 |
 |
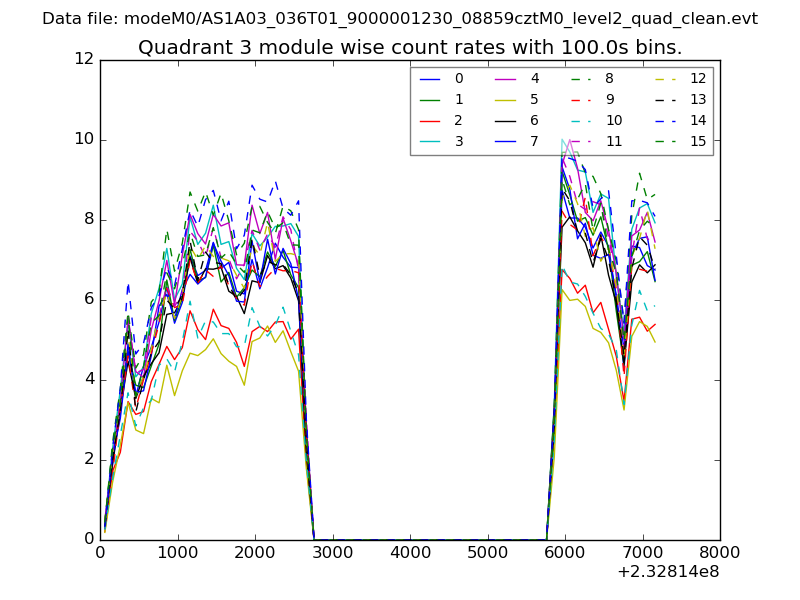
| Module-wise count rates for Quadrant C Data is divided into 100 sec bins |
 |
 |
| Module-wise count rates for Quadrant D Data is divided into 100 sec bins |
 |
 |
| Parameter | Plot |
|---|---|
| CZT HV Monitor | 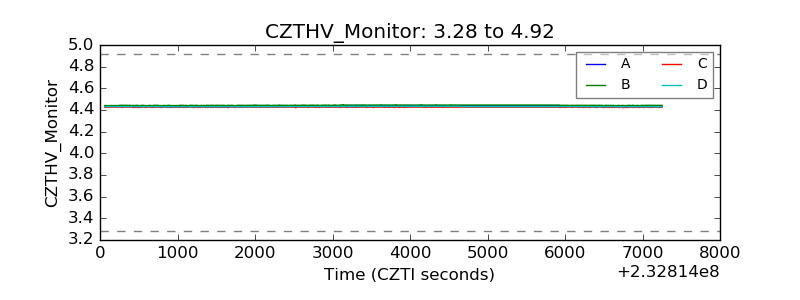 |
| D_VDD | 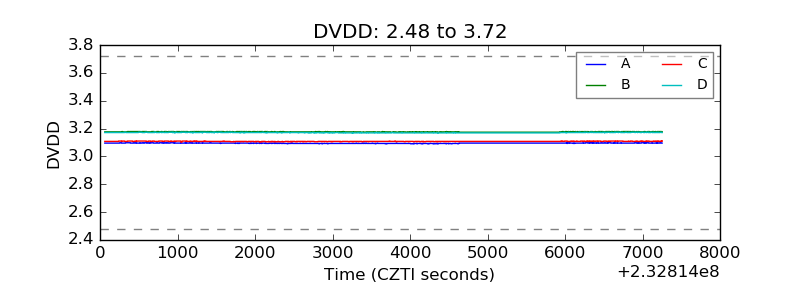 |
| Temperature 1 | 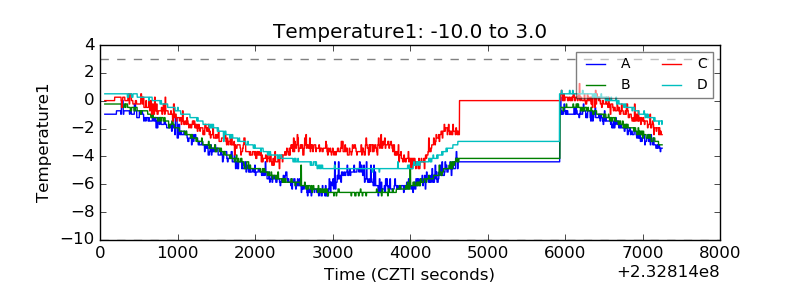 |
| Veto HV Monitor | 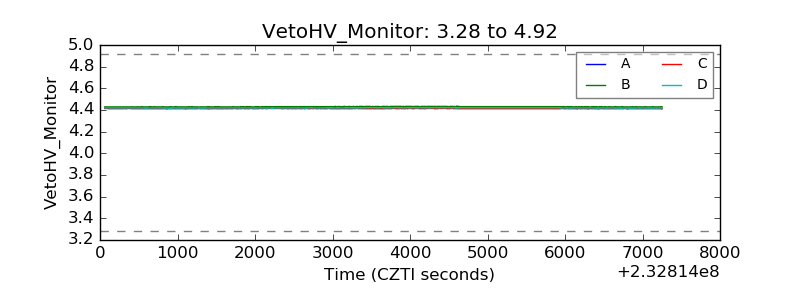 |
| Veto LLD | 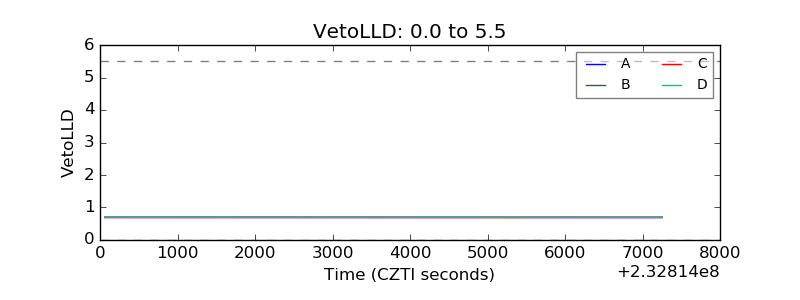 |
| Alpha Counter | 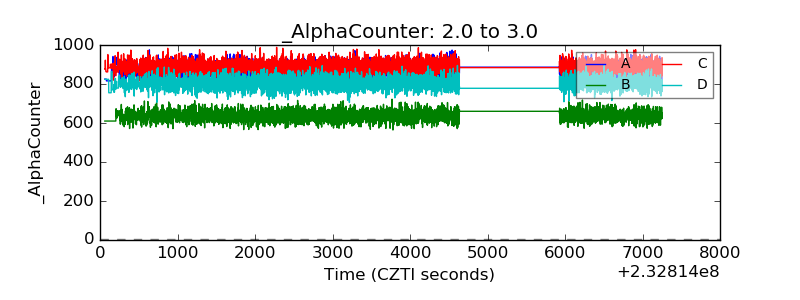 |
| _CPM_Rate | 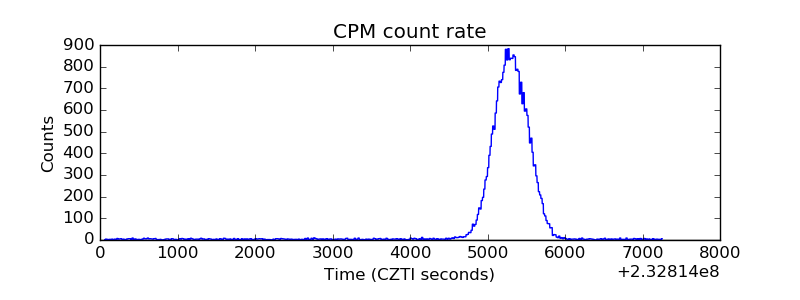 |
| CZT Counter | 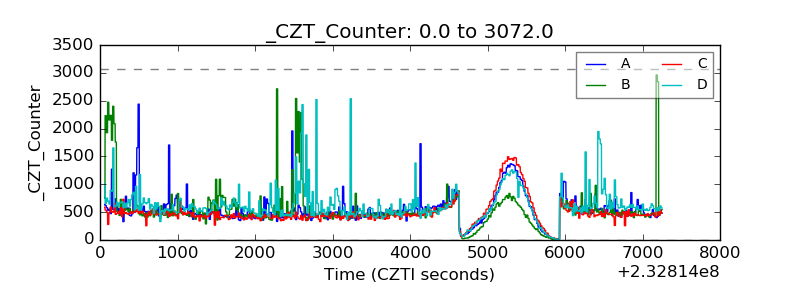 |
| +2.5 Volts monitor |  |
| +5 Volts monitor | 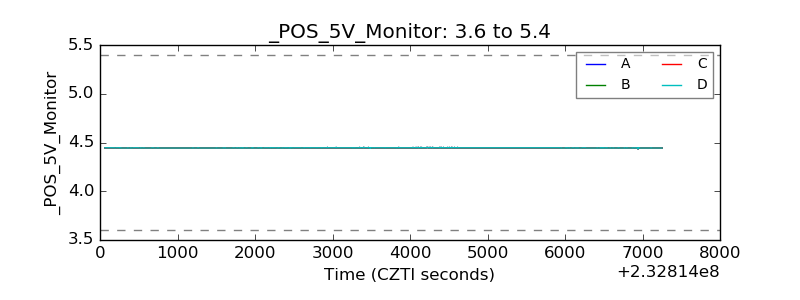 |
| _ROLL_ROT | 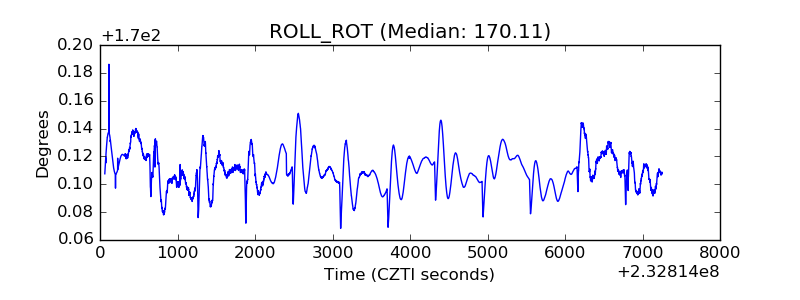 |
| _Roll_DEC | 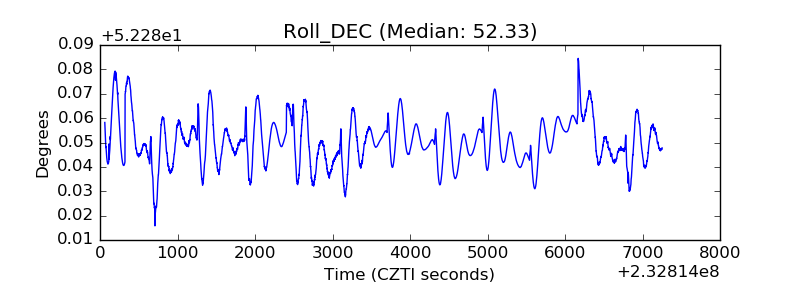 |
| _Roll_RA | 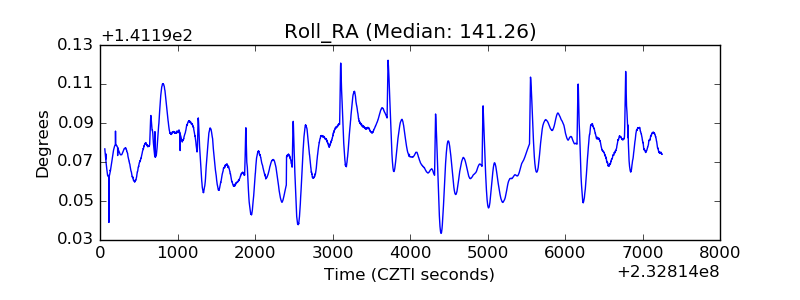 |
| Veto Counter | 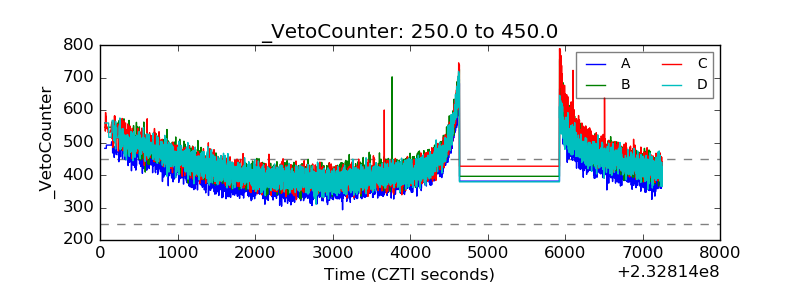 |