| Param | Original file | Final file |
|---|---|---|
| Filename | modeM0/AS1G07_028T01_9000001232cztM0_level2.fits | modeM0/AS1G07_028T01_9000001232cztM0_level2_quad_clean.evt |
| Size (bytes) | 151,110,720 | 152,472,960 |
| Size | 144.1 MB | 145.4 MB |
| Events in quadrant A | 900,176 | 912,182 |
| Events in quadrant B | 869,160 | 896,713 |
| Events in quadrant C | 895,060 | 870,814 |
| Events in quadrant D | 779,628 | 805,805 |
| Mode SS | |||
|---|---|---|---|
| Quadrant | BADHDUFLAG | Total packets | Discarded packets |
| A | 0 | 324 | 0 |
| B | 0 | 340 | 0 |
| C | 0 | 332 | 0 |
| D | 0 | 338 | 0 |
| Mode M0 | |||
|---|---|---|---|
| Quadrant | BADHDUFLAG | Total packets | Discarded packets |
| A | 0 | 38536 | 0 |
| B | 0 | 37078 | 0 |
| C | 0 | 33899 | 0 |
| D | 0 | 37438 | 0 |
| Mode M9 | |||
|---|---|---|---|
| Quadrant | BADHDUFLAG | Total packets | Discarded packets |
| A | 0 | 10 | 0 |
| B | 0 | 10 | 0 |
| C | 0 | 9 | 0 |
| D | 0 | 11 | 0 |
| Quadrant | Total seconds | Saturated seconds | Saturation percentage |
|---|---|---|---|
| A | 16389 | 300 | 1.830496% |
| B | 16388 | 349 | 2.129607% |
| C | 16409 | 120 | 0.731306% |
| D | 16425 | 289 | 1.759513% |
Noise dominated data is calculated using 1-second bins in cleaned event files. If a bin has >2000 counts, and if more than 50% of those come from <1% of pixels, then it is considered to be noise-dominated and hence unusable.
| Quadrant | # 1 sec bins | Bins with >0 counts | Bins with >2000 counts | High rate bins dominated by noise | Noise dominated (total time) | Noise dominated (detector-on time) | Marked lightcurve |
|---|---|---|---|---|---|---|---|
| A | 18429 | 17008 | 0 | 0 | 0.00% | 0.00% |  |
| B | 18427 | 16999 | 0 | 0 | 0.00% | 0.00% | 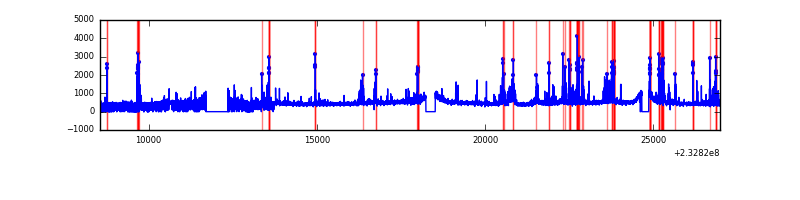 |
| C | 18428 | 16970 | 0 | 0 | 0.00% | 0.00% |  |
| D | 18429 | 16986 | 0 | 0 | 0.00% | 0.00% |  |
Top three noisy pixels from each quadrant. If the there are fewer than three noisy pixels in the level2.evt file, extra rows are filled as -1
| Pixel properties | Quadrant properties | ||||||
|---|---|---|---|---|---|---|---|
| Quadrant | DetID | PixID | Counts | Sigma | Mean | Median | Sigma |
| A | 0 | 29 | 903 | 11.18 | 233 | 217 | 61.3 |
| A | 14 | 188 | 898 | 11.1 | 233 | 217 | 61.3 |
| A | 14 | 204 | 749 | 8.67 | 233 | 217 | 61.3 |
| B | 2 | 9 | 795 | 11.75 | 229 | 217 | 49.2 |
| B | 5 | 128 | 610 | 7.99 | 229 | 217 | 49.2 |
| B | 3 | 17 | 606 | 7.9 | 229 | 217 | 49.2 |
| C | 12 | 241 | 639 | 6.57 | 236 | 218 | 64.0 |
| C | 1 | 81 | 637 | 6.54 | 236 | 218 | 64.0 |
| C | 9 | 233 | 625 | 6.35 | 236 | 218 | 64.0 |
| D | 3 | 31 | 617 | 6.77 | 221 | 200 | 61.6 |
| D | 3 | 14 | 593 | 6.38 | 221 | 200 | 61.6 |
| D | 1 | 19 | 584 | 6.23 | 221 | 200 | 61.6 |
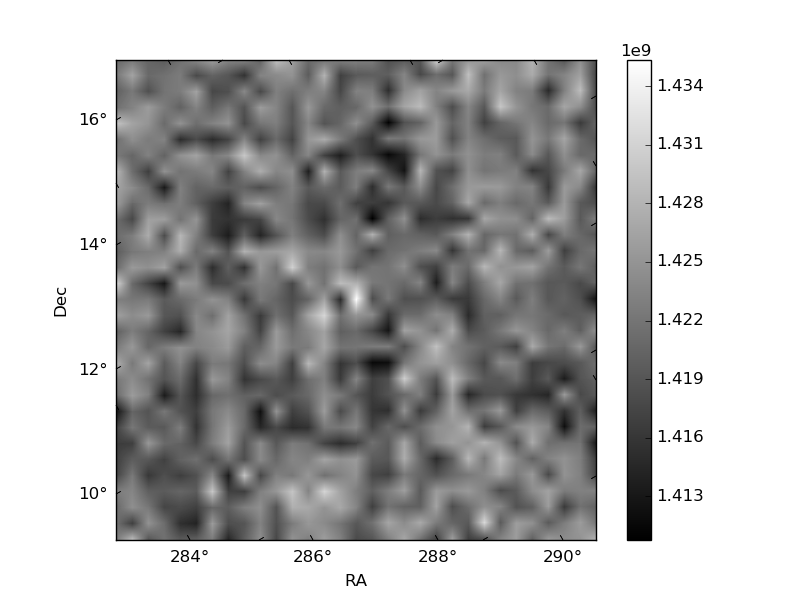
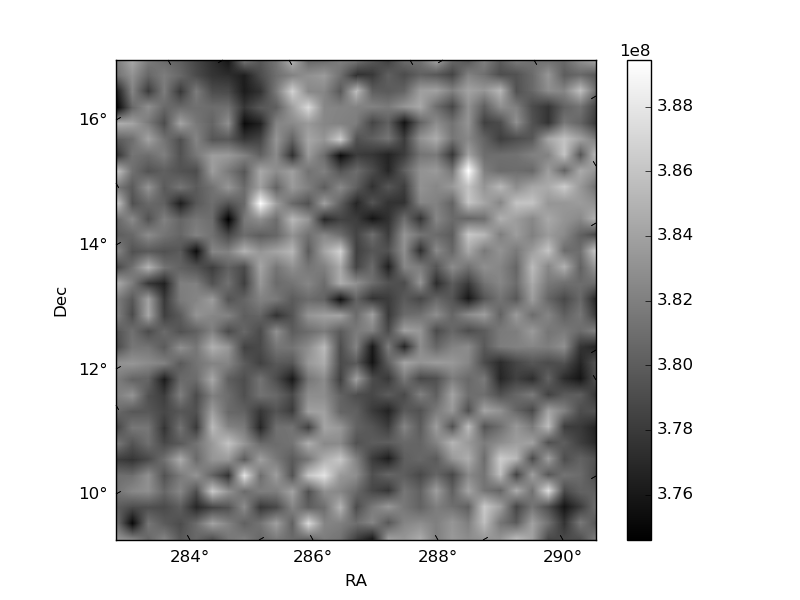
Histogram calculated using DETX and DETY for each event in the final _common_clean file
| Quadrant A |  |
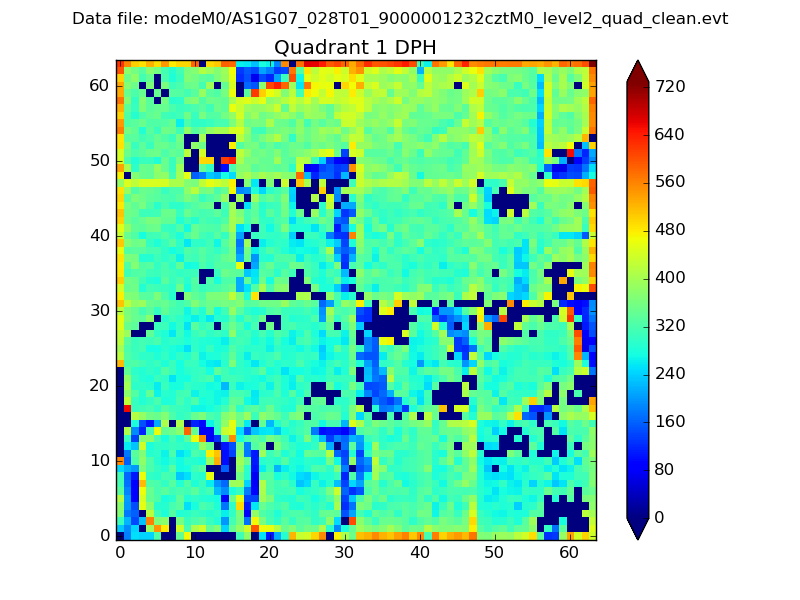 |
Quadrant B |
|---|---|---|---|
| Quadrant D | 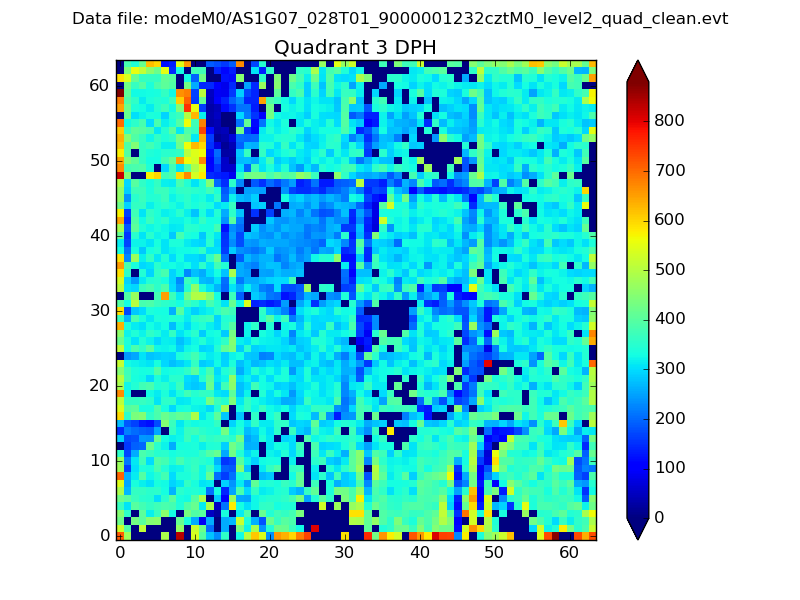 |
 |
Quadrant C |
| Plot type | Count rate plots | Images |
|---|---|---|
| Comparison with Poisson distribution Blue bars denote a histogram of data divided into 1 sec bins. Red curve is a Poisson curve with rate = median count rate of data. |
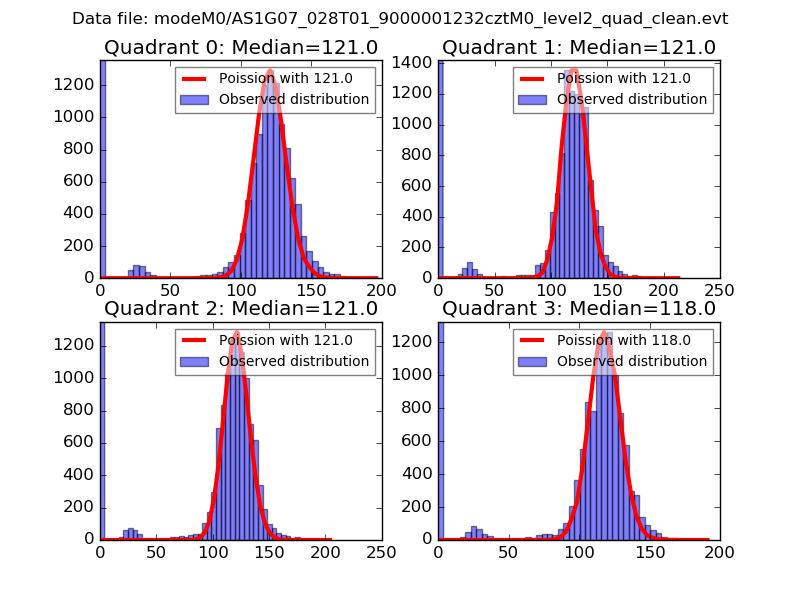 |
 |
| Quadrant-wise count rates Data is divided into 100 sec bins |
 |
|
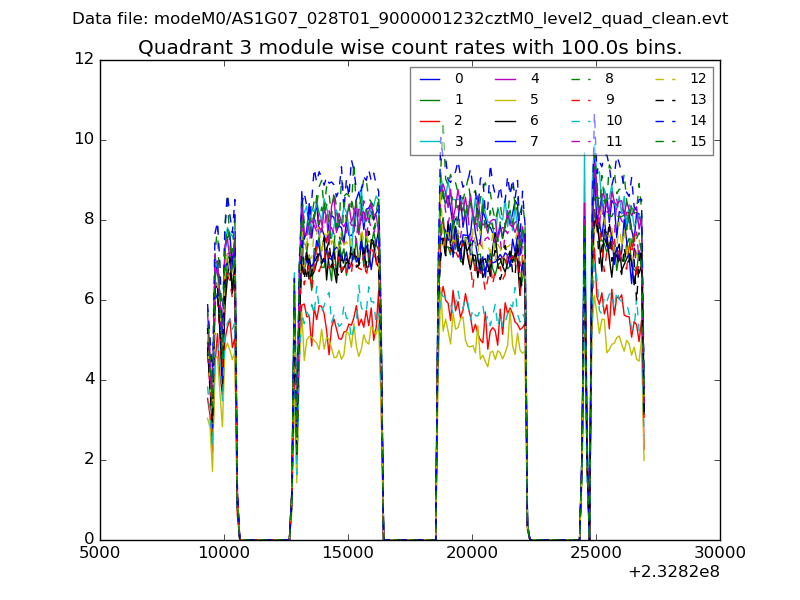
| Module-wise count rates for Quadrant A Data is divided into 100 sec bins |
 |
 |
| Module-wise count rates for Quadrant B Data is divided into 100 sec bins |
 |
 |
| Module-wise count rates for Quadrant C Data is divided into 100 sec bins |
 |
 |
| Module-wise count rates for Quadrant D Data is divided into 100 sec bins |
 |
 |
| Parameter | Plot |
|---|---|
| CZT HV Monitor |  |
| D_VDD |  |
| Temperature 1 |  |
| Veto HV Monitor | 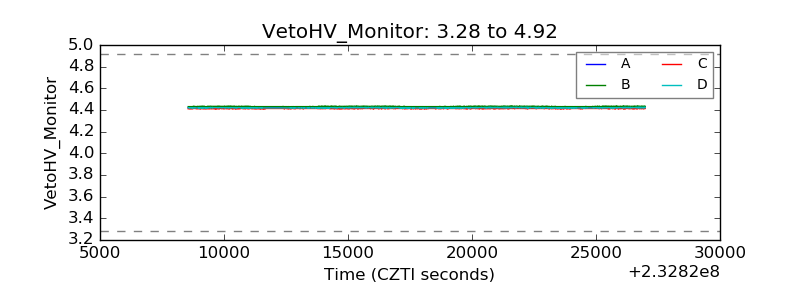 |
| Veto LLD | 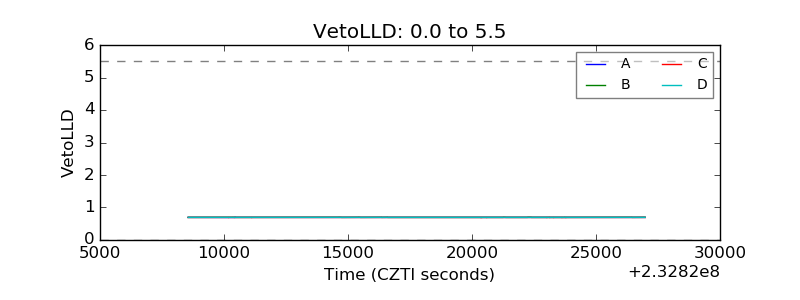 |
| Alpha Counter |  |
| _CPM_Rate |  |
| CZT Counter |  |
| +2.5 Volts monitor | 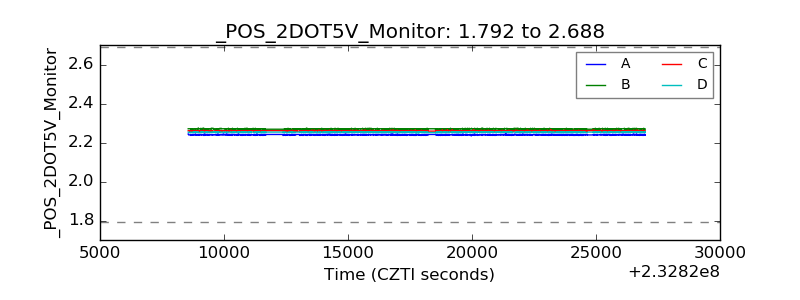 |
| +5 Volts monitor |  |
| _ROLL_ROT |  |
| _Roll_DEC |  |
| _Roll_RA |  |
| Veto Counter | 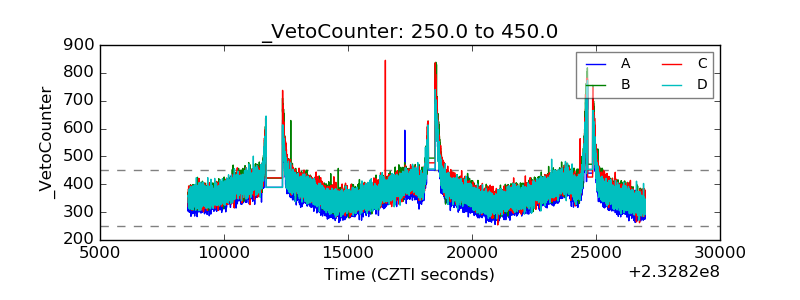 |