| Param | Original file | Final file |
|---|---|---|
| Filename | modeM0/AS1G07_028T01_9000001232_08861cztM0_level2.evt | modeM0/AS1G07_028T01_9000001232_08861cztM0_level2_quad_clean.evt |
| Size (bytes) | 263,517,120 | 47,283,840 |
| Size | 251.3 MB | 45.1 MB |
| Events in quadrant A | 1,887,196 | 294,784 |
| Events in quadrant B | 2,009,991 | 294,261 |
| Events in quadrant C | 1,784,842 | 289,863 |
| Events in quadrant D | 2,035,670 | 281,675 |
| Mode SS | |||
|---|---|---|---|
| Quadrant | BADHDUFLAG | Total packets | Discarded packets |
| A | 0 | 98 | 28 |
| B | 0 | 98 | 12 |
| C | 0 | 98 | 20 |
| D | 0 | 98 | 14 |
| Mode M0 | |||
|---|---|---|---|
| Quadrant | BADHDUFLAG | Total packets | Discarded packets |
| A | 0 | 9975 | 1914 |
| B | 0 | 10382 | 1987 |
| C | 0 | 9660 | 1790 |
| D | 0 | 10333 | 1951 |
| Mode M9 | |||
|---|---|---|---|
| Quadrant | BADHDUFLAG | Total packets | Discarded packets |
| A | 0 | 6 | 2 |
| B | 0 | 6 | 2 |
| C | 0 | 6 | 2 |
| D | 0 | 6 | 0 |
| Quadrant | Total seconds | Saturated seconds | Saturation percentage |
|---|---|---|---|
| A | 3804 | 43 | 1.130389% |
| B | 3804 | 71 | 1.866456% |
| C | 3824 | 32 | 0.836820% |
| D | 3840 | 49 | 1.276042% |
Noise dominated data is calculated using 1-second bins in cleaned event files. If a bin has >2000 counts, and if more than 50% of those come from <1% of pixels, then it is considered to be noise-dominated and hence unusable.
| Quadrant | # 1 sec bins | Bins with >0 counts | Bins with >2000 counts | High rate bins dominated by noise | Noise dominated (total time) | Noise dominated (detector-on time) | Marked lightcurve |
|---|---|---|---|---|---|---|---|
| A | 5343 | 4424 | 0 | 0 | 0.00% | 0.00% | 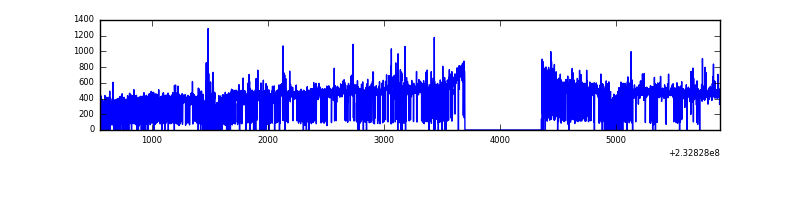 |
| B | 5341 | 4419 | 16 | 16 | 0.30% | 0.36% | 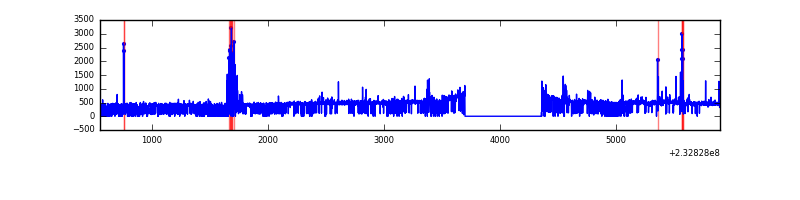 |
| C | 5342 | 4388 | 0 | 0 | 0.00% | 0.00% | 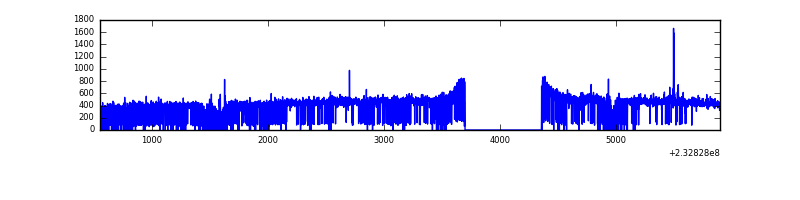 |
| D | 5343 | 4405 | 4 | 4 | 0.07% | 0.09% |  |
Top three noisy pixels from each quadrant. If the there are fewer than three noisy pixels in the level2.evt file, extra rows are filled as -1
| Pixel properties | Quadrant properties | ||||||
|---|---|---|---|---|---|---|---|
| Quadrant | DetID | PixID | Counts | Sigma | Mean | Median | Sigma |
| A | 8 | 5 | 79269 | 813.42 | 465 | 455 | 96.9 |
| A | 13 | 248 | 10435 | 103.0 | 465 | 455 | 96.9 |
| A | 3 | 1 | 4964 | 46.53 | 465 | 455 | 96.9 |
| B | 10 | 16 | 103479 | 1140.61 | 464 | 454 | 90.3 |
| B | 4 | 48 | 56678 | 622.46 | 464 | 454 | 90.3 |
| B | 0 | 214 | 12235 | 130.43 | 464 | 454 | 90.3 |
| C | 14 | 234 | 7521 | 65.8 | 452 | 454 | 107.4 |
| C | 8 | 128 | 4538 | 38.03 | 452 | 454 | 107.4 |
| C | 13 | 61 | 3417 | 27.59 | 452 | 454 | 107.4 |
| D | 8 | 195 | 169808 | 1501.3 | 455 | 440 | 112.8 |
| D | 5 | 97 | 34571 | 302.54 | 455 | 440 | 112.8 |
| D | 5 | 81 | 24004 | 208.87 | 455 | 440 | 112.8 |
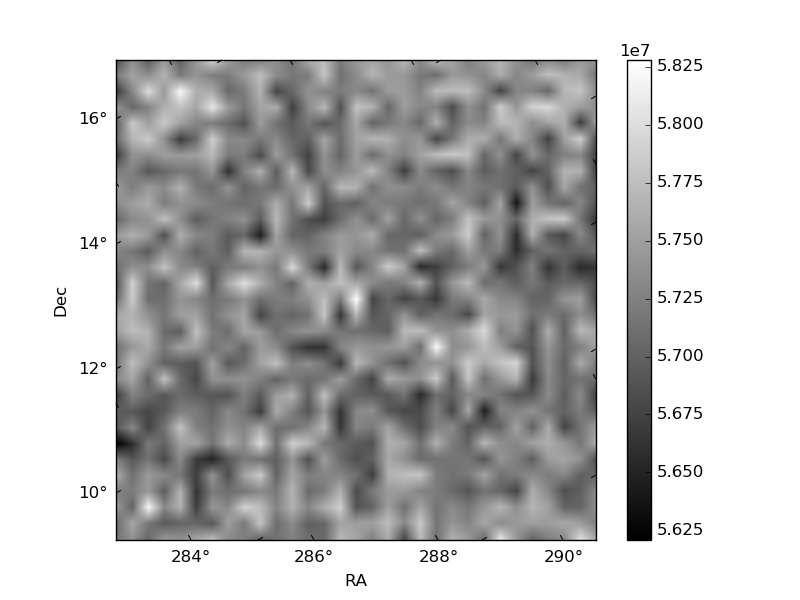
Histogram calculated using DETX and DETY for each event in the final _common_clean file
| Quadrant A |  |
 |
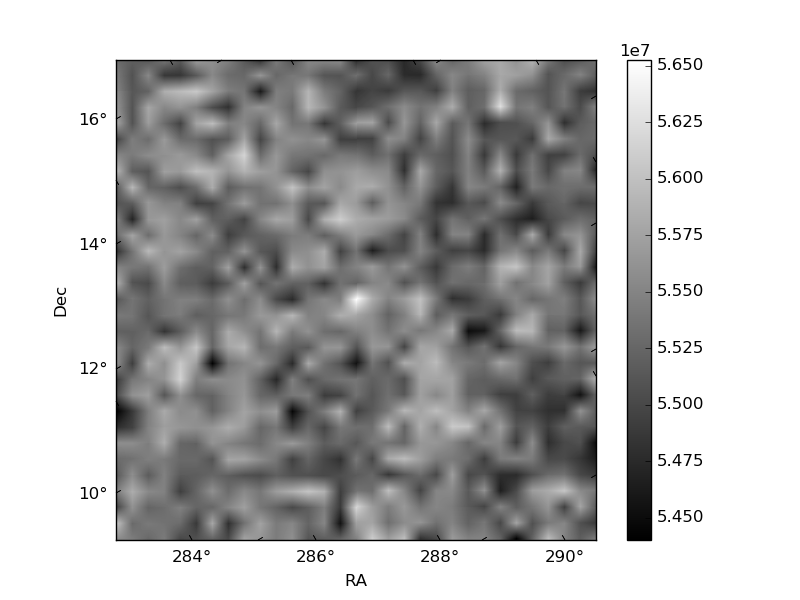
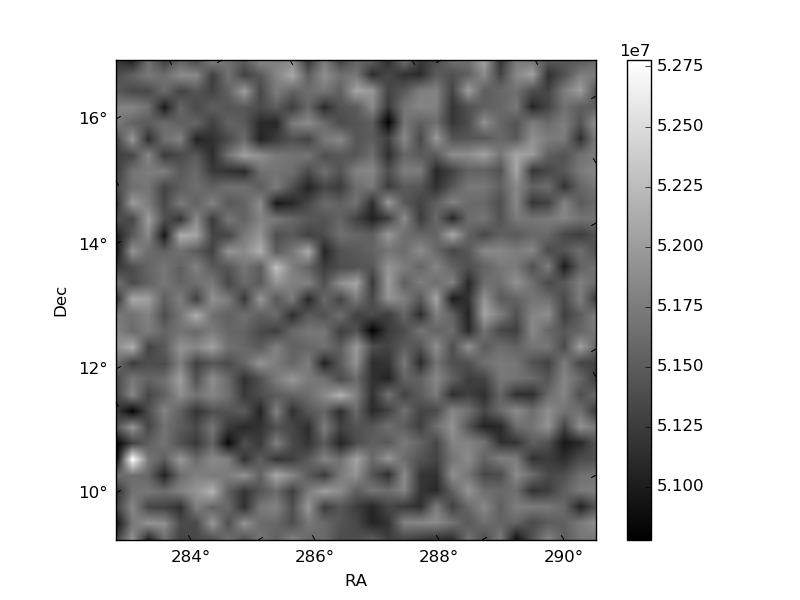
Quadrant B |
|---|---|---|---|
| Quadrant D | 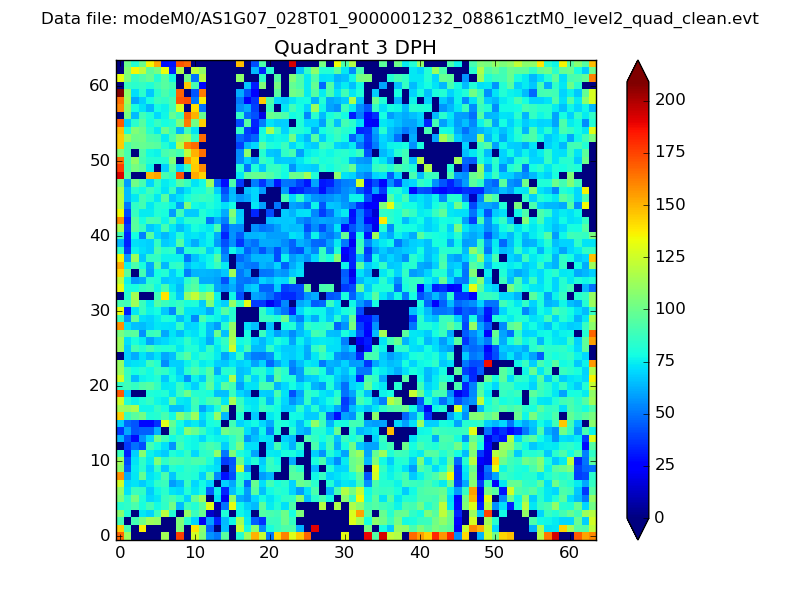 |
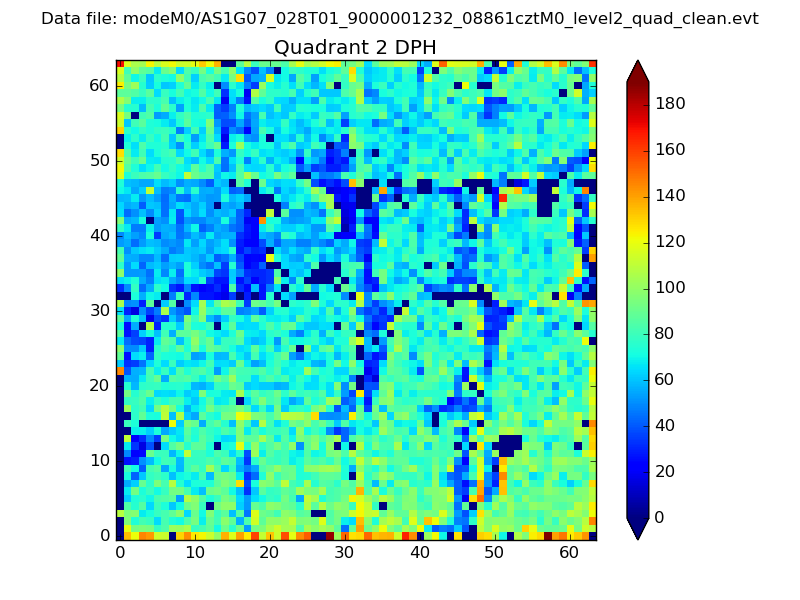 |
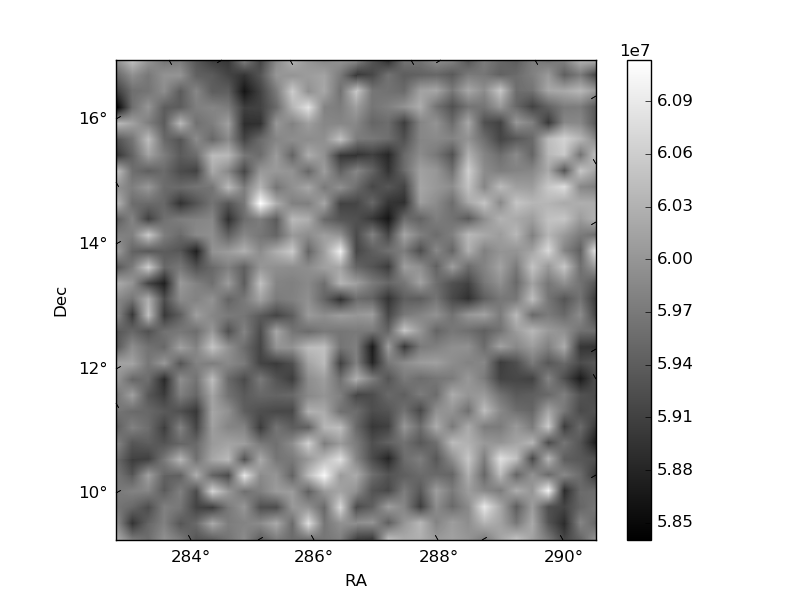
Quadrant C |
| Plot type | Count rate plots | Images |
|---|---|---|
| Comparison with Poisson distribution Blue bars denote a histogram of data divided into 1 sec bins. Red curve is a Poisson curve with rate = median count rate of data. |
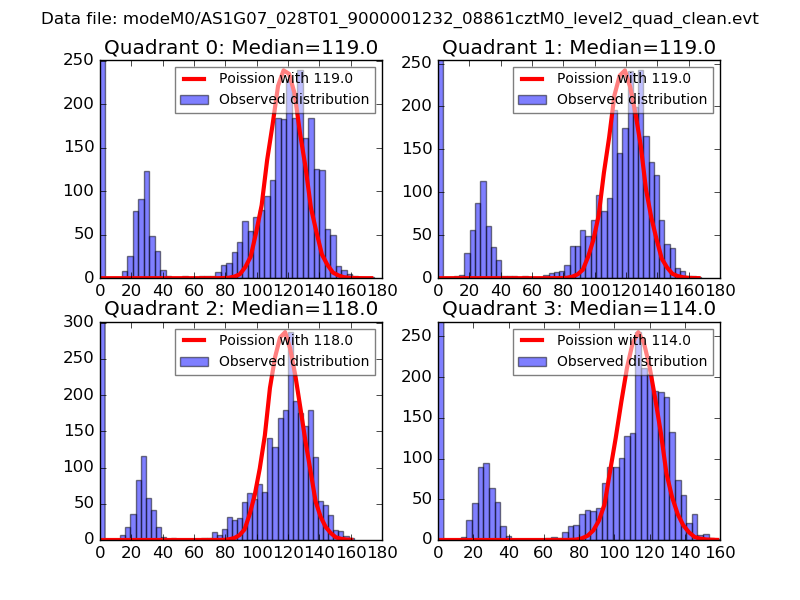 |
 |
| Quadrant-wise count rates Data is divided into 100 sec bins |
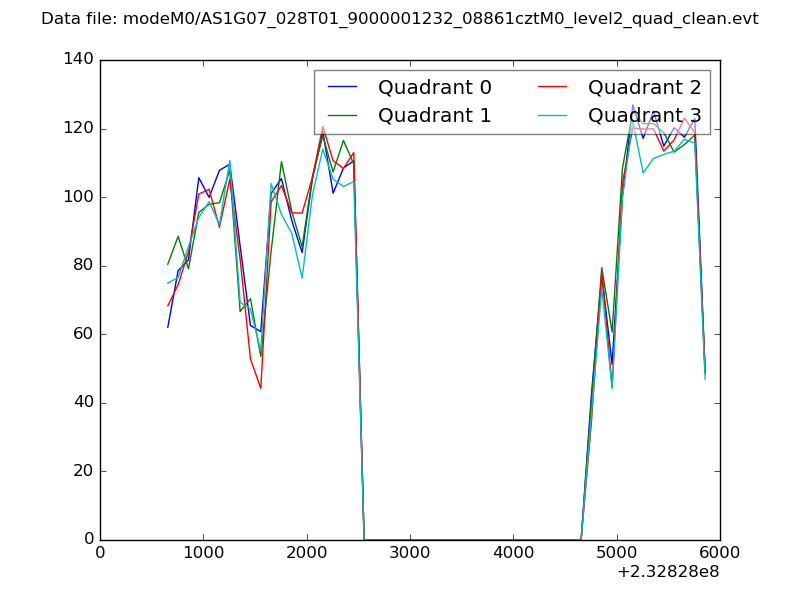 |
|
| Module-wise count rates for Quadrant A Data is divided into 100 sec bins |
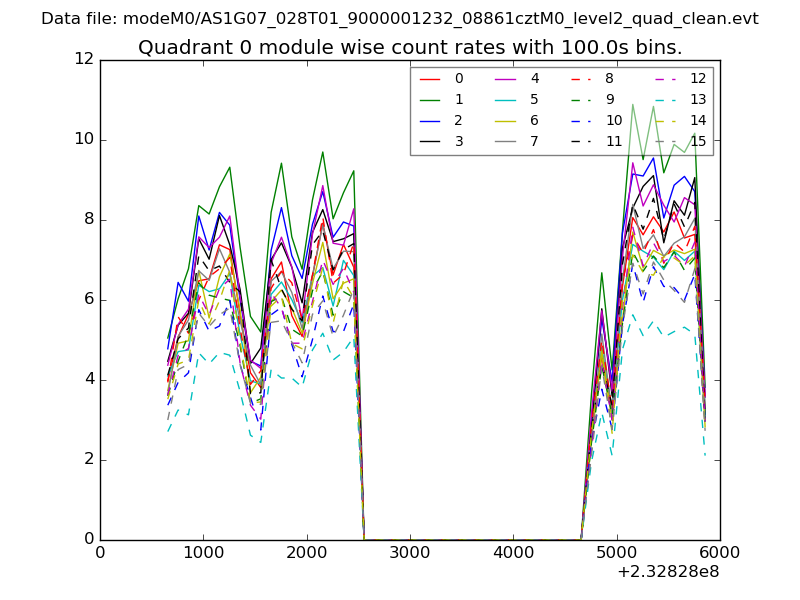 |
 |
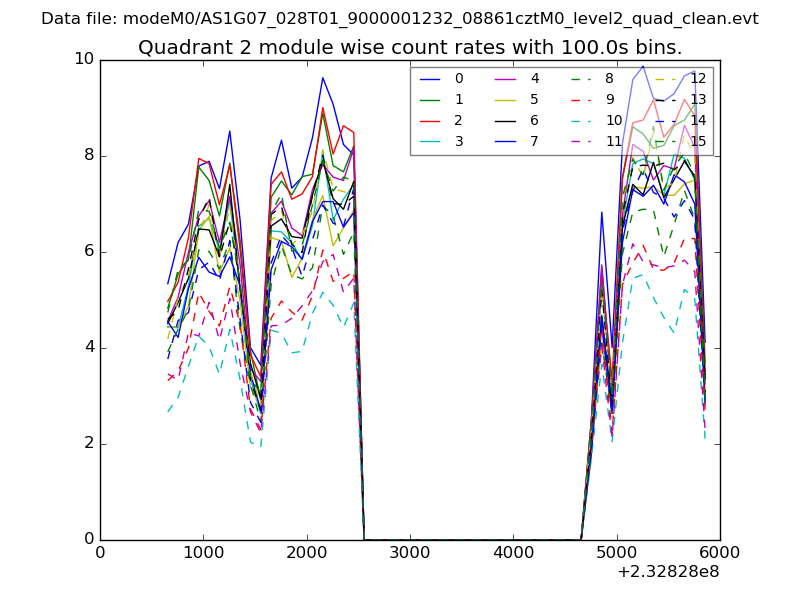
| Module-wise count rates for Quadrant B Data is divided into 100 sec bins |
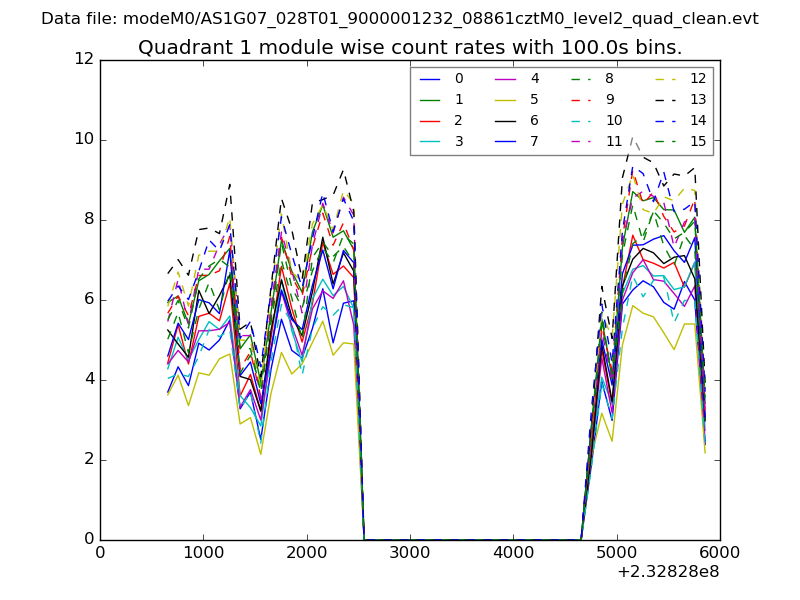 |
 |
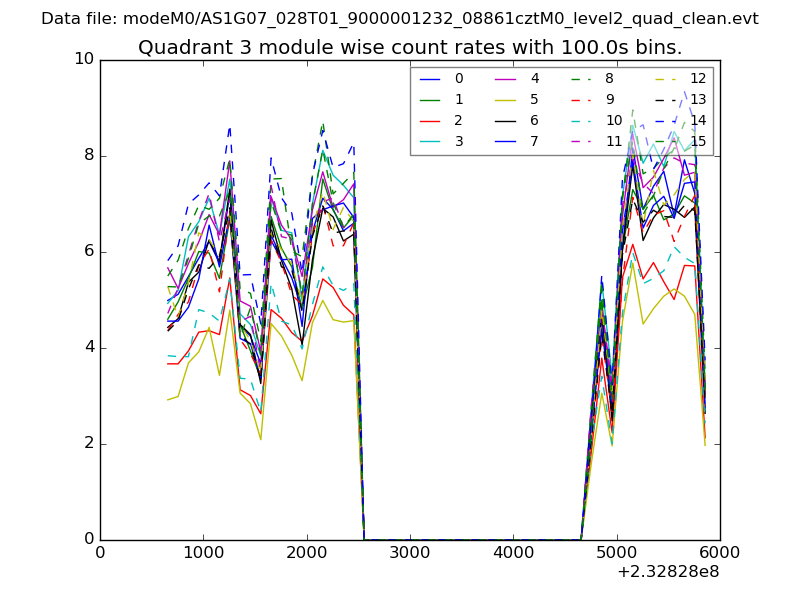
| Module-wise count rates for Quadrant C Data is divided into 100 sec bins |
 |
 |
| Module-wise count rates for Quadrant D Data is divided into 100 sec bins |
 |
 |
| Parameter | Plot |
|---|---|
| CZT HV Monitor | 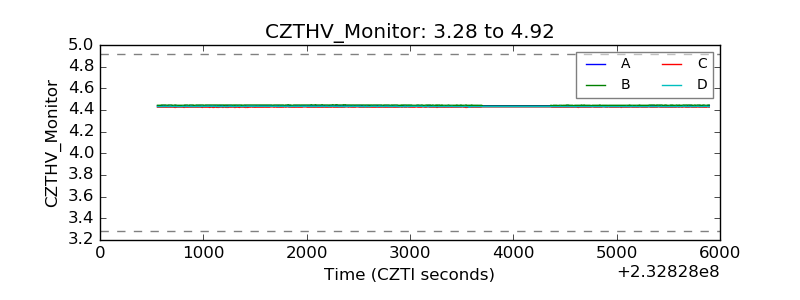 |
| D_VDD | 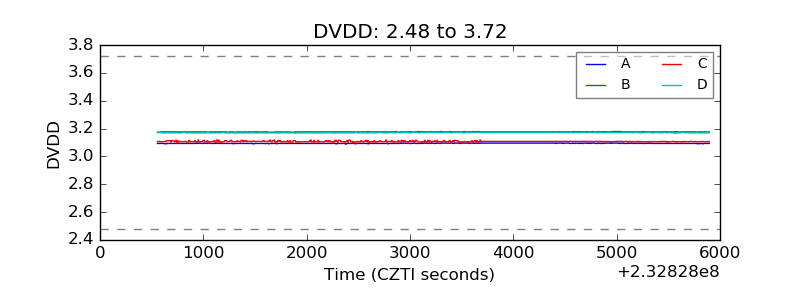 |
| Temperature 1 | 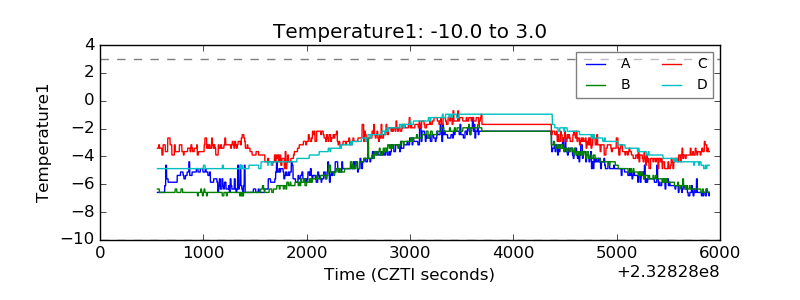 |
| Veto HV Monitor | 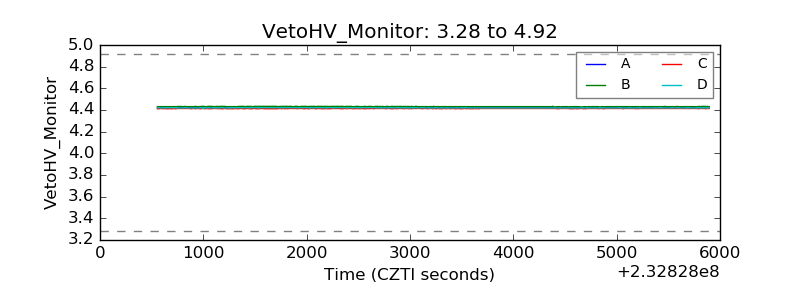 |
| Veto LLD | 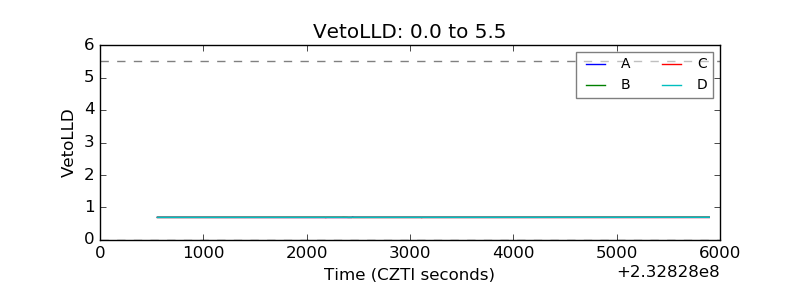 |
| Alpha Counter | 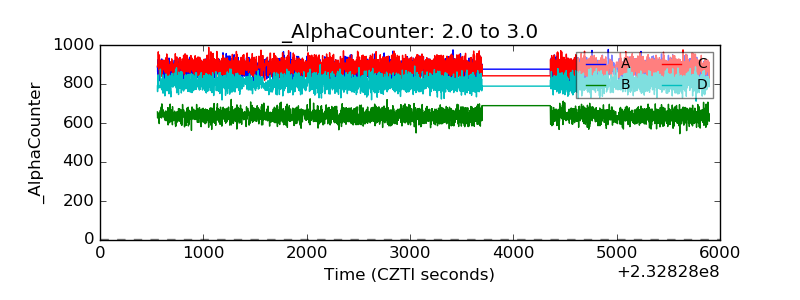 |
| _CPM_Rate | 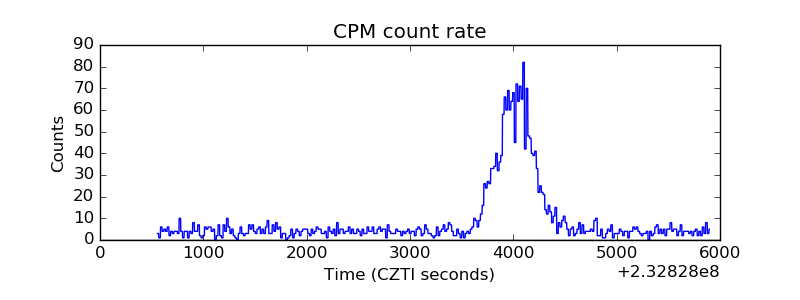 |
| CZT Counter | 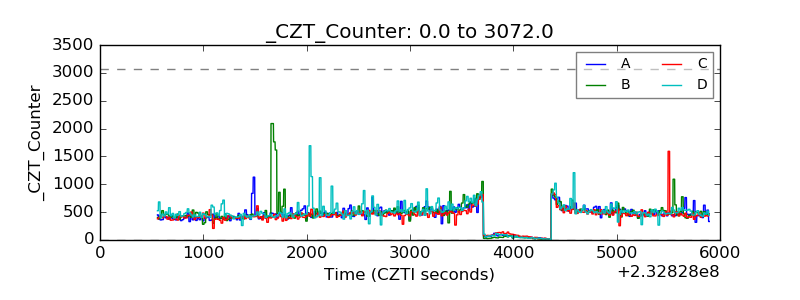 |
| +2.5 Volts monitor |  |
| +5 Volts monitor |  |
| _ROLL_ROT | 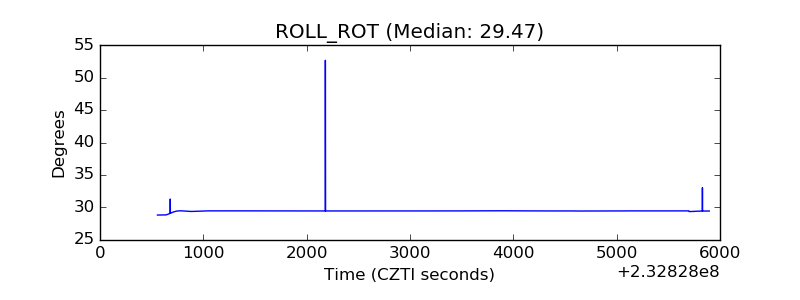 |
| _Roll_DEC | 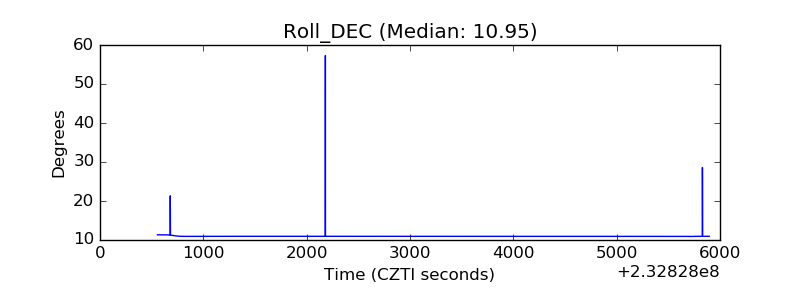 |
| _Roll_RA | 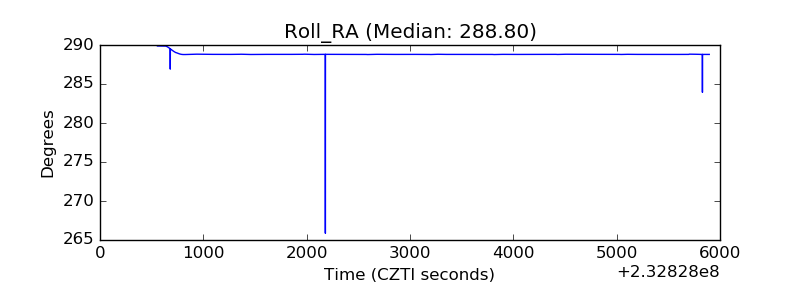 |
| Veto Counter | 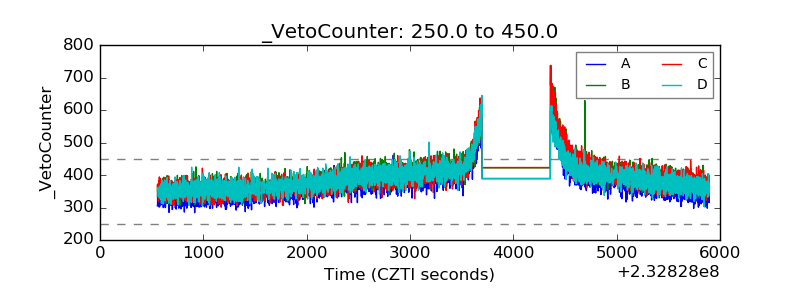 |