| Param | Original file | Final file |
|---|---|---|
| Filename | modeM0/AS1G07_028T01_9000001232_08862cztM0_level2.evt | modeM0/AS1G07_028T01_9000001232_08862cztM0_level2_quad_clean.evt |
| Size (bytes) | 525,222,720 | 95,319,360 |
| Size | 500.9 MB | 90.9 MB |
| Events in quadrant A | 4,237,068 | 600,948 |
| Events in quadrant B | 3,775,945 | 600,745 |
| Events in quadrant C | 3,409,478 | 596,688 |
| Events in quadrant D | 3,987,671 | 579,415 |
| Mode SS | |||
|---|---|---|---|
| Quadrant | BADHDUFLAG | Total packets | Discarded packets |
| A | 0 | 150 | 2 |
| B | 0 | 150 | 2 |
| C | 0 | 150 | 0 |
| D | 0 | 150 | 0 |
| Mode M0 | |||
|---|---|---|---|
| Quadrant | BADHDUFLAG | Total packets | Discarded packets |
| A | 0 | 17589 | 171 |
| B | 0 | 16126 | 146 |
| C | 0 | 15247 | 100 |
| D | 0 | 16764 | 157 |
| Mode M9 | |||
|---|---|---|---|
| Quadrant | BADHDUFLAG | Total packets | Discarded packets |
| A | 0 | 3 | 0 |
| B | 0 | 3 | 0 |
| C | 0 | 3 | 0 |
| D | 0 | 3 | 0 |
| Quadrant | Total seconds | Saturated seconds | Saturation percentage |
|---|---|---|---|
| A | 7304 | 146 | 1.998905% |
| B | 7302 | 111 | 1.520131% |
| C | 7320 | 46 | 0.628415% |
| D | 7303 | 91 | 1.246063% |
Noise dominated data is calculated using 1-second bins in cleaned event files. If a bin has >2000 counts, and if more than 50% of those come from <1% of pixels, then it is considered to be noise-dominated and hence unusable.
| Quadrant | # 1 sec bins | Bins with >0 counts | Bins with >2000 counts | High rate bins dominated by noise | Noise dominated (total time) | Noise dominated (detector-on time) | Marked lightcurve |
|---|---|---|---|---|---|---|---|
| A | 7649 | 7369 | 12 | 12 | 0.16% | 0.16% | 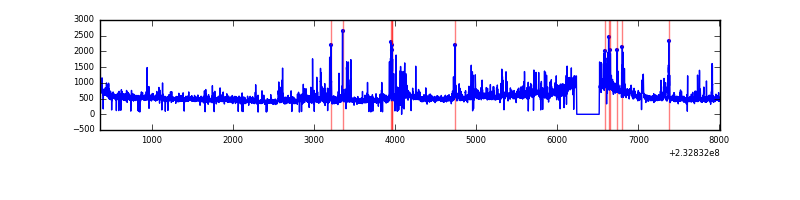 |
| B | 7649 | 7369 | 19 | 19 | 0.25% | 0.26% | 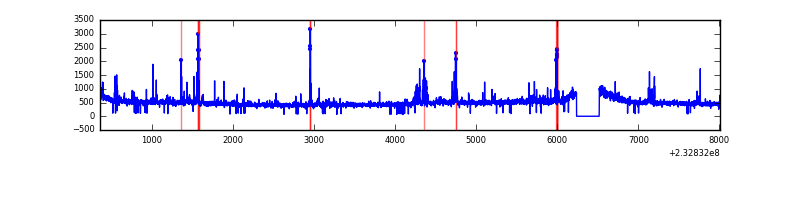 |
| C | 7649 | 7366 | 0 | 0 | 0.00% | 0.00% | 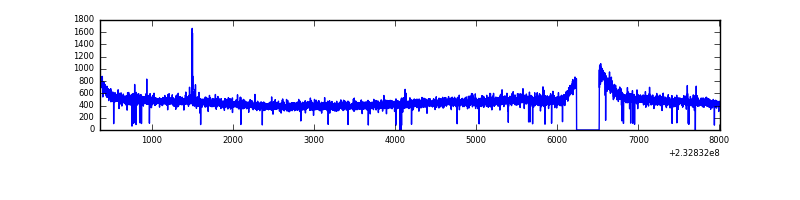 |
| D | 7650 | 7366 | 12 | 12 | 0.16% | 0.16% | 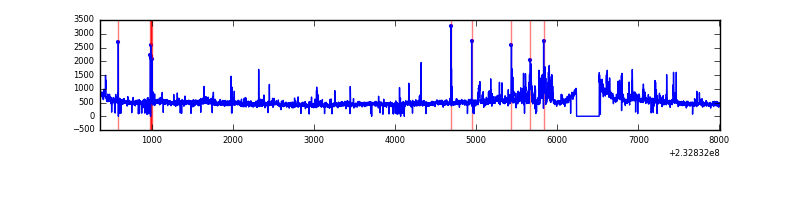 |
Top three noisy pixels from each quadrant. If the there are fewer than three noisy pixels in the level2.evt file, extra rows are filled as -1
| Pixel properties | Quadrant properties | ||||||
|---|---|---|---|---|---|---|---|
| Quadrant | DetID | PixID | Counts | Sigma | Mean | Median | Sigma |
| A | 8 | 5 | 774560 | 4262.36 | 886 | 865 | 181.5 |
| A | 15 | 174 | 17968 | 94.22 | 886 | 865 | 181.5 |
| A | 3 | 1 | 11842 | 60.47 | 886 | 865 | 181.5 |
| B | 4 | 48 | 182950 | 1056.19 | 893 | 869 | 172.4 |
| B | 0 | 214 | 51064 | 291.16 | 893 | 869 | 172.4 |
| B | 10 | 16 | 34380 | 194.39 | 893 | 869 | 172.4 |
| C | 14 | 234 | 9020 | 40.21 | 868 | 872 | 202.6 |
| C | 13 | 61 | 6527 | 27.91 | 868 | 872 | 202.6 |
| C | 12 | 4 | 4767 | 19.22 | 868 | 872 | 202.6 |
| D | 8 | 195 | 265600 | 1143.48 | 858 | 836 | 231.5 |
| D | 13 | 105 | 258005 | 1110.68 | 858 | 836 | 231.5 |
| D | 2 | 14 | 86384 | 369.47 | 858 | 836 | 231.5 |
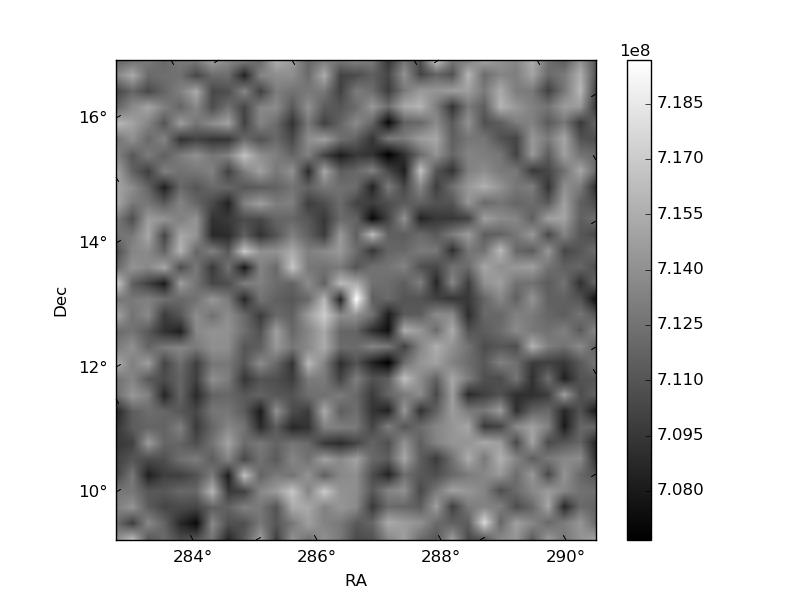
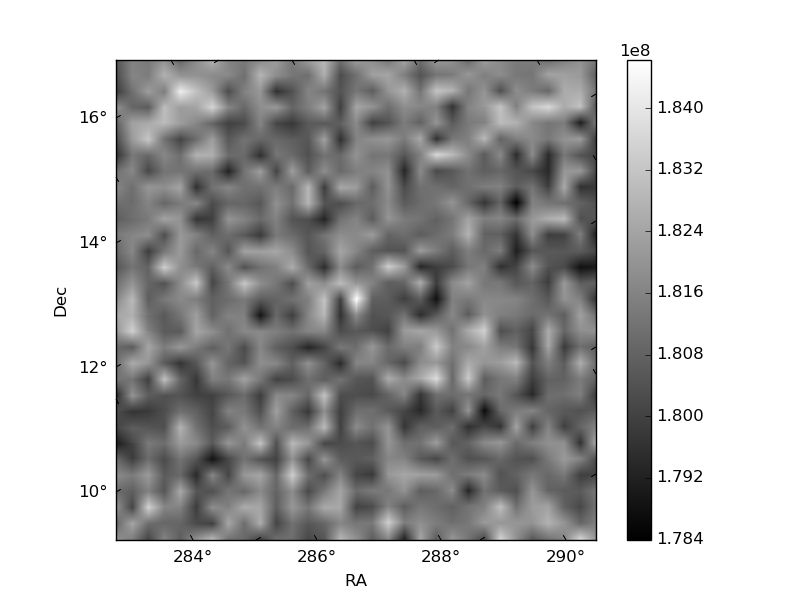
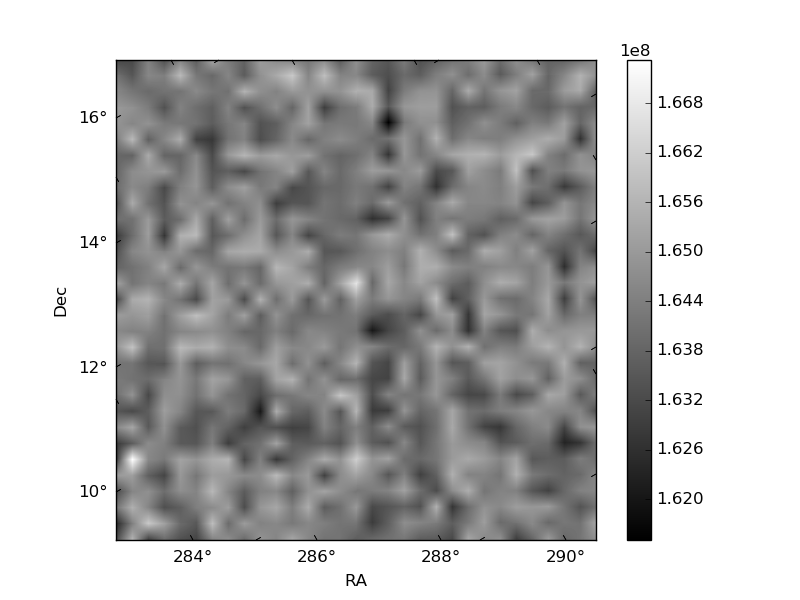
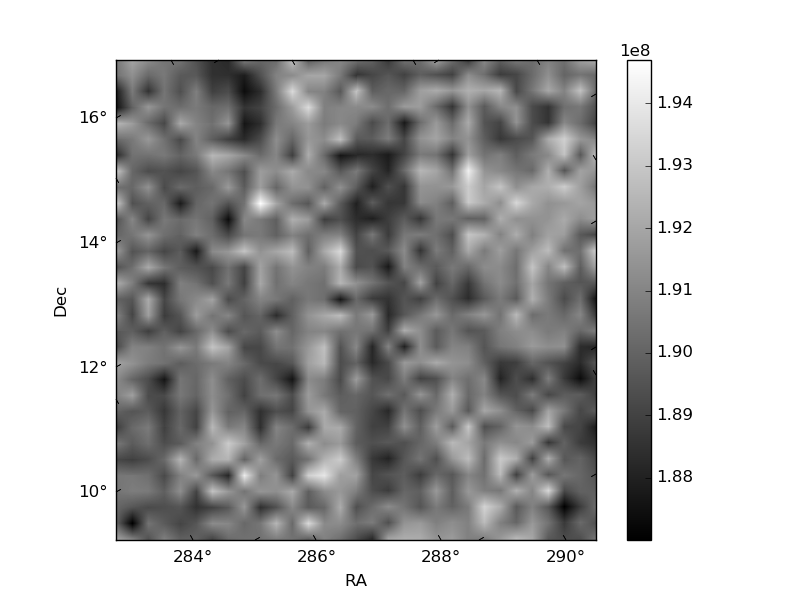
Histogram calculated using DETX and DETY for each event in the final _common_clean file
| Quadrant A | 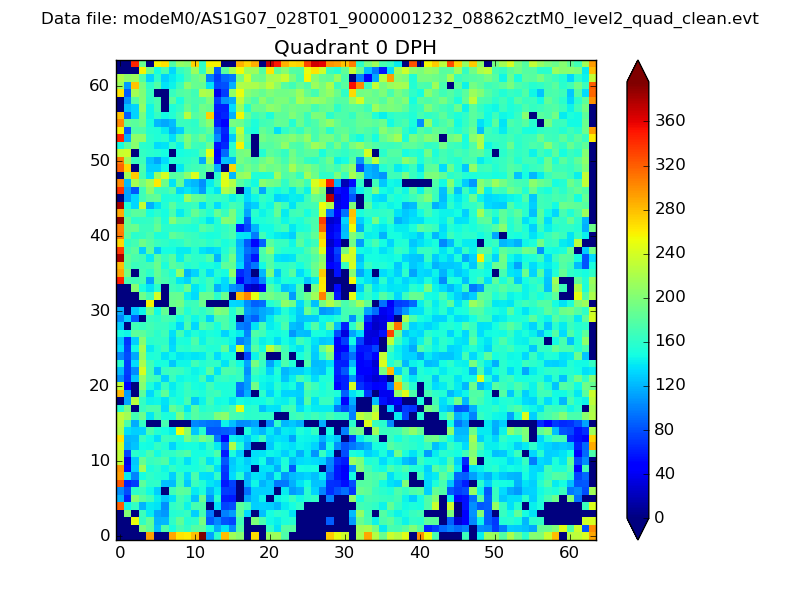 |
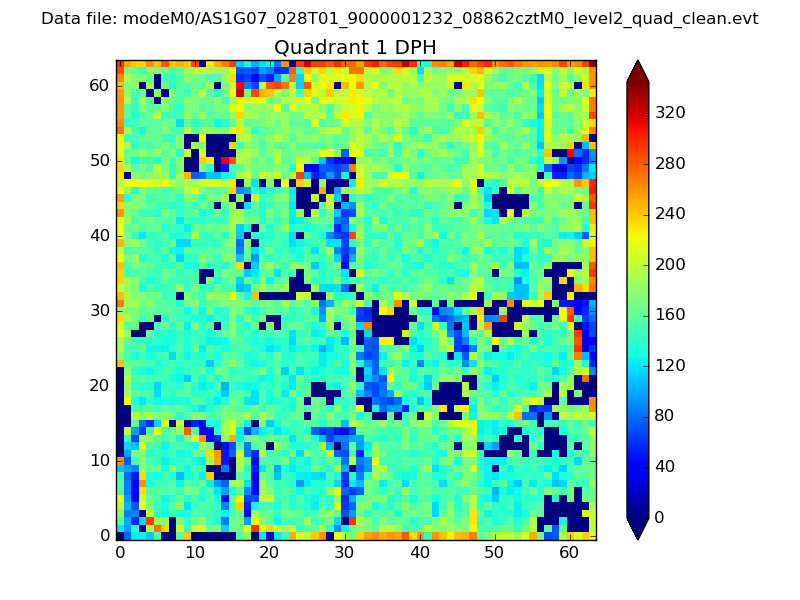 |
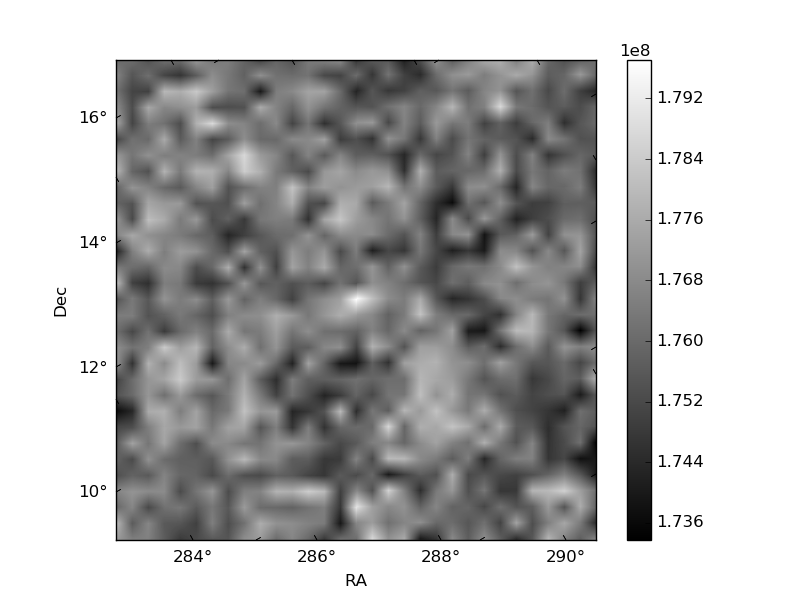
Quadrant B |
|---|---|---|---|
| Quadrant D | 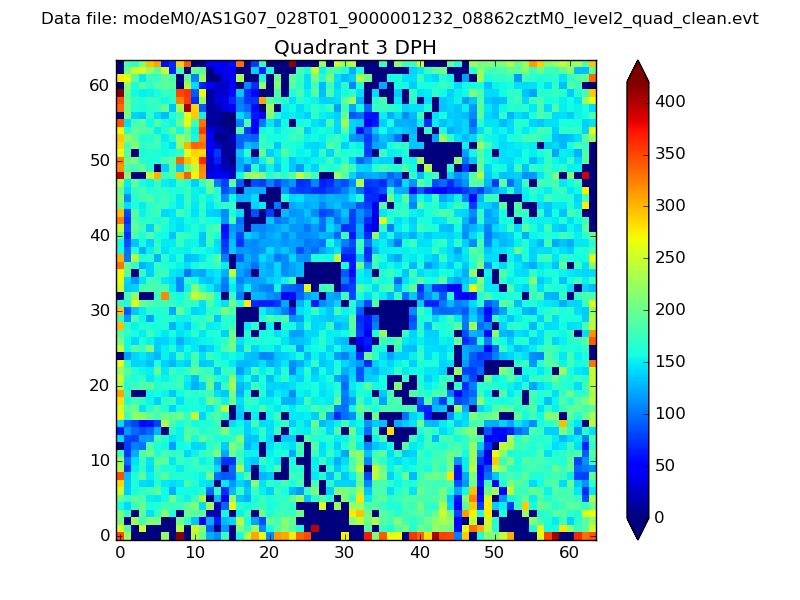 |
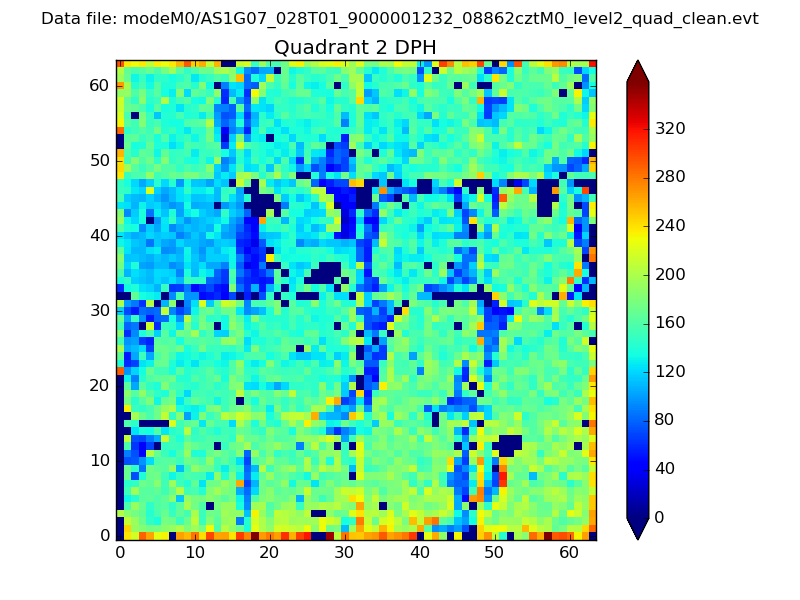 |
Quadrant C |
| Plot type | Count rate plots | Images |
|---|---|---|
| Comparison with Poisson distribution Blue bars denote a histogram of data divided into 1 sec bins. Red curve is a Poisson curve with rate = median count rate of data. |
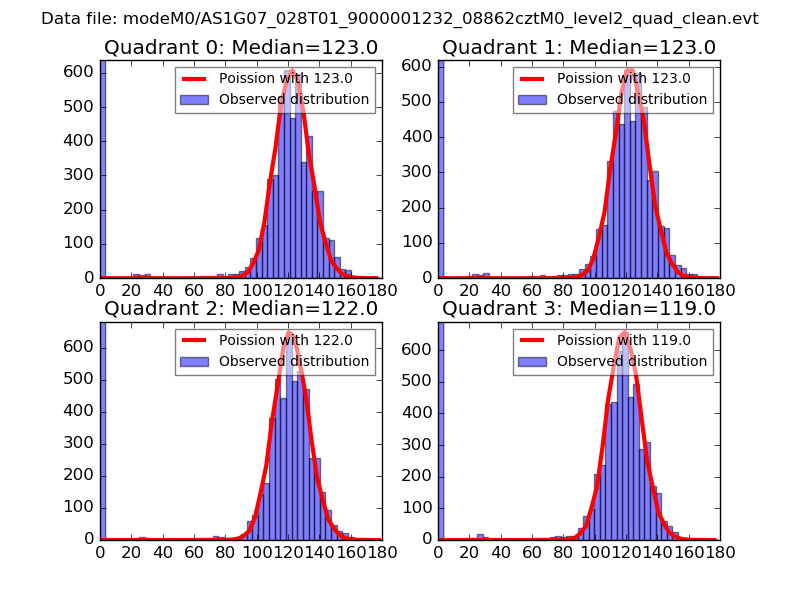 |
 |
| Quadrant-wise count rates Data is divided into 100 sec bins |
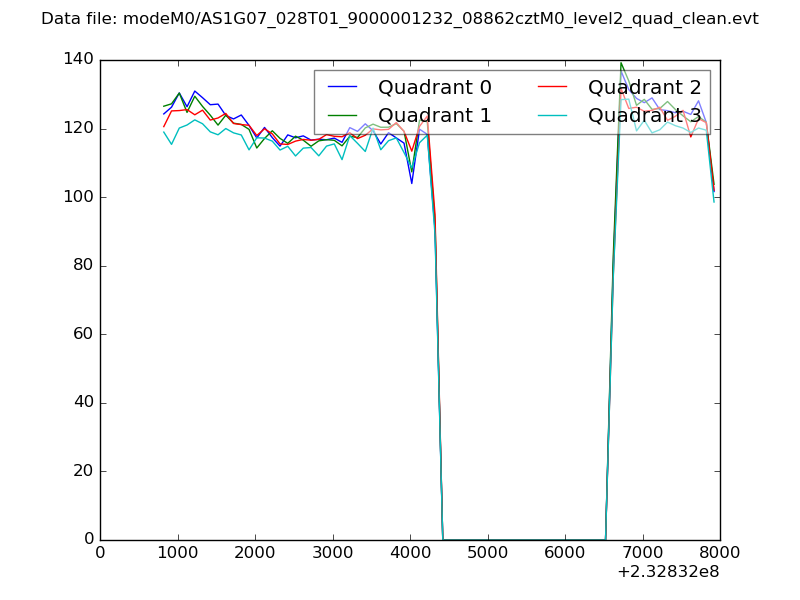 |
|
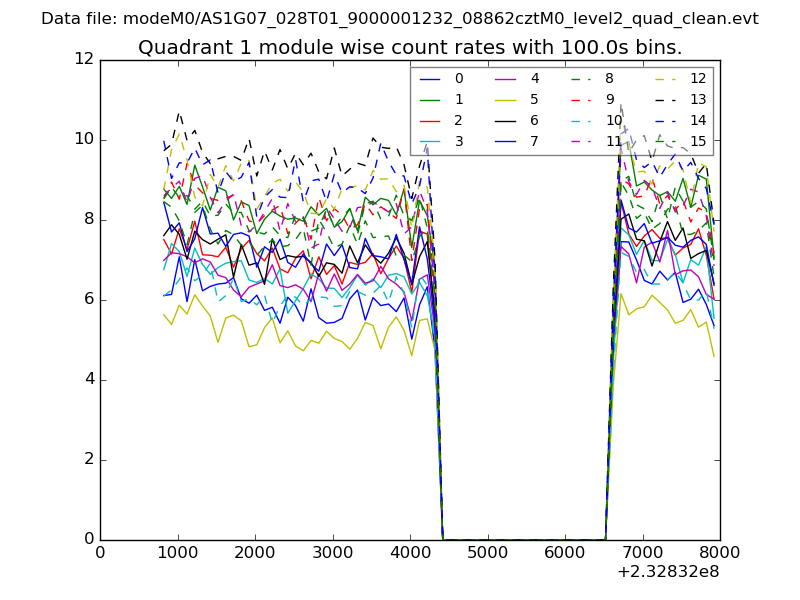
| Module-wise count rates for Quadrant A Data is divided into 100 sec bins |
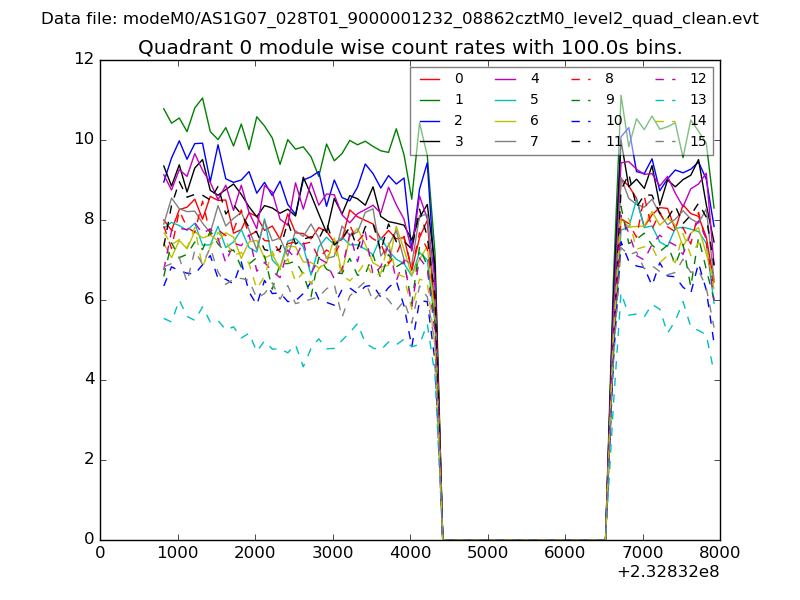 |
 |
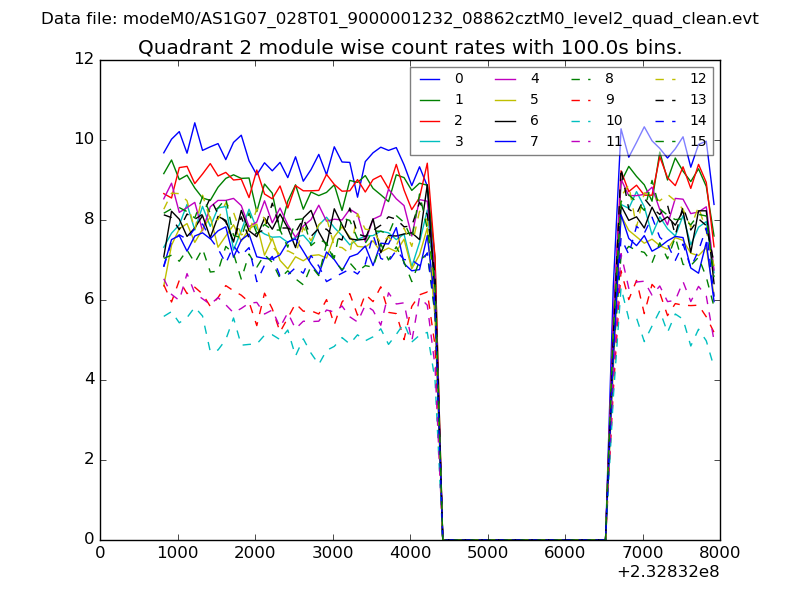
| Module-wise count rates for Quadrant B Data is divided into 100 sec bins |
 |
 |
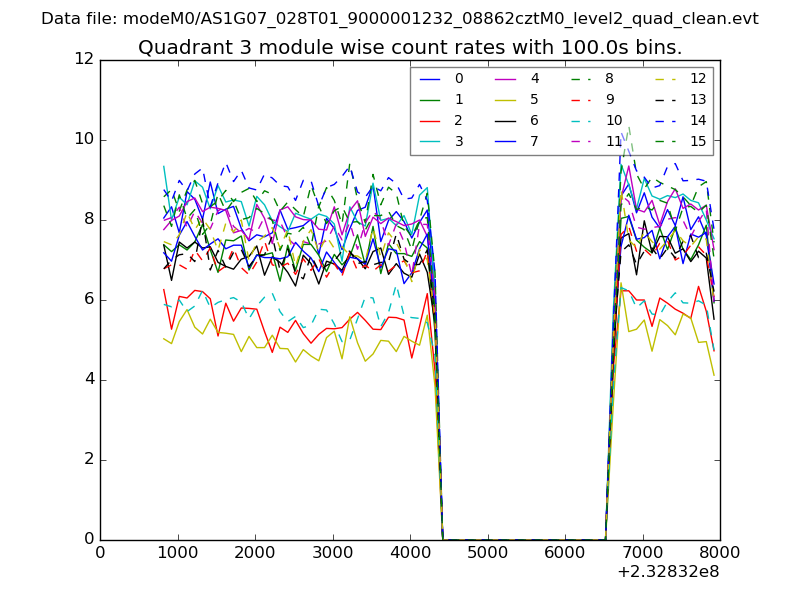
| Module-wise count rates for Quadrant C Data is divided into 100 sec bins |
 |
 |
| Module-wise count rates for Quadrant D Data is divided into 100 sec bins |
 |
 |
| Parameter | Plot |
|---|---|
| CZT HV Monitor | 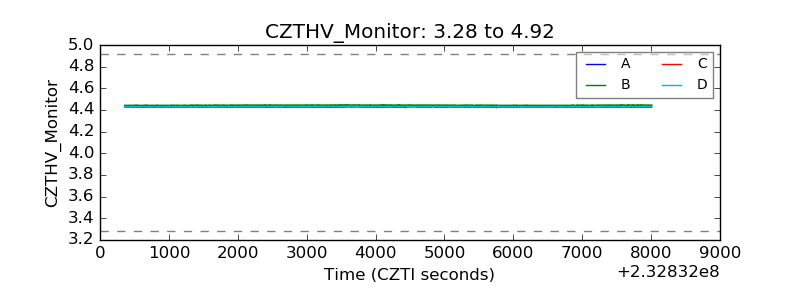 |
| D_VDD | 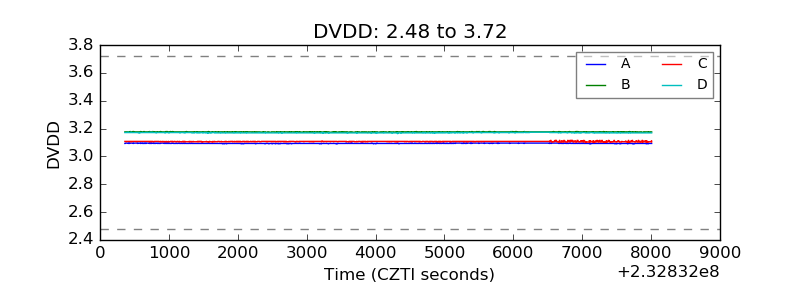 |
| Temperature 1 | 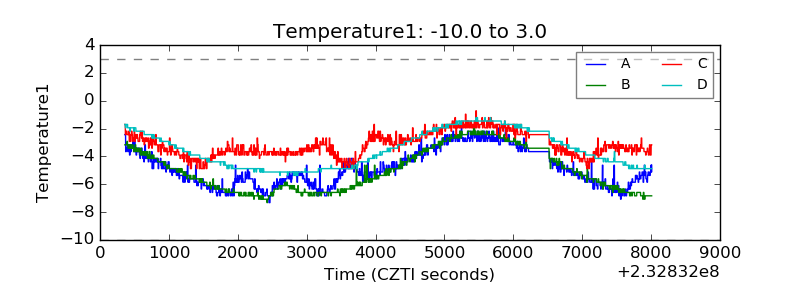 |
| Veto HV Monitor | 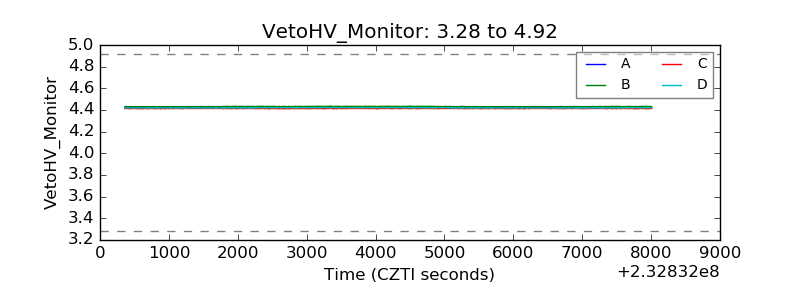 |
| Veto LLD | 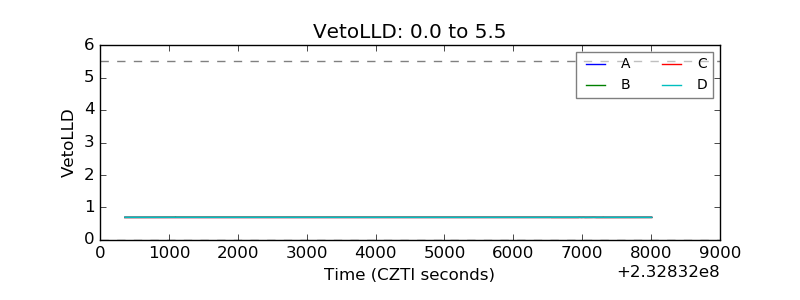 |
| Alpha Counter | 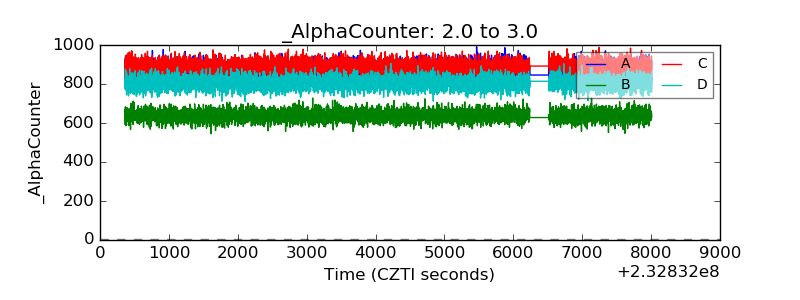 |
| _CPM_Rate | 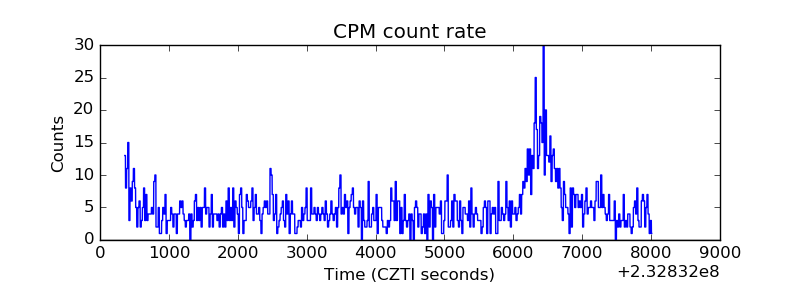 |
| CZT Counter | 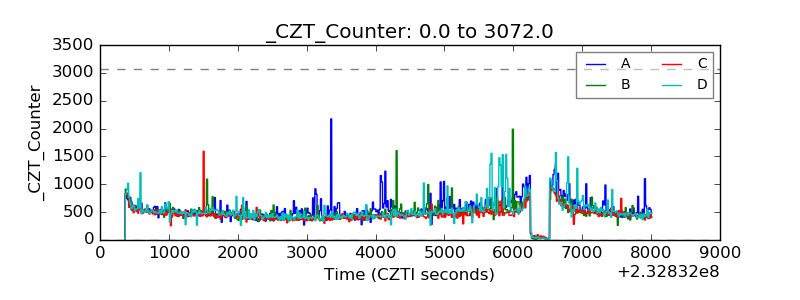 |
| +2.5 Volts monitor |  |
| +5 Volts monitor | 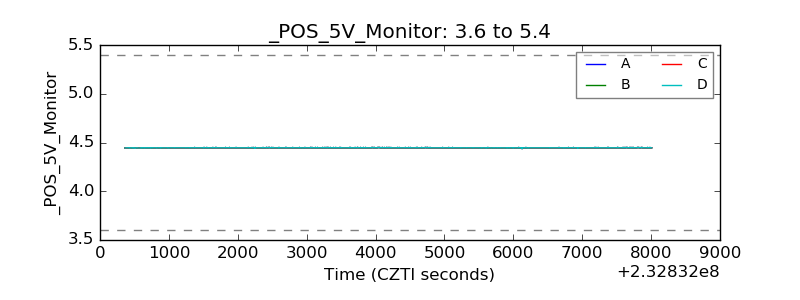 |
| _ROLL_ROT | 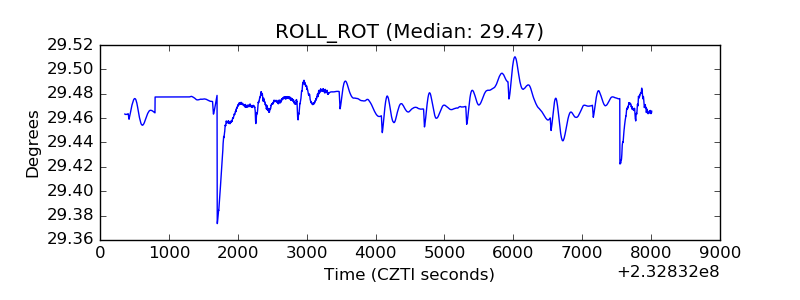 |
| _Roll_DEC | 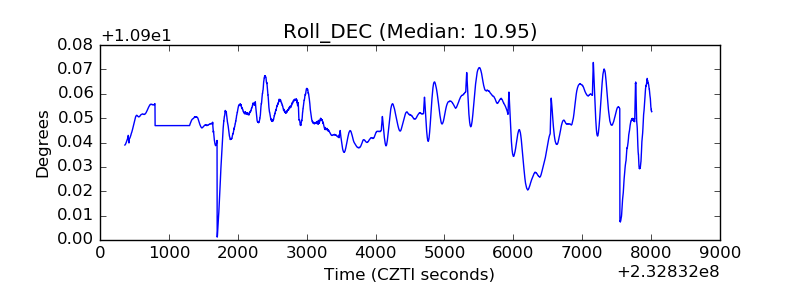 |
| _Roll_RA | 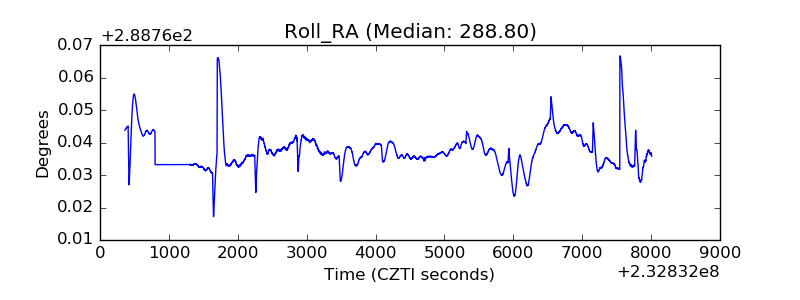 |
| Veto Counter | 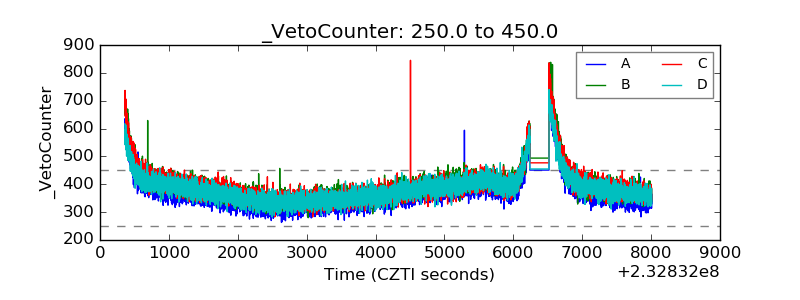 |