| Param | Original file | Final file |
|---|---|---|
| Filename | modeM0/AS1G07_028T01_9000001232_08867cztM0_level2.evt | modeM0/AS1G07_028T01_9000001232_08867cztM0_level2_quad_clean.evt |
| Size (bytes) | 1,238,523,840 | 220,489,920 |
| Size | 1.2 GB | 210.3 MB |
| Events in quadrant A | 9,723,020 | 1,390,340 |
| Events in quadrant B | 9,289,298 | 1,380,061 |
| Events in quadrant C | 7,938,520 | 1,377,365 |
| Events in quadrant D | 9,390,784 | 1,339,708 |
| Mode SS | |||
|---|---|---|---|
| Quadrant | BADHDUFLAG | Total packets | Discarded packets |
| A | 0 | 352 | 0 |
| B | 0 | 352 | 0 |
| C | 0 | 352 | 0 |
| D | 0 | 352 | 0 |
| Mode M0 | |||
|---|---|---|---|
| Quadrant | BADHDUFLAG | Total packets | Discarded packets |
| A | 0 | 40451 | 3 |
| B | 0 | 39069 | 3 |
| C | 0 | 35691 | 3 |
| D | 0 | 39391 | 3 |
| Mode M9 | |||
|---|---|---|---|
| Quadrant | BADHDUFLAG | Total packets | Discarded packets |
| A | 0 | 11 | 0 |
| B | 0 | 11 | 0 |
| C | 0 | 11 | 0 |
| D | 0 | 11 | 0 |
| Quadrant | Total seconds | Saturated seconds | Saturation percentage |
|---|---|---|---|
| A | 17268 | 307 | 1.777855% |
| B | 17268 | 364 | 2.107945% |
| C | 17268 | 129 | 0.747047% |
| D | 17268 | 310 | 1.795228% |
Noise dominated data is calculated using 1-second bins in cleaned event files. If a bin has >2000 counts, and if more than 50% of those come from <1% of pixels, then it is considered to be noise-dominated and hence unusable.
| Quadrant | # 1 sec bins | Bins with >0 counts | Bins with >2000 counts | High rate bins dominated by noise | Noise dominated (total time) | Noise dominated (detector-on time) | Marked lightcurve |
|---|---|---|---|---|---|---|---|
| A | 18429 | 17272 | 54 | 54 | 0.29% | 0.31% | 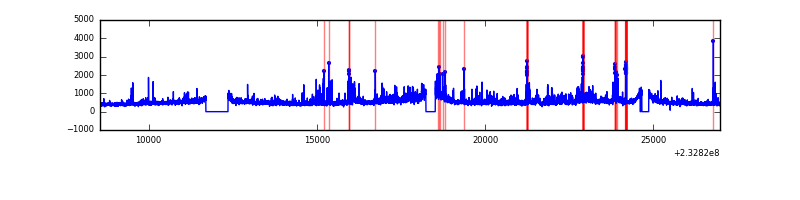 |
| B | 18429 | 17272 | 106 | 106 | 0.58% | 0.61% | 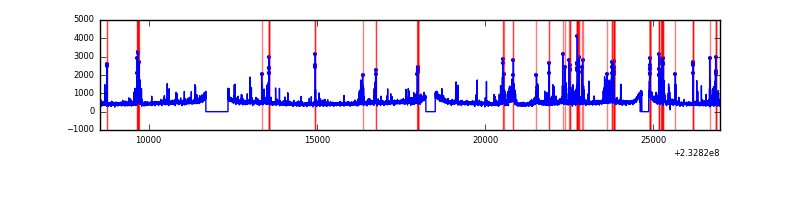 |
| C | 18429 | 17273 | 8 | 8 | 0.04% | 0.05% | 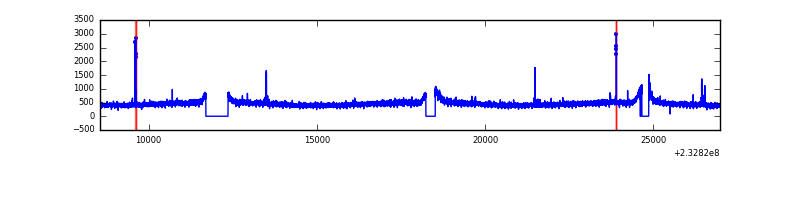 |
| D | 18429 | 17273 | 136 | 136 | 0.74% | 0.79% | 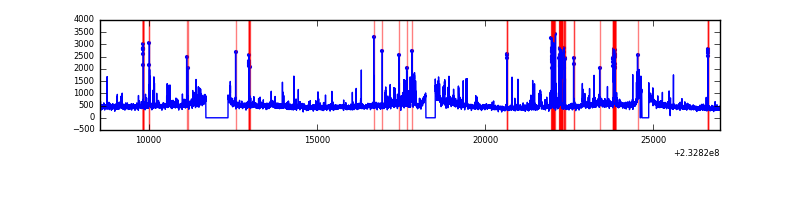 |
Top three noisy pixels from each quadrant. If the there are fewer than three noisy pixels in the level2.evt file, extra rows are filled as -1
| Pixel properties | Quadrant properties | ||||||
|---|---|---|---|---|---|---|---|
| Quadrant | DetID | PixID | Counts | Sigma | Mean | Median | Sigma |
| A | 8 | 5 | 1512989 | 3596.53 | 2060 | 2017 | 420.1 |
| A | 15 | 174 | 109498 | 255.83 | 2060 | 2017 | 420.1 |
| A | 4 | 2 | 52941 | 121.21 | 2060 | 2017 | 420.1 |
| B | 4 | 48 | 590044 | 1485.07 | 2065 | 2013 | 396.0 |
| B | 10 | 16 | 387899 | 974.55 | 2065 | 2013 | 396.0 |
| B | 0 | 214 | 121937 | 302.87 | 2065 | 2013 | 396.0 |
| C | 10 | 22 | 32814 | 66.15 | 2005 | 2015 | 465.6 |
| C | 14 | 234 | 26320 | 52.2 | 2005 | 2015 | 465.6 |
| C | 1 | 3 | 20136 | 38.92 | 2005 | 2015 | 465.6 |
| D | 13 | 105 | 725020 | 1383.67 | 1987 | 1939 | 522.6 |
| D | 8 | 195 | 689222 | 1315.17 | 1987 | 1939 | 522.6 |
| D | 2 | 14 | 168236 | 318.22 | 1987 | 1939 | 522.6 |
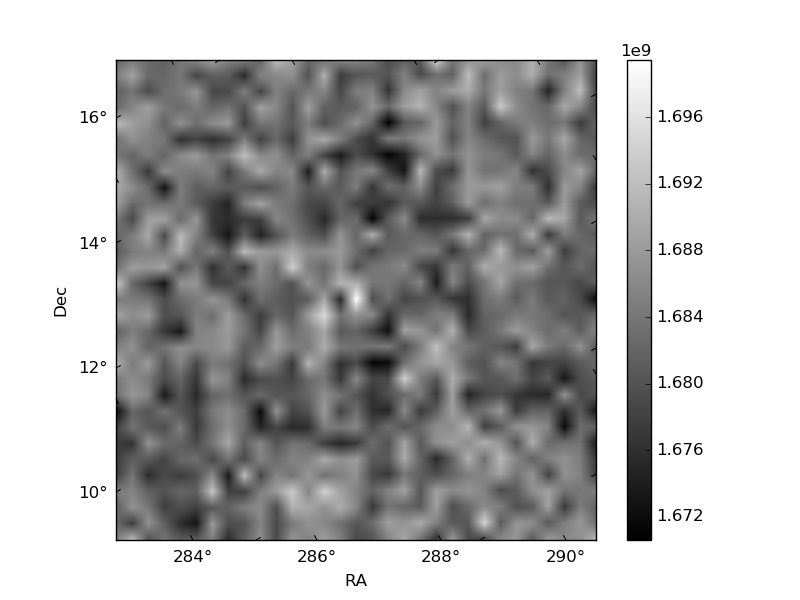
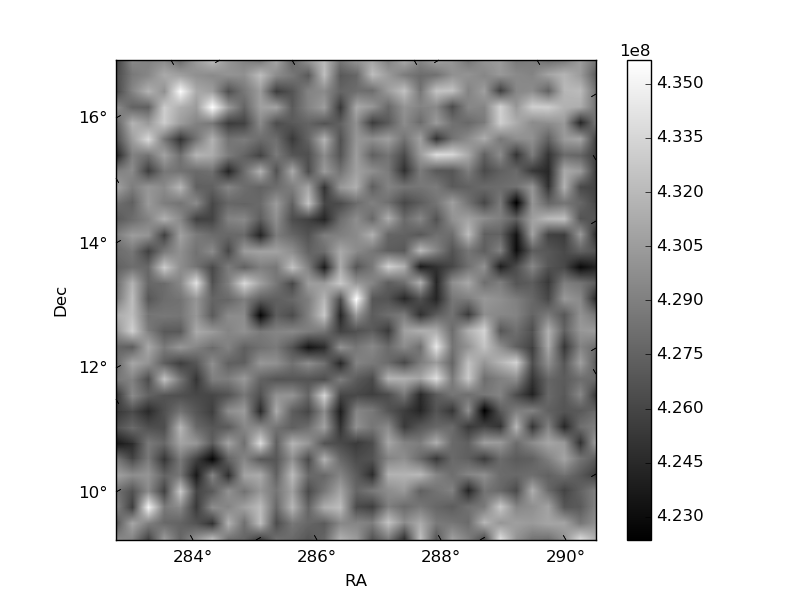
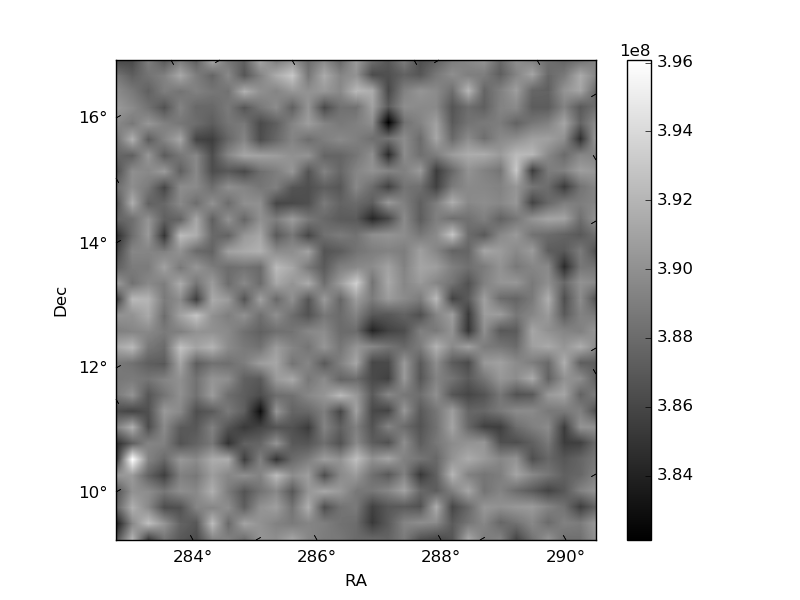
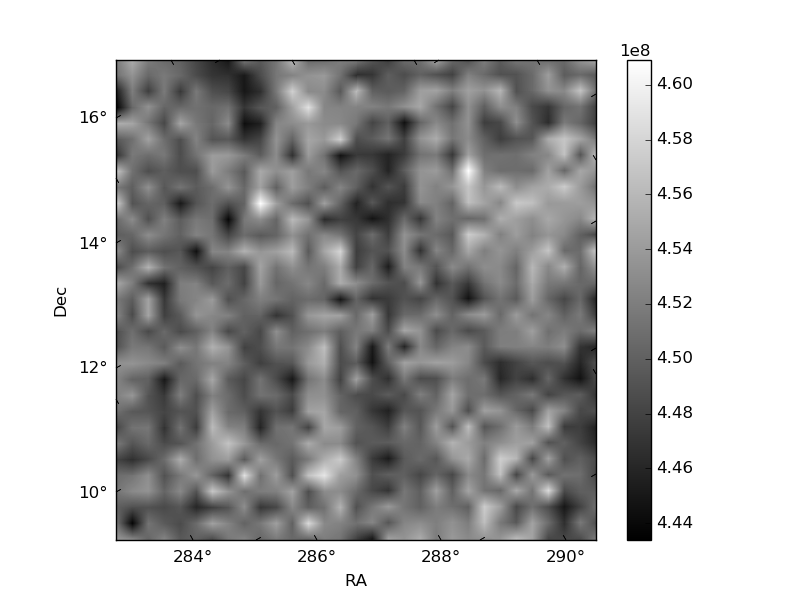
Histogram calculated using DETX and DETY for each event in the final _common_clean file
| Quadrant A | 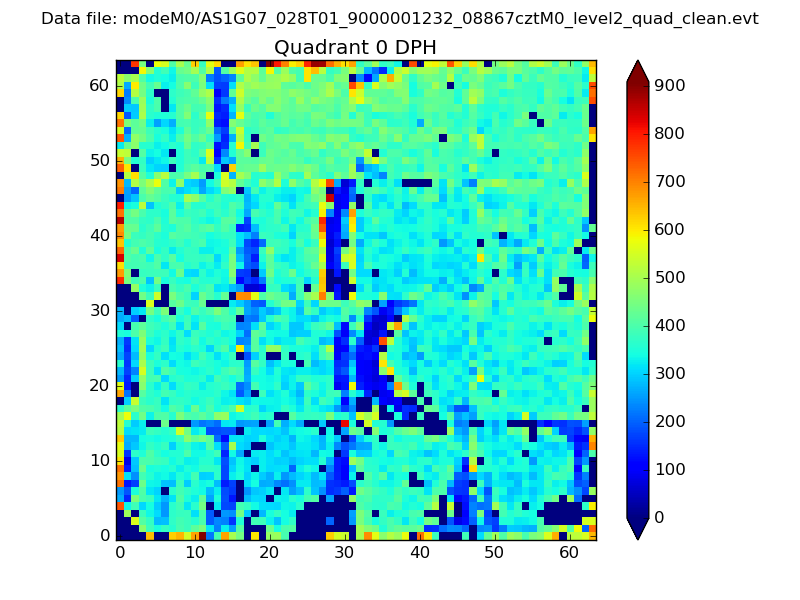 |
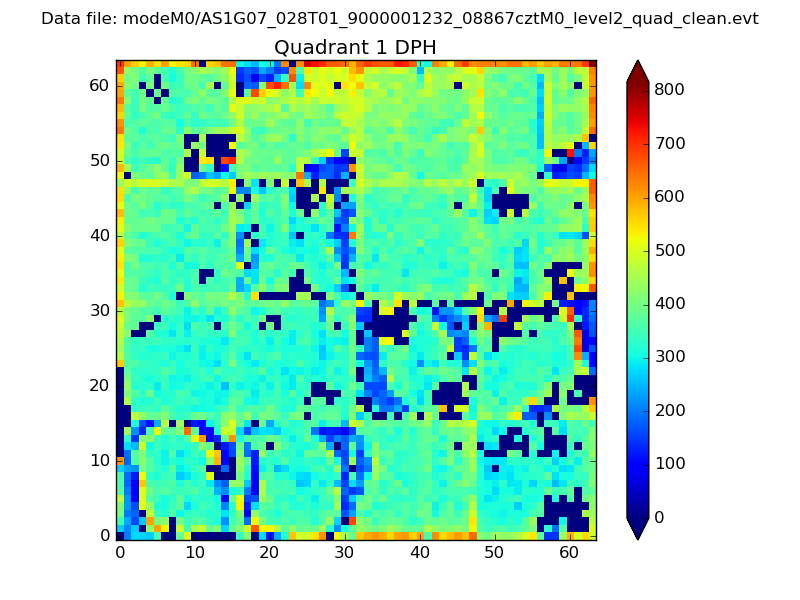 |
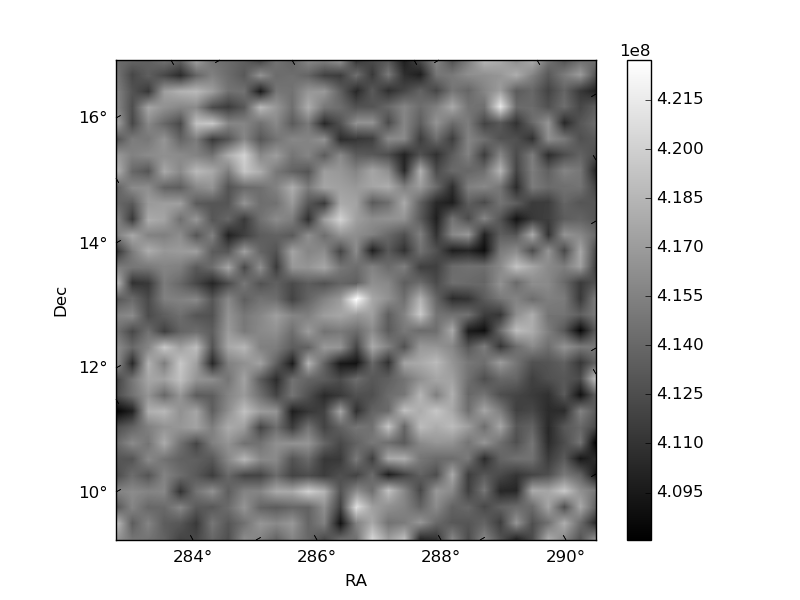
Quadrant B |
|---|---|---|---|
| Quadrant D | 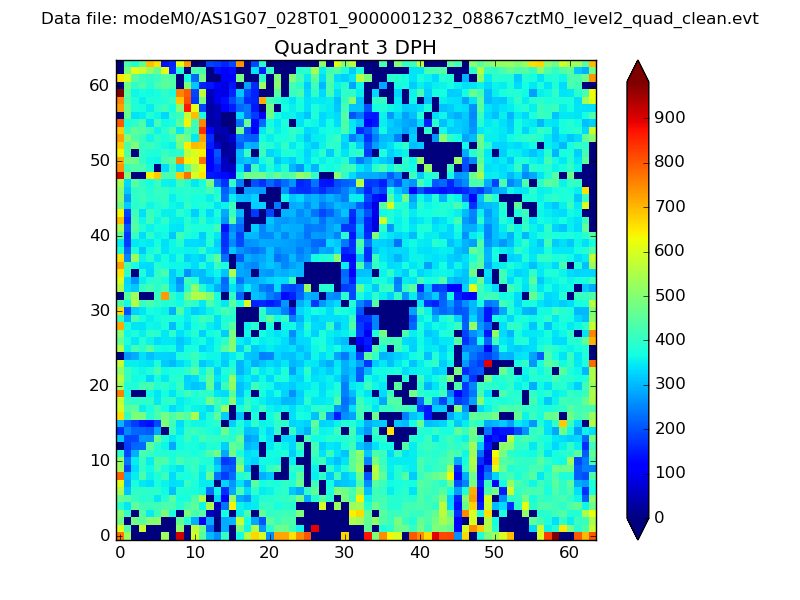 |
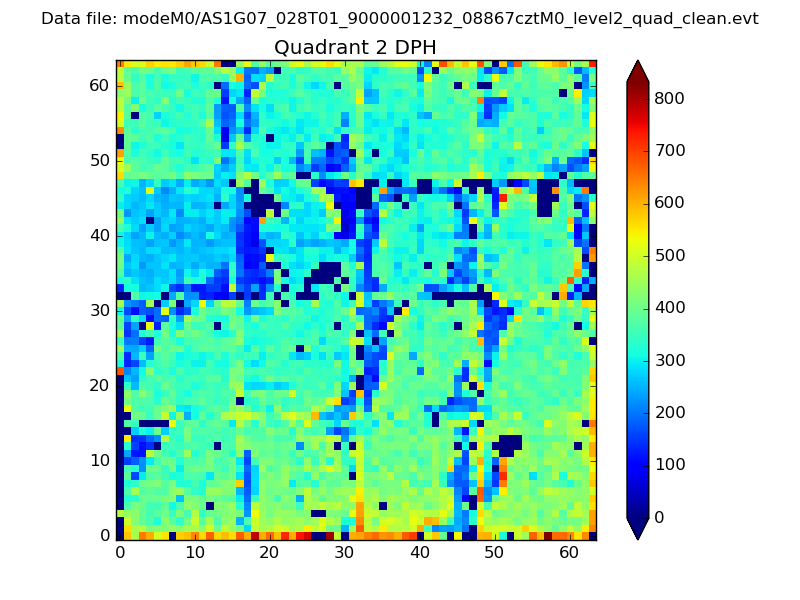 |
Quadrant C |
| Plot type | Count rate plots | Images |
|---|---|---|
| Comparison with Poisson distribution Blue bars denote a histogram of data divided into 1 sec bins. Red curve is a Poisson curve with rate = median count rate of data. |
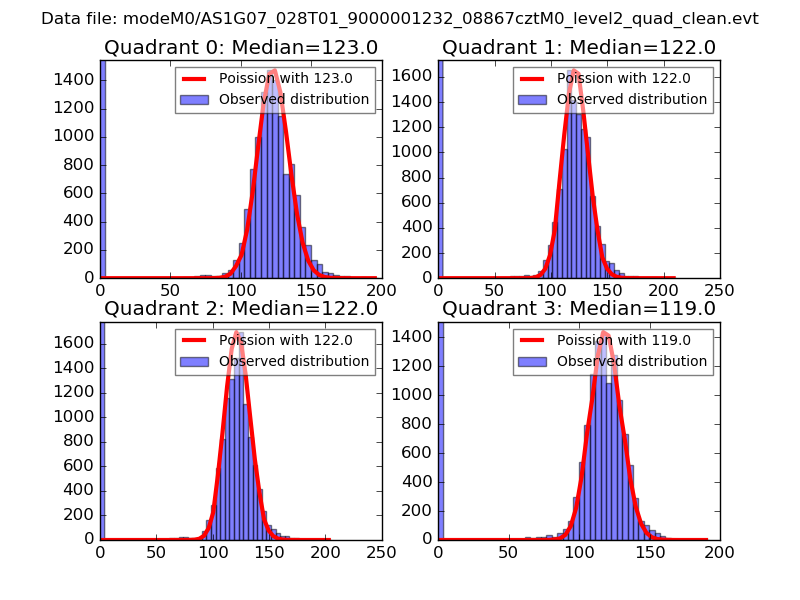 |
 |
| Quadrant-wise count rates Data is divided into 100 sec bins |
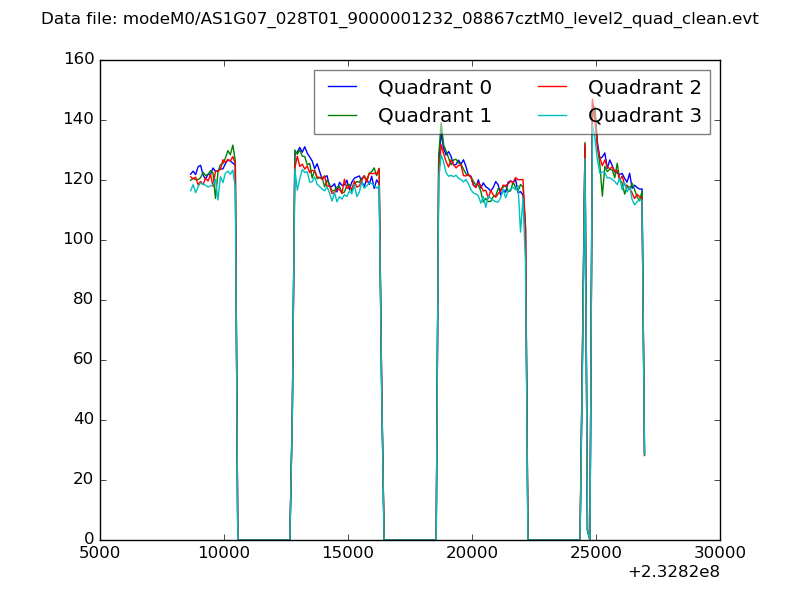 |
|
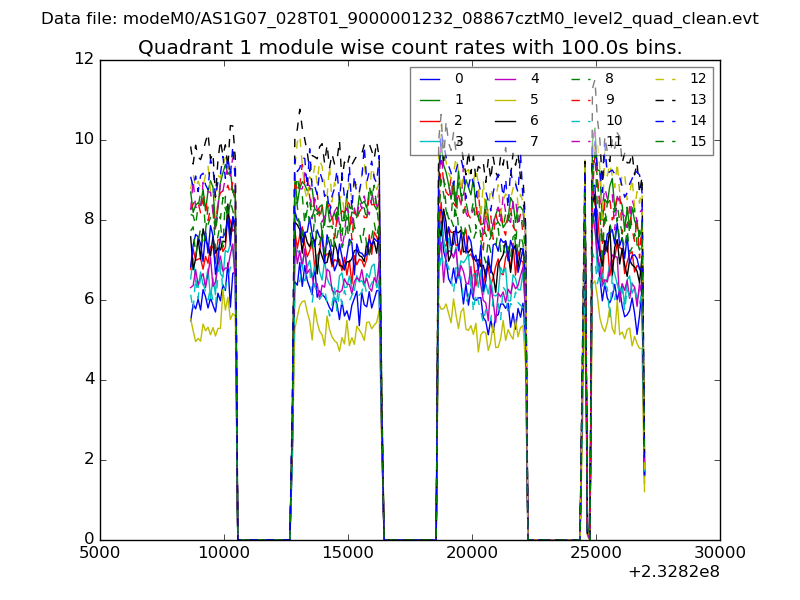
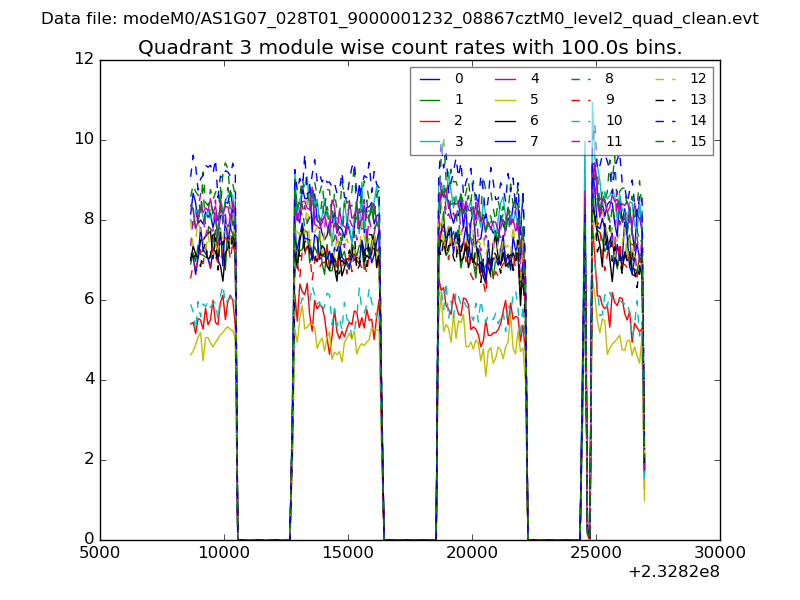
| Module-wise count rates for Quadrant A Data is divided into 100 sec bins |
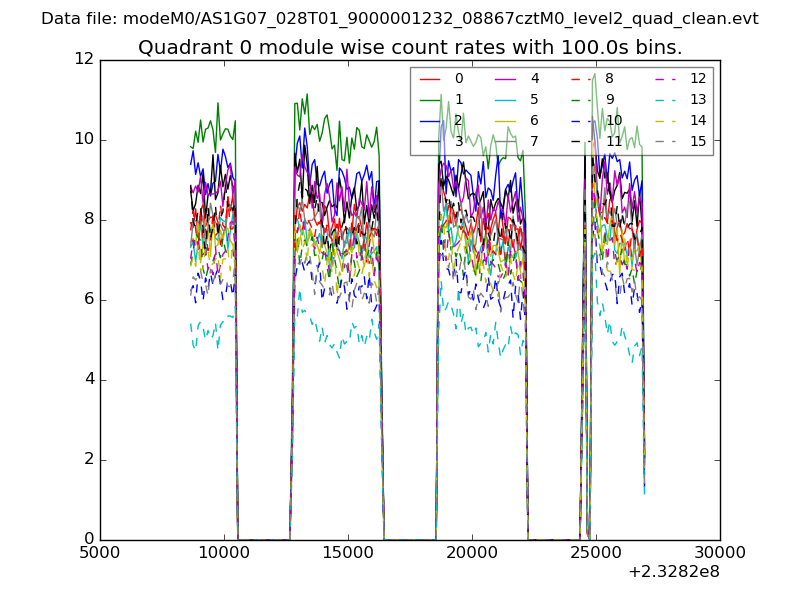 |
 |
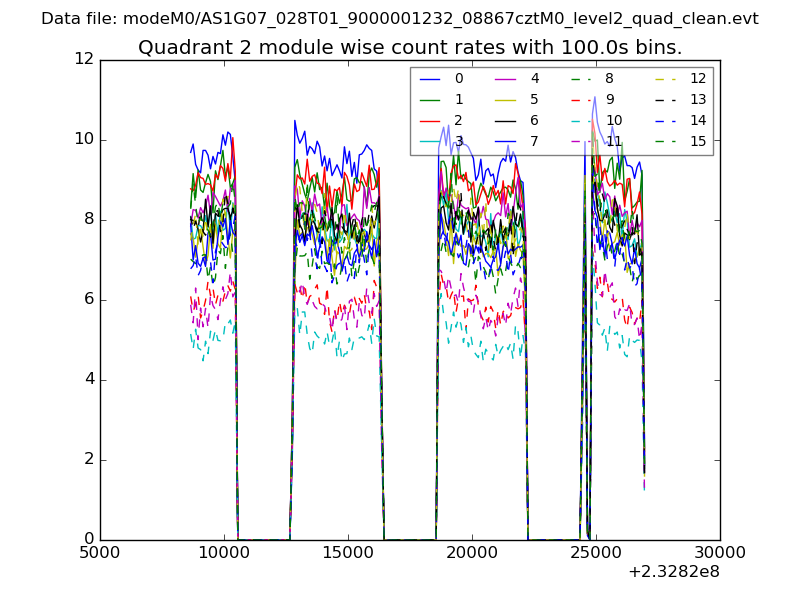
| Module-wise count rates for Quadrant B Data is divided into 100 sec bins |
 |
 |
| Module-wise count rates for Quadrant C Data is divided into 100 sec bins |
 |
 |
| Module-wise count rates for Quadrant D Data is divided into 100 sec bins |
 |
 |
| Parameter | Plot |
|---|---|
| CZT HV Monitor | 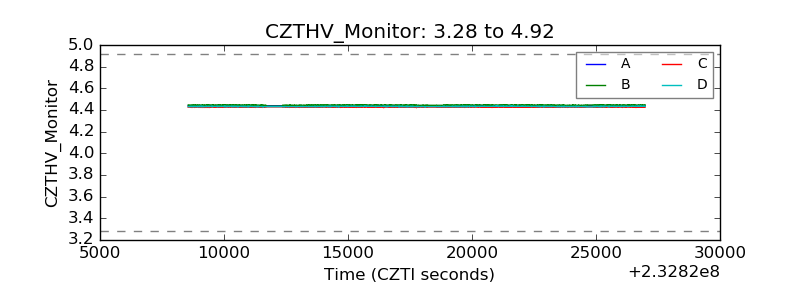 |
| D_VDD | 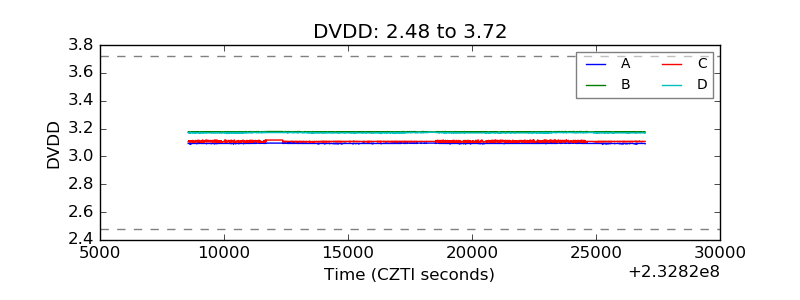 |
| Temperature 1 | 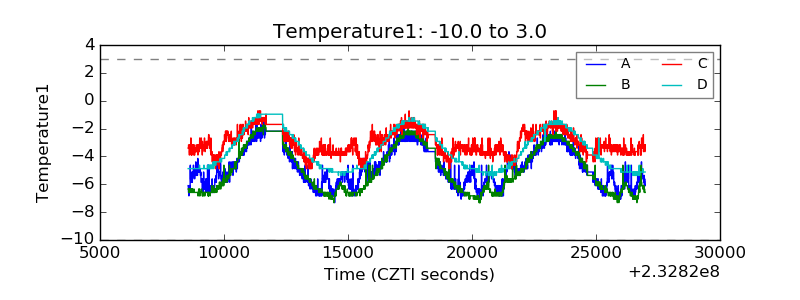 |
| Veto HV Monitor | 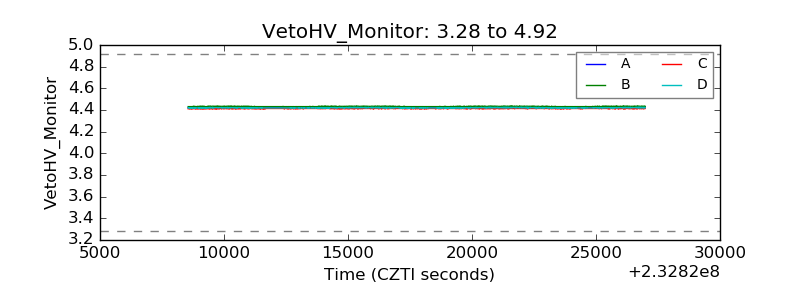 |
| Veto LLD | 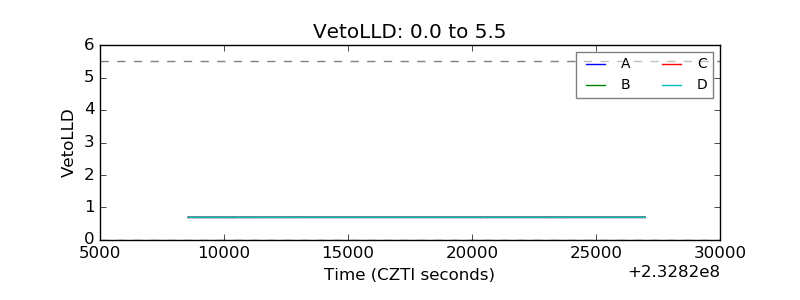 |
| Alpha Counter | 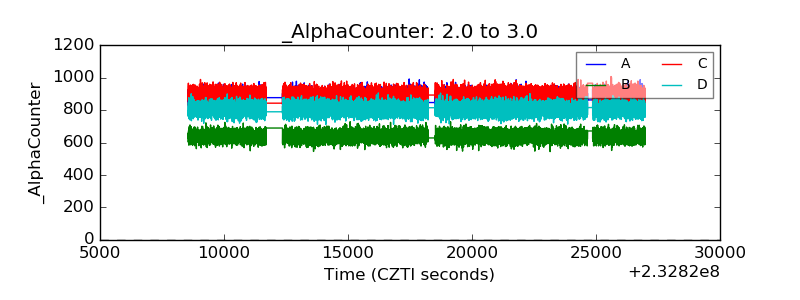 |
| _CPM_Rate | 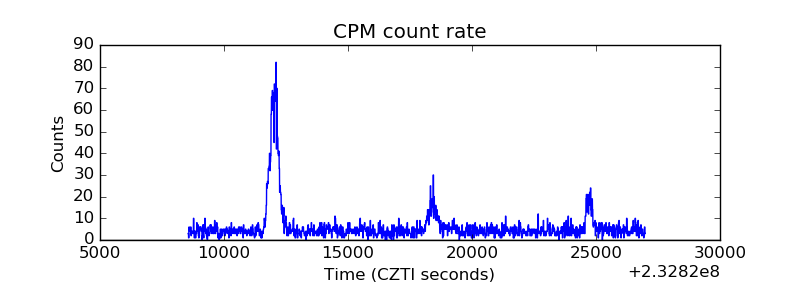 |
| CZT Counter | 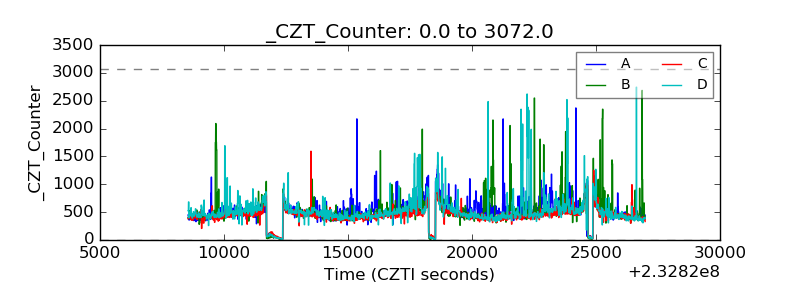 |
| +2.5 Volts monitor |  |
| +5 Volts monitor |  |
| _ROLL_ROT | 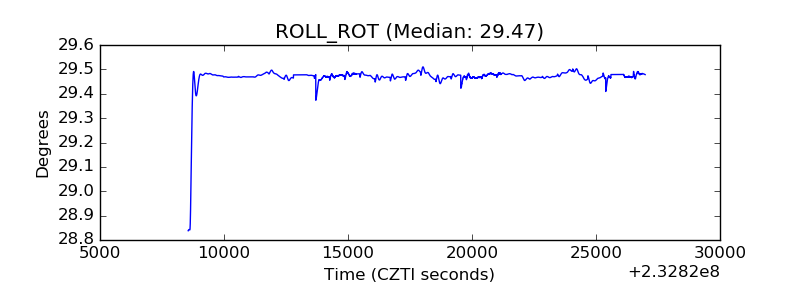 |
| _Roll_DEC | 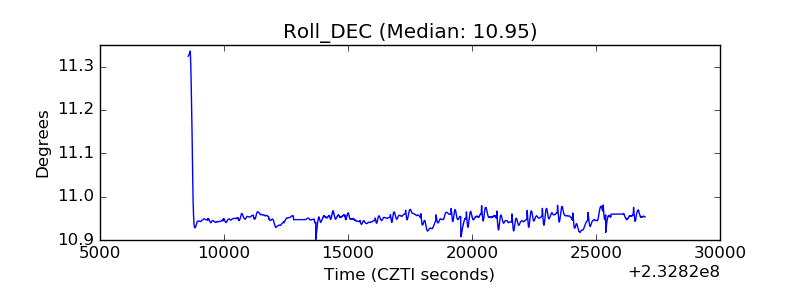 |
| _Roll_RA | 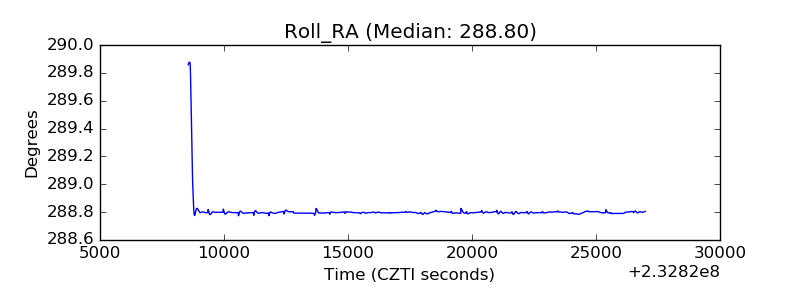 |
| Veto Counter | 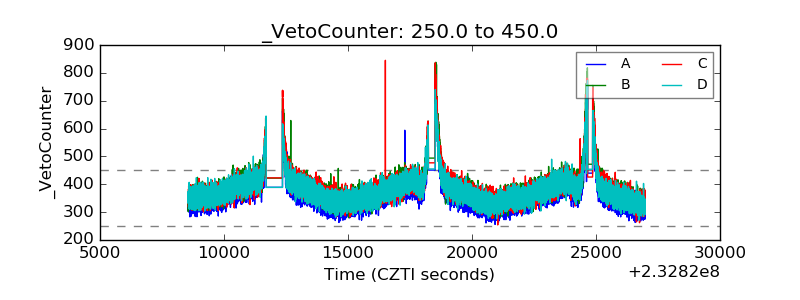 |