| Param | Original file | Final file |
|---|---|---|
| Filename | modeM0/AS1A03_009T01_9000001234cztM0_level2.fits | modeM0/AS1A03_009T01_9000001234cztM0_level2_quad_clean.evt |
| Size (bytes) | 260,697,600 | 229,541,760 |
| Size | 248.6 MB | 218.9 MB |
| Events in quadrant A | 1,549,916 | 1,307,884 |
| Events in quadrant B | 1,508,472 | 1,314,283 |
| Events in quadrant C | 1,542,884 | 1,237,165 |
| Events in quadrant D | 1,327,370 | 1,124,823 |
| Mode M9 | |||
|---|---|---|---|
| Quadrant | BADHDUFLAG | Total packets | Discarded packets |
| A | 0 | 38 | 0 |
| B | 0 | 38 | 0 |
| C | 0 | 38 | 0 |
| D | 0 | 38 | 0 |
| Mode SS | |||
|---|---|---|---|
| Quadrant | BADHDUFLAG | Total packets | Discarded packets |
| A | 0 | 580 | 0 |
| B | 0 | 580 | 0 |
| C | 0 | 580 | 0 |
| D | 0 | 580 | 0 |
| Mode M0 | |||
|---|---|---|---|
| Quadrant | BADHDUFLAG | Total packets | Discarded packets |
| A | 0 | 65747 | 0 |
| B | 0 | 59459 | 0 |
| C | 0 | 57898 | 0 |
| D | 0 | 67289 | 0 |
| Quadrant | Total seconds | Saturated seconds | Saturation percentage |
|---|---|---|---|
| A | 28612 | 406 | 1.418985% |
| B | 28612 | 286 | 0.999581% |
| C | 28611 | 176 | 0.615148% |
| D | 28611 | 640 | 2.236902% |
Noise dominated data is calculated using 1-second bins in cleaned event files. If a bin has >2000 counts, and if more than 50% of those come from <1% of pixels, then it is considered to be noise-dominated and hence unusable.
| Quadrant | # 1 sec bins | Bins with >0 counts | Bins with >2000 counts | High rate bins dominated by noise | Noise dominated (total time) | Noise dominated (detector-on time) | Marked lightcurve |
|---|---|---|---|---|---|---|---|
| A | 32307 | 28609 | 0 | 0 | 0.00% | 0.00% | 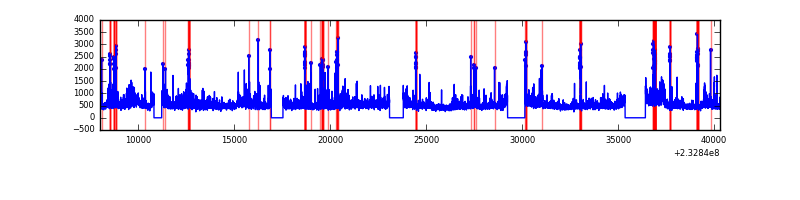 |
| B | 32307 | 28607 | 0 | 0 | 0.00% | 0.00% |  |
| C | 32307 | 28609 | 0 | 0 | 0.00% | 0.00% |  |
| D | 32307 | 28603 | 0 | 0 | 0.00% | 0.00% |  |
Top three noisy pixels from each quadrant. If the there are fewer than three noisy pixels in the level2.evt file, extra rows are filled as -1
| Pixel properties | Quadrant properties | ||||||
|---|---|---|---|---|---|---|---|
| Quadrant | DetID | PixID | Counts | Sigma | Mean | Median | Sigma |
| A | 14 | 188 | 1572 | 11.53 | 402 | 376 | 103.7 |
| A | 0 | 29 | 1556 | 11.38 | 402 | 376 | 103.7 |
| A | 14 | 204 | 1359 | 9.48 | 402 | 376 | 103.7 |
| B | 2 | 9 | 1324 | 11.8 | 398 | 379 | 80.1 |
| B | 14 | 254 | 1076 | 8.7 | 398 | 379 | 80.1 |
| B | 12 | 226 | 1028 | 8.1 | 398 | 379 | 80.1 |
| C | 1 | 80 | 1127 | 6.93 | 407 | 376 | 108.3 |
| C | 7 | 111 | 1061 | 6.32 | 407 | 376 | 108.3 |
| C | 1 | 81 | 1061 | 6.32 | 407 | 376 | 108.3 |
| D | 3 | 14 | 1009 | 6.55 | 377 | 344 | 101.5 |
| D | 6 | 231 | 959 | 6.06 | 377 | 344 | 101.5 |
| D | 7 | 5 | 956 | 6.03 | 377 | 344 | 101.5 |
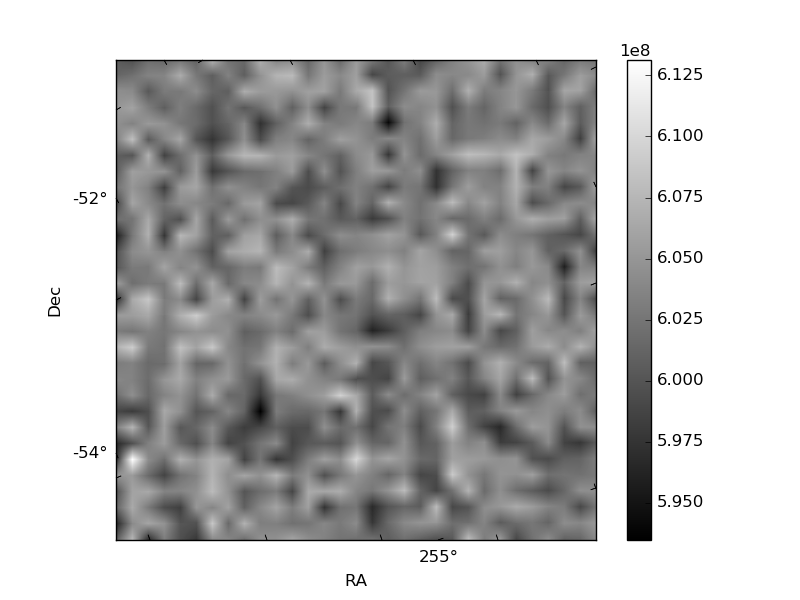
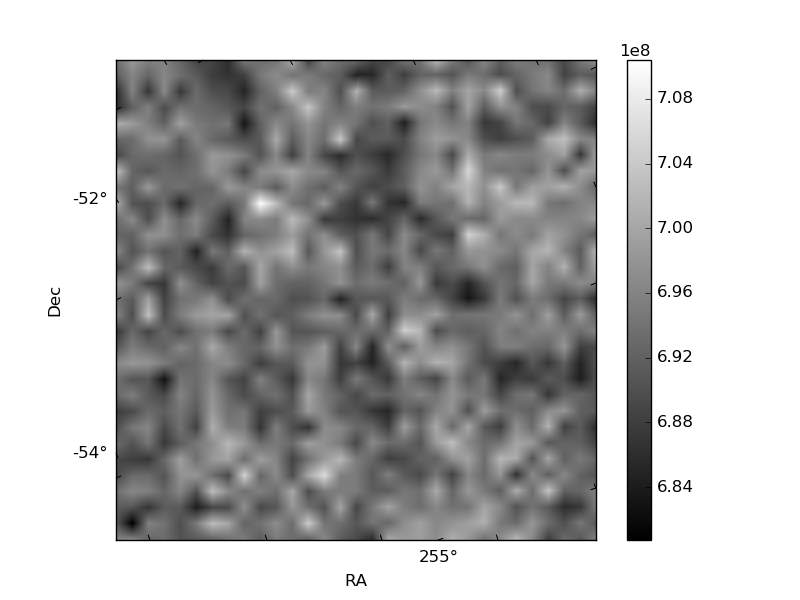
Histogram calculated using DETX and DETY for each event in the final _common_clean file
| Quadrant A |  |
 |
Quadrant B |
|---|---|---|---|
| Quadrant D | 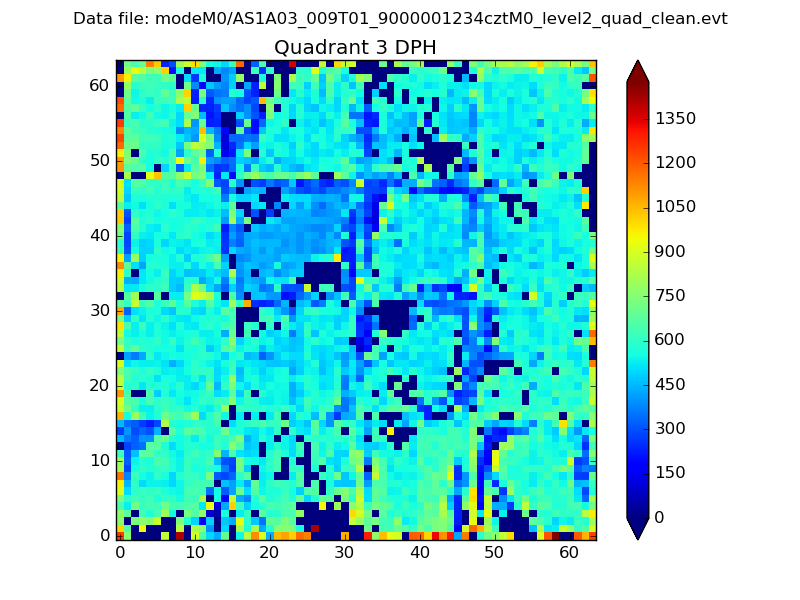 |
 |
Quadrant C |
| Plot type | Count rate plots | Images |
|---|---|---|
| Comparison with Poisson distribution Blue bars denote a histogram of data divided into 1 sec bins. Red curve is a Poisson curve with rate = median count rate of data. |
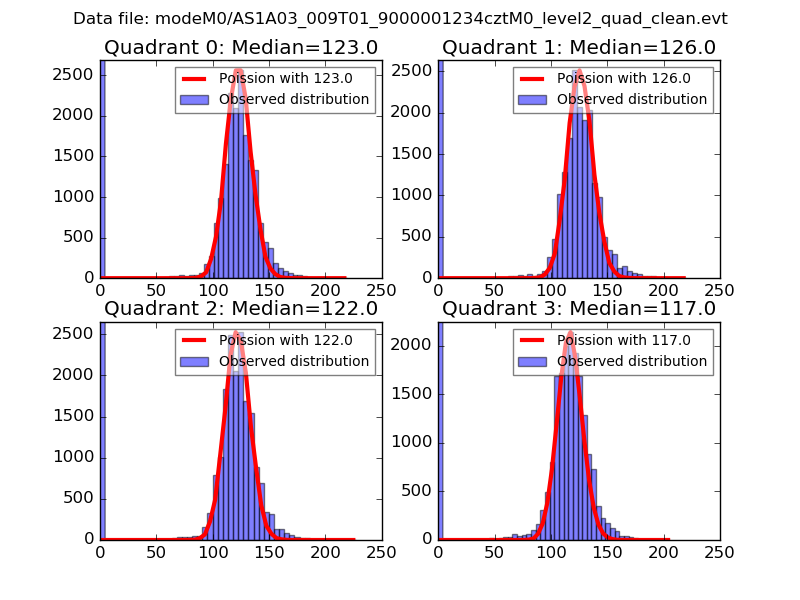 |
 |
| Quadrant-wise count rates Data is divided into 100 sec bins |
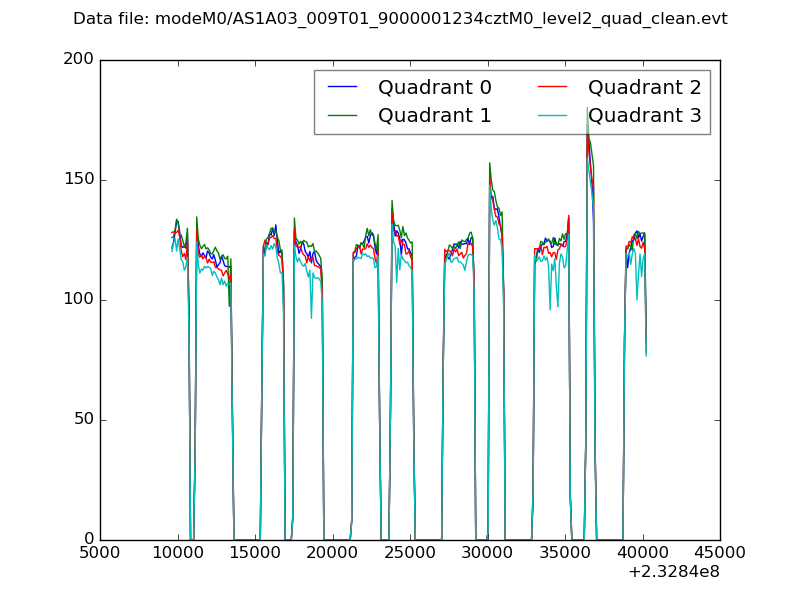 |
|
| Module-wise count rates for Quadrant A Data is divided into 100 sec bins |
 |
 |
| Module-wise count rates for Quadrant B Data is divided into 100 sec bins |
 |
 |
| Module-wise count rates for Quadrant C Data is divided into 100 sec bins |
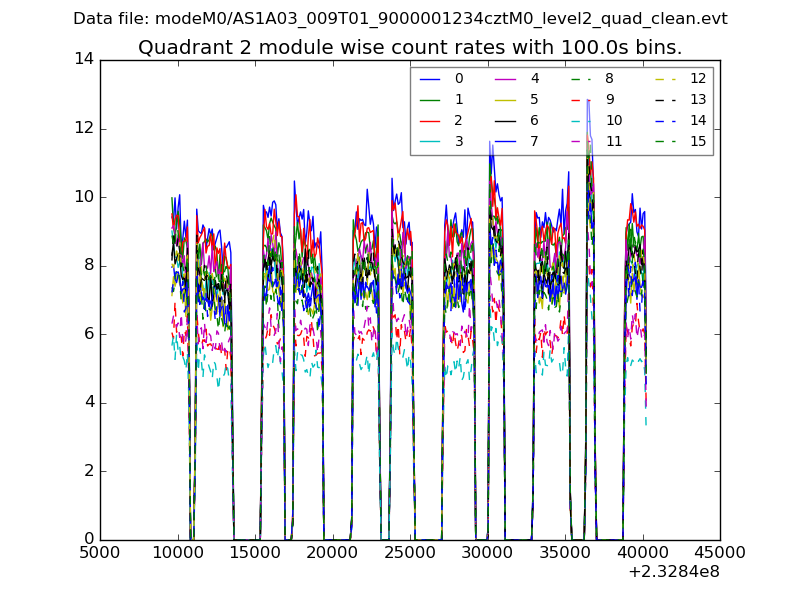 |
 |
| Module-wise count rates for Quadrant D Data is divided into 100 sec bins |
 |
 |
| Parameter | Plot |
|---|---|
| CZT HV Monitor |  |
| D_VDD |  |
| Temperature 1 |  |
| Veto HV Monitor | 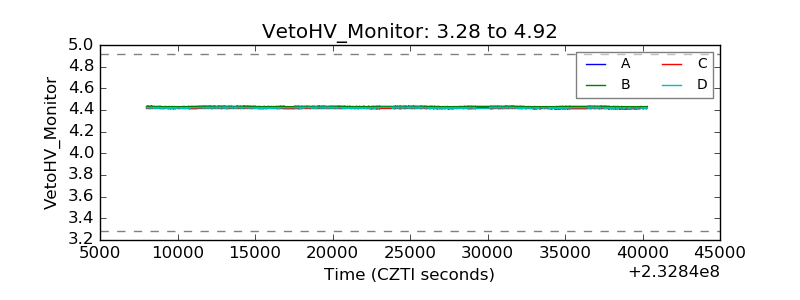 |
| Veto LLD |  |
| Alpha Counter |  |
| _CPM_Rate |  |
| CZT Counter |  |
| +2.5 Volts monitor |  |
| +5 Volts monitor |  |
| _ROLL_ROT | 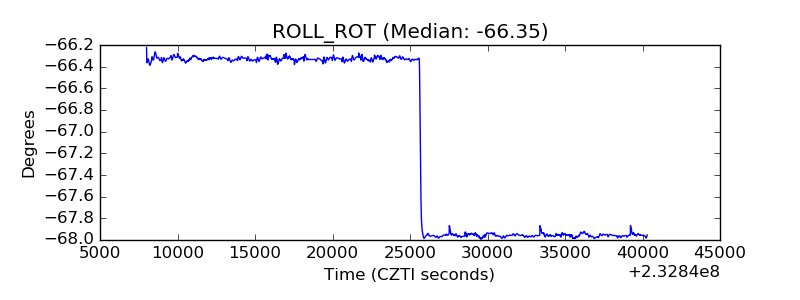 |
| _Roll_DEC |  |
| _Roll_RA | 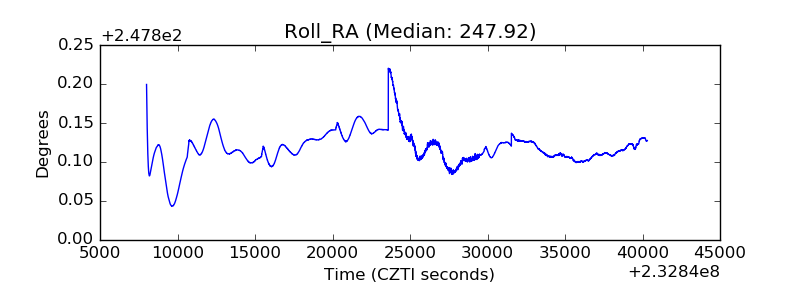 |
| Veto Counter | 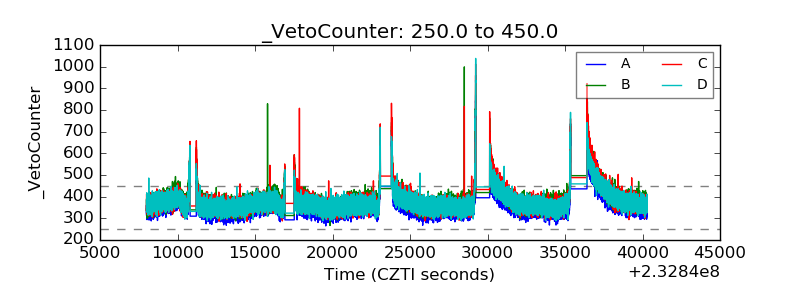 |