| Param | Original file | Final file |
|---|---|---|
| Filename | modeM0/AS1A03_009T01_9000001234_08867cztM0_level2.evt | modeM0/AS1A03_009T01_9000001234_08867cztM0_level2_quad_clean.evt |
| Size (bytes) | 1,429,381,440 | 258,624,000 |
| Size | 1.3 GB | 246.6 MB |
| Events in quadrant A | 11,542,232 | 1,615,986 |
| Events in quadrant B | 9,889,469 | 1,652,027 |
| Events in quadrant C | 9,249,229 | 1,594,911 |
| Events in quadrant D | 11,199,011 | 1,534,643 |
| Mode M9 | |||
|---|---|---|---|
| Quadrant | BADHDUFLAG | Total packets | Discarded packets |
| A | 0 | 27 | 0 |
| B | 0 | 27 | 0 |
| C | 0 | 27 | 0 |
| D | 0 | 27 | 0 |
| Mode SS | |||
|---|---|---|---|
| Quadrant | BADHDUFLAG | Total packets | Discarded packets |
| A | 0 | 422 | 0 |
| B | 0 | 422 | 0 |
| C | 0 | 422 | 0 |
| D | 0 | 422 | 0 |
| Mode M0 | |||
|---|---|---|---|
| Quadrant | BADHDUFLAG | Total packets | Discarded packets |
| A | 0 | 47657 | 5 |
| B | 0 | 43210 | 4 |
| C | 0 | 42147 | 6 |
| D | 0 | 46911 | 6 |
| Quadrant | Total seconds | Saturated seconds | Saturation percentage |
|---|---|---|---|
| A | 20857 | 270 | 1.294529% |
| B | 20857 | 221 | 1.059596% |
| C | 20856 | 139 | 0.666475% |
| D | 20856 | 338 | 1.620637% |
Noise dominated data is calculated using 1-second bins in cleaned event files. If a bin has >2000 counts, and if more than 50% of those come from <1% of pixels, then it is considered to be noise-dominated and hence unusable.
| Quadrant | # 1 sec bins | Bins with >0 counts | Bins with >2000 counts | High rate bins dominated by noise | Noise dominated (total time) | Noise dominated (detector-on time) | Marked lightcurve |
|---|---|---|---|---|---|---|---|
| A | 23492 | 20859 | 84 | 84 | 0.36% | 0.40% | 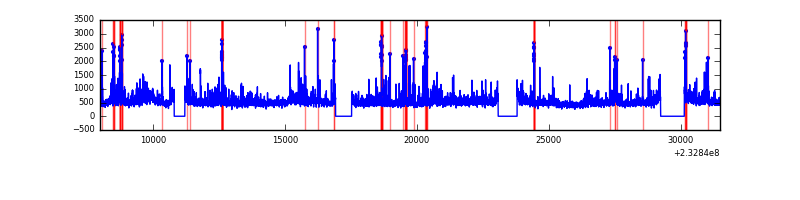 |
| B | 23492 | 20859 | 39 | 39 | 0.17% | 0.19% | 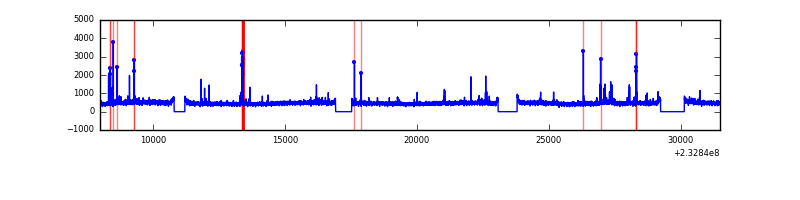 |
| C | 23492 | 20859 | 0 | 0 | 0.00% | 0.00% | 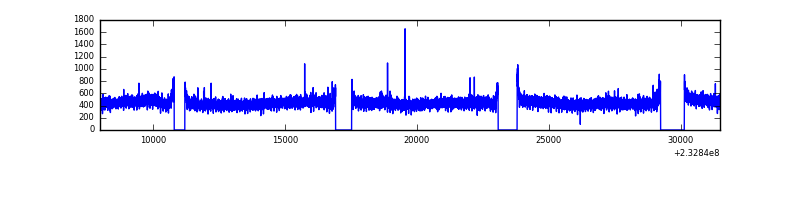 |
| D | 23492 | 20857 | 165 | 165 | 0.70% | 0.79% | 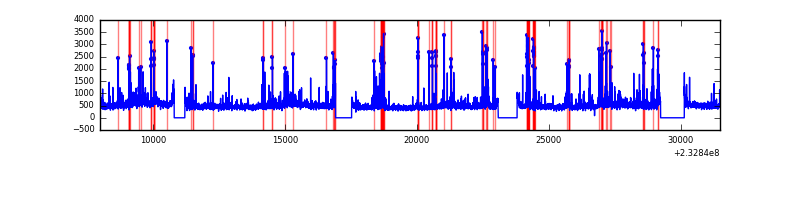 |
Top three noisy pixels from each quadrant. If the there are fewer than three noisy pixels in the level2.evt file, extra rows are filled as -1
| Pixel properties | Quadrant properties | ||||||
|---|---|---|---|---|---|---|---|
| Quadrant | DetID | PixID | Counts | Sigma | Mean | Median | Sigma |
| A | 8 | 5 | 1894060 | 3859.23 | 2416 | 2358 | 490.2 |
| A | 15 | 174 | 149346 | 299.87 | 2416 | 2358 | 490.2 |
| A | 13 | 248 | 76199 | 150.64 | 2416 | 2358 | 490.2 |
| B | 10 | 16 | 152924 | 324.88 | 2436 | 2371 | 463.4 |
| B | 4 | 48 | 136746 | 289.97 | 2436 | 2371 | 463.4 |
| B | 12 | 111 | 50387 | 103.61 | 2436 | 2371 | 463.4 |
| C | 14 | 67 | 19760 | 31.76 | 2364 | 2374 | 547.4 |
| C | 13 | 61 | 17545 | 27.71 | 2364 | 2374 | 547.4 |
| C | 1 | 3 | 8790 | 11.72 | 2364 | 2374 | 547.4 |
| D | 8 | 195 | 838765 | 1486.99 | 2335 | 2278 | 562.5 |
| D | 2 | 14 | 472863 | 836.54 | 2335 | 2278 | 562.5 |
| D | 1 | 52 | 461018 | 815.49 | 2335 | 2278 | 562.5 |
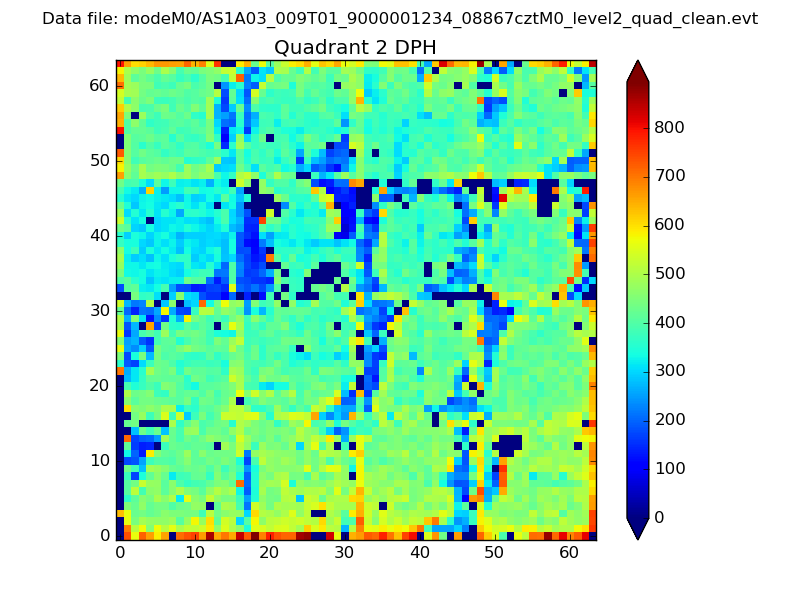
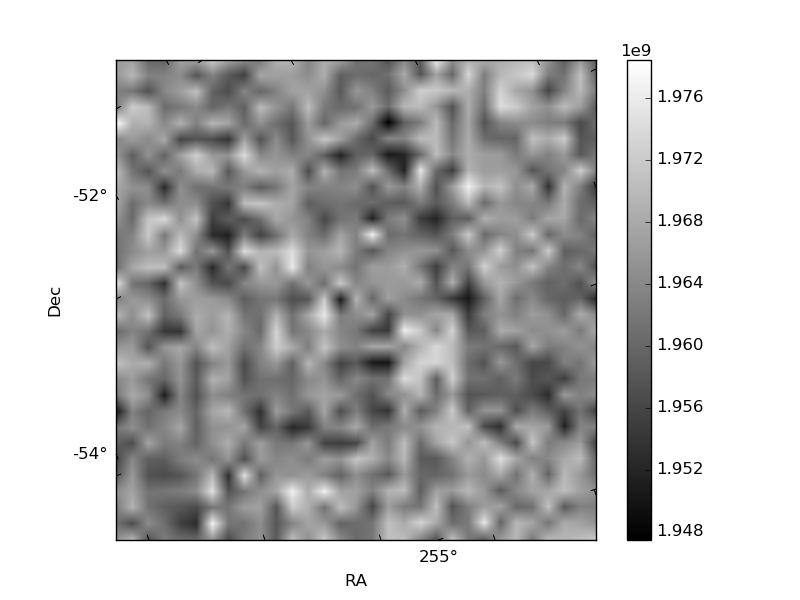
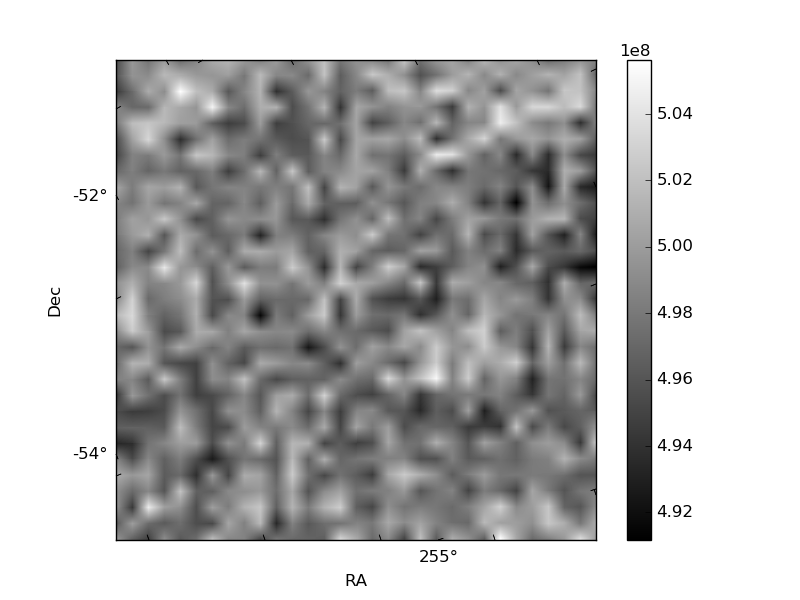
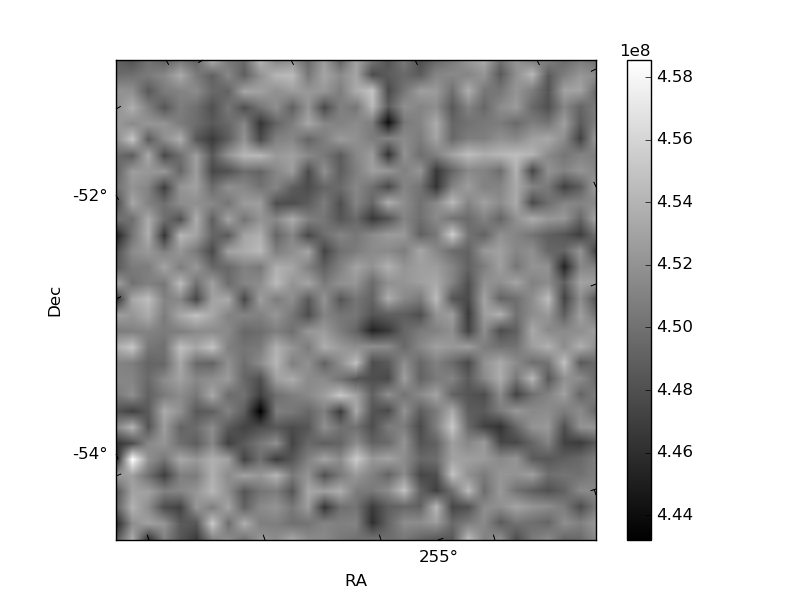
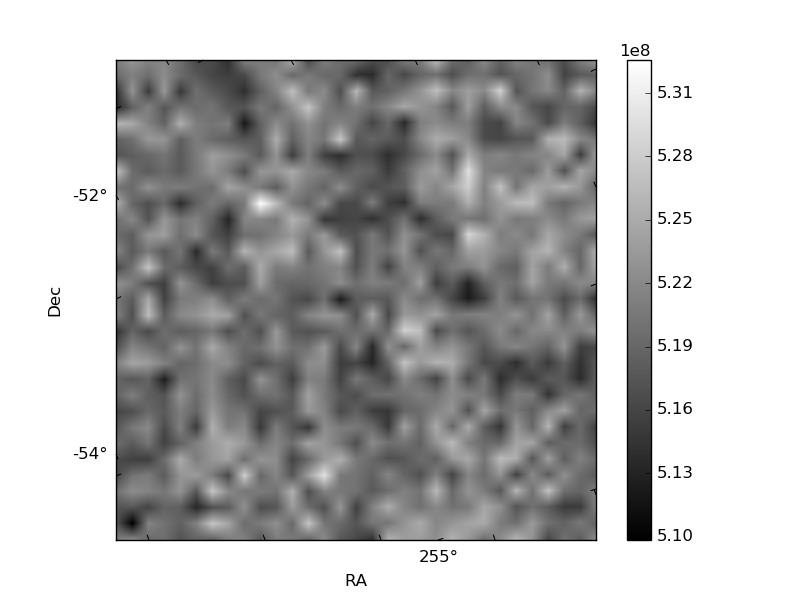
Histogram calculated using DETX and DETY for each event in the final _common_clean file
| Quadrant A | 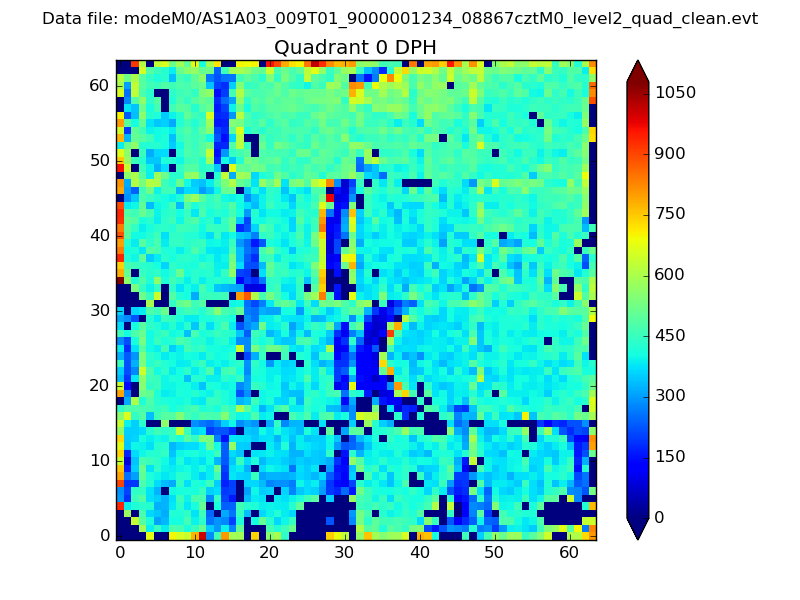 |
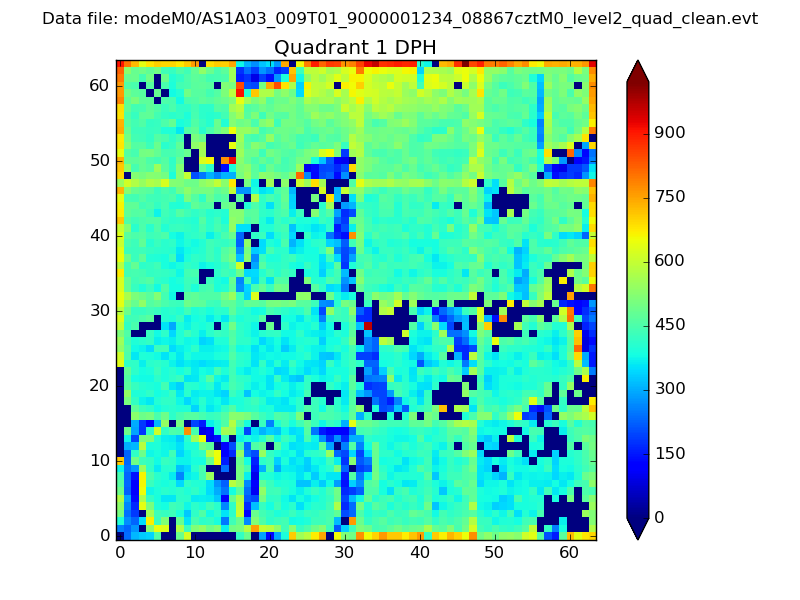 |
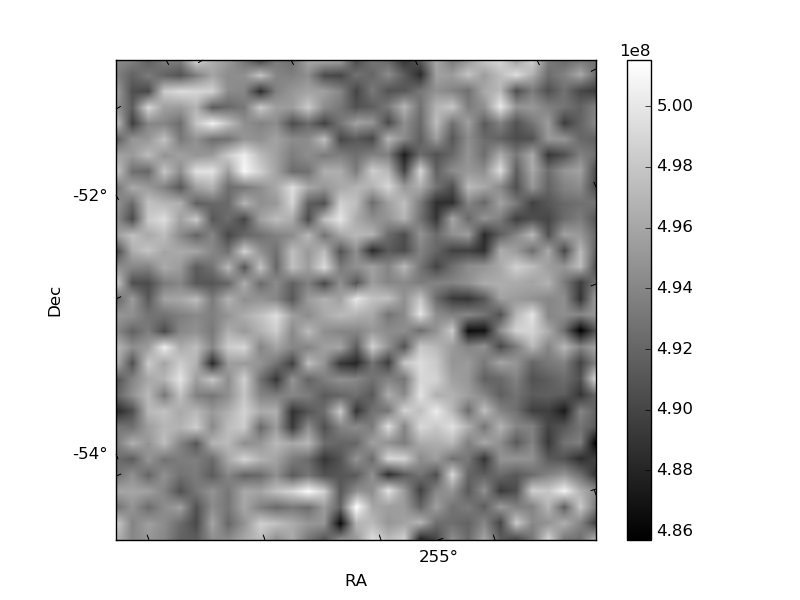
Quadrant B |
|---|---|---|---|
| Quadrant D | 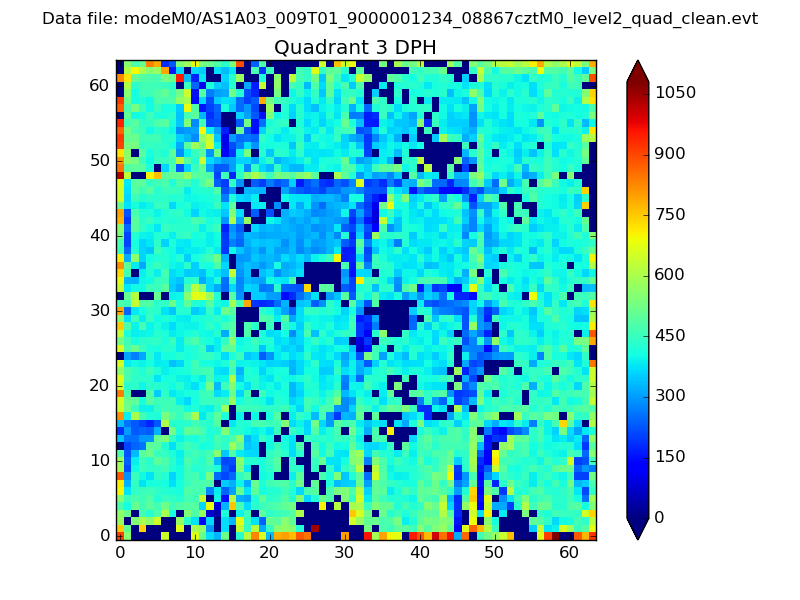 |
 |
Quadrant C |
| Plot type | Count rate plots | Images |
|---|---|---|
| Comparison with Poisson distribution Blue bars denote a histogram of data divided into 1 sec bins. Red curve is a Poisson curve with rate = median count rate of data. |
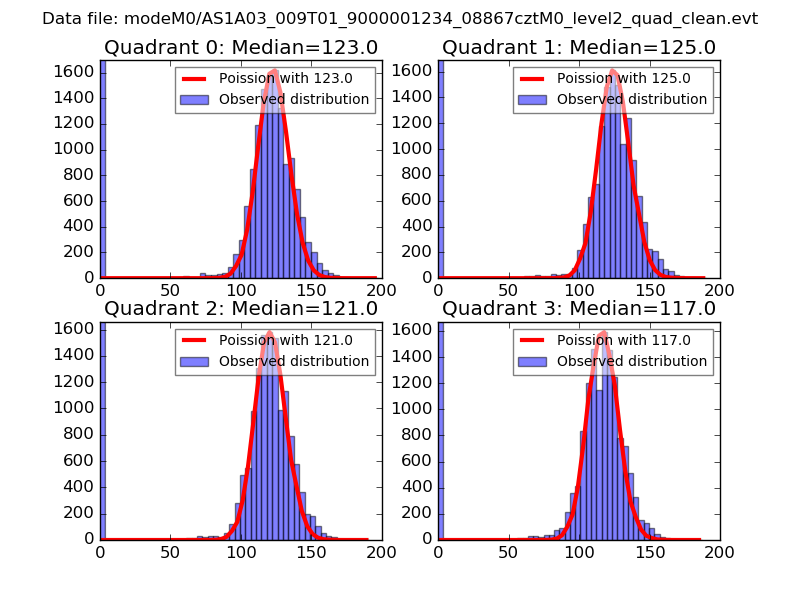 |
 |
| Quadrant-wise count rates Data is divided into 100 sec bins |
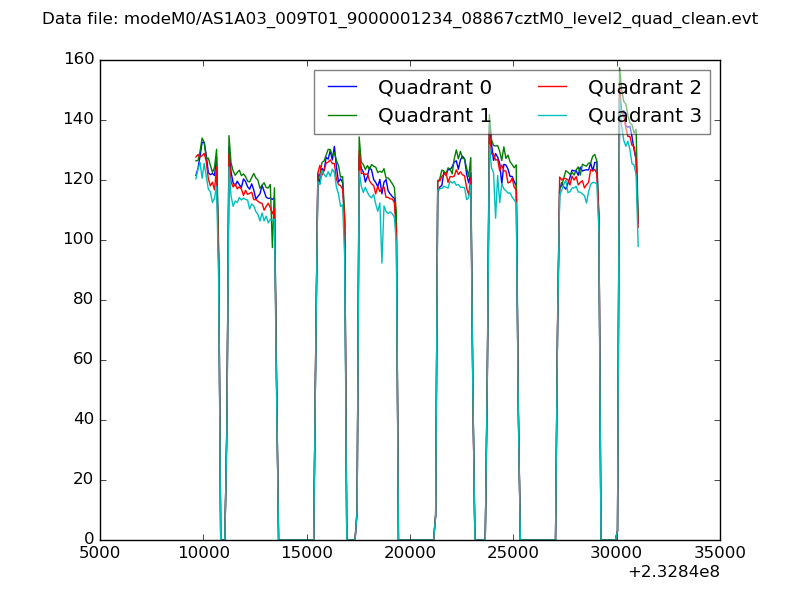 |
|
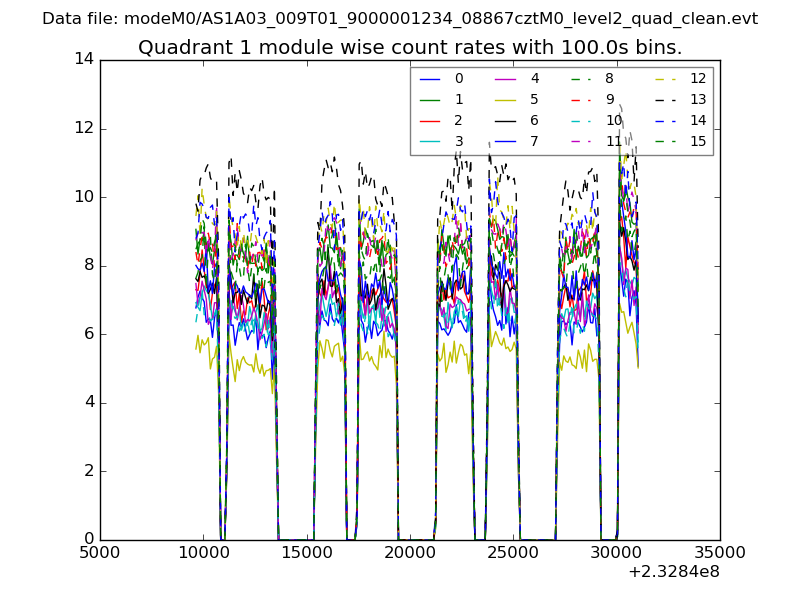
| Module-wise count rates for Quadrant A Data is divided into 100 sec bins |
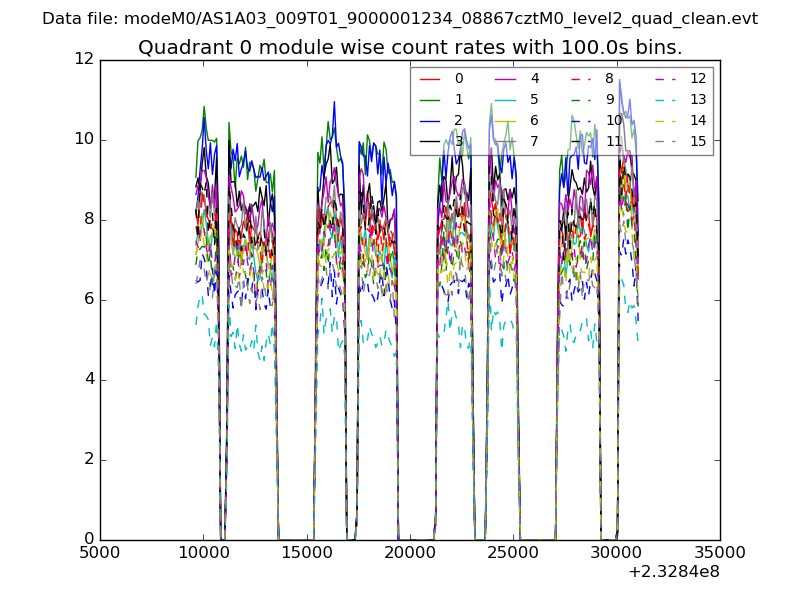 |
 |
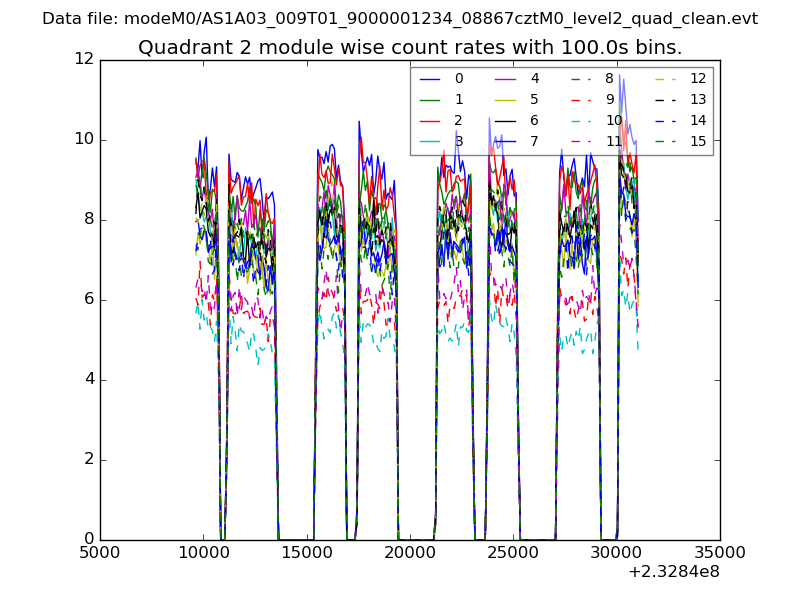
| Module-wise count rates for Quadrant B Data is divided into 100 sec bins |
 |
 |
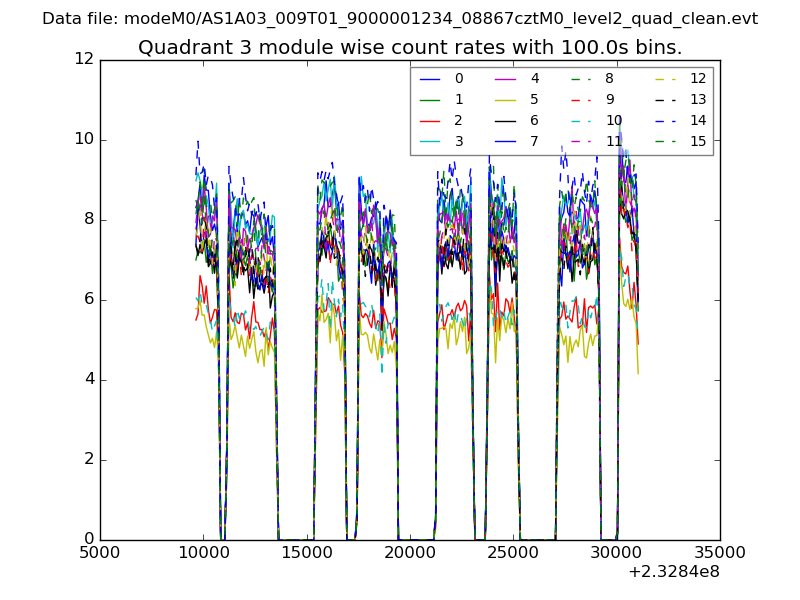
| Module-wise count rates for Quadrant C Data is divided into 100 sec bins |
 |
 |
| Module-wise count rates for Quadrant D Data is divided into 100 sec bins |
 |
 |
| Parameter | Plot |
|---|---|
| CZT HV Monitor | 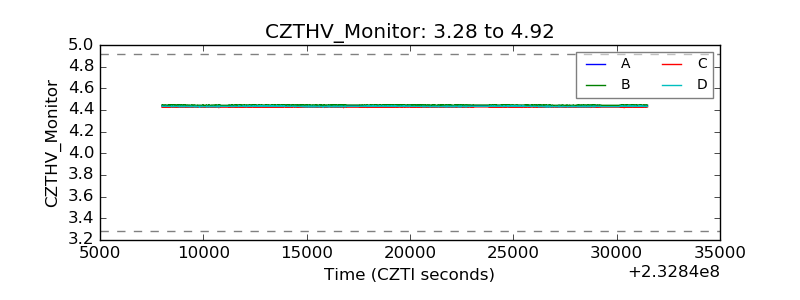 |
| D_VDD | 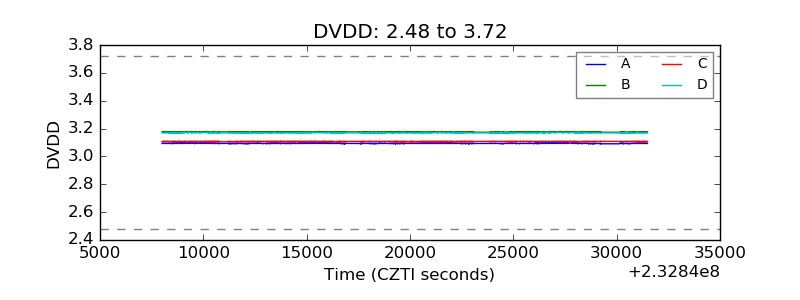 |
| Temperature 1 | 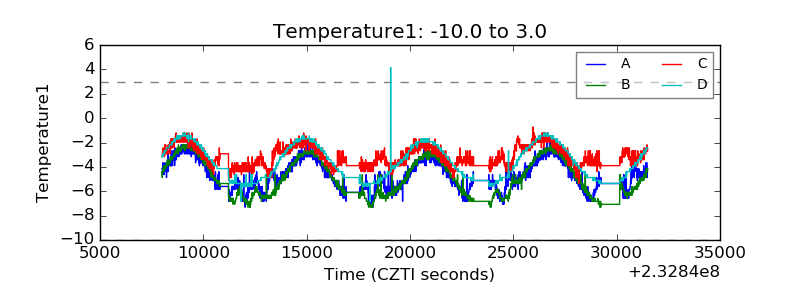 |
| Veto HV Monitor | 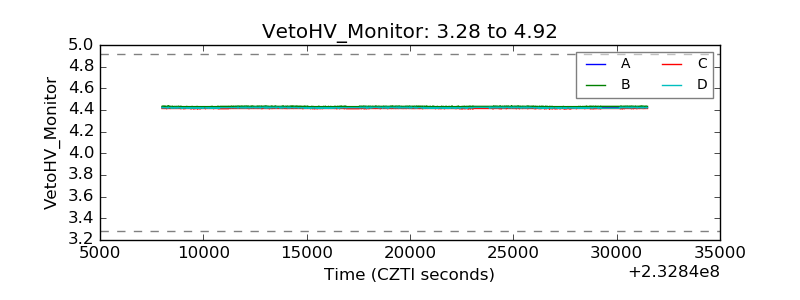 |
| Veto LLD | 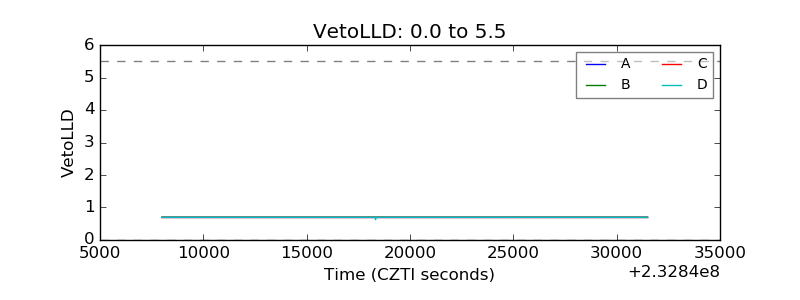 |
| Alpha Counter | 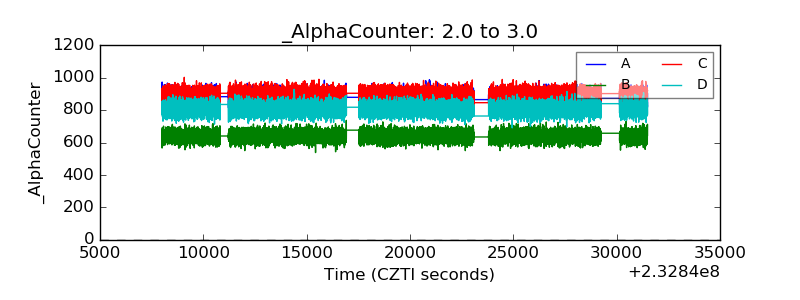 |
| _CPM_Rate | 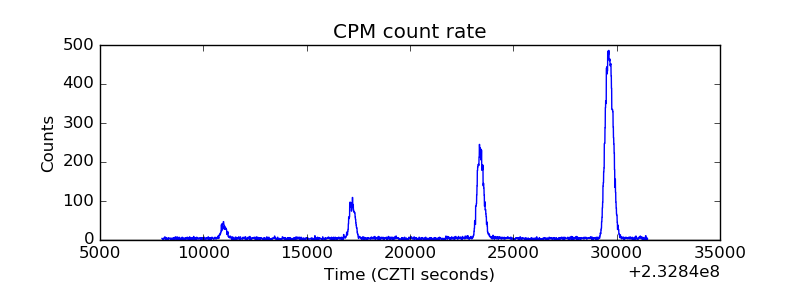 |
| CZT Counter | 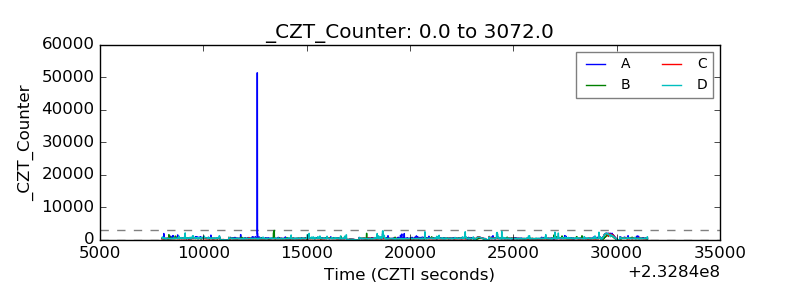 |
| +2.5 Volts monitor |  |
| +5 Volts monitor |  |
| _ROLL_ROT | 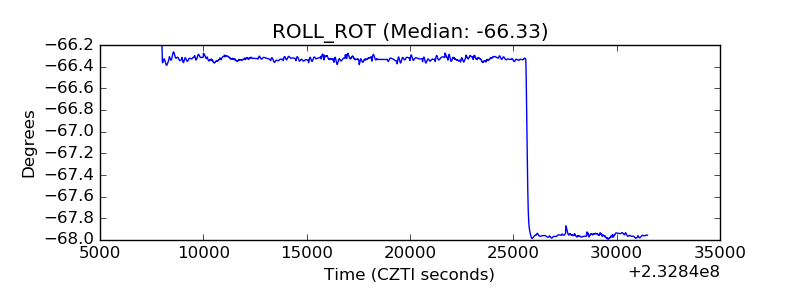 |
| _Roll_DEC | 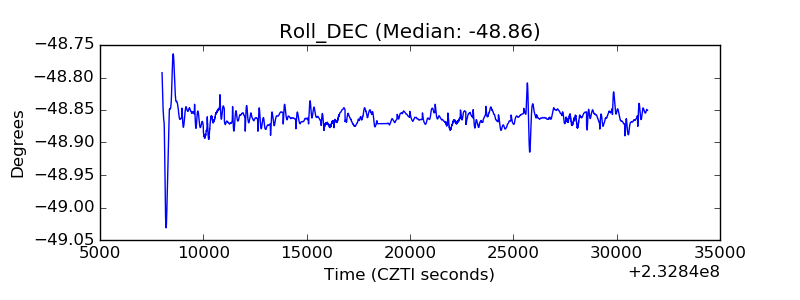 |
| _Roll_RA | 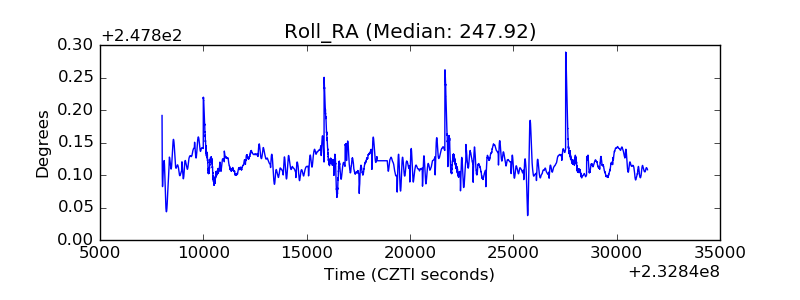 |
| Veto Counter | 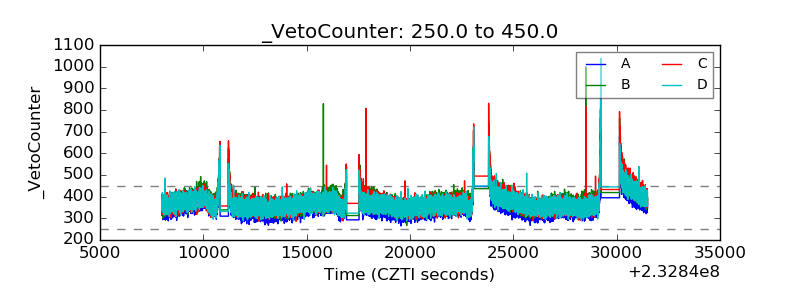 |