| Param | Original file | Final file |
|---|---|---|
| Filename | modeM0/AS1A03_009T01_9000001234_08869cztM0_level2.evt | modeM0/AS1A03_009T01_9000001234_08869cztM0_level2_quad_clean.evt |
| Size (bytes) | 461,934,720 | 78,909,120 |
| Size | 440.5 MB | 75.3 MB |
| Events in quadrant A | 3,742,462 | 491,187 |
| Events in quadrant B | 3,021,251 | 503,988 |
| Events in quadrant C | 2,907,851 | 488,479 |
| Events in quadrant D | 3,886,907 | 462,657 |
| Mode M9 | |||
|---|---|---|---|
| Quadrant | BADHDUFLAG | Total packets | Discarded packets |
| A | 0 | 11 | 0 |
| B | 0 | 11 | 0 |
| C | 0 | 11 | 0 |
| D | 0 | 11 | 0 |
| Mode SS | |||
|---|---|---|---|
| Quadrant | BADHDUFLAG | Total packets | Discarded packets |
| A | 0 | 128 | 0 |
| B | 0 | 128 | 0 |
| C | 0 | 128 | 0 |
| D | 0 | 128 | 0 |
| Mode M0 | |||
|---|---|---|---|
| Quadrant | BADHDUFLAG | Total packets | Discarded packets |
| A | 0 | 15342 | 2 |
| B | 0 | 13107 | 1 |
| C | 0 | 12967 | 5 |
| D | 0 | 15436 | 3 |
| Quadrant | Total seconds | Saturated seconds | Saturation percentage |
|---|---|---|---|
| A | 6352 | 113 | 1.778967% |
| B | 6352 | 44 | 0.692695% |
| C | 6350 | 37 | 0.582677% |
| D | 6351 | 185 | 2.912927% |
Noise dominated data is calculated using 1-second bins in cleaned event files. If a bin has >2000 counts, and if more than 50% of those come from <1% of pixels, then it is considered to be noise-dominated and hence unusable.
| Quadrant | # 1 sec bins | Bins with >0 counts | Bins with >2000 counts | High rate bins dominated by noise | Noise dominated (total time) | Noise dominated (detector-on time) | Marked lightcurve |
|---|---|---|---|---|---|---|---|
| A | 7412 | 6352 | 47 | 47 | 0.63% | 0.74% | 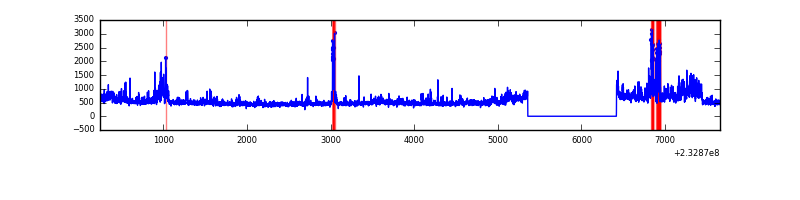 |
| B | 7412 | 6352 | 2 | 2 | 0.03% | 0.03% | 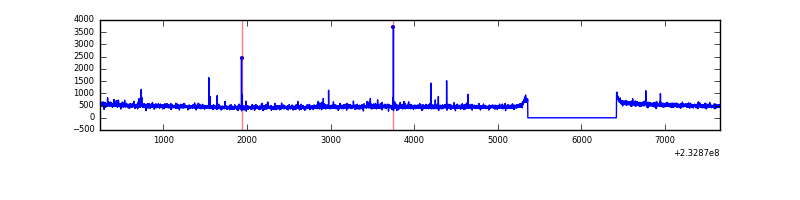 |
| C | 7412 | 6352 | 0 | 0 | 0.00% | 0.00% |  |
| D | 7412 | 6352 | 157 | 157 | 2.12% | 2.47% | 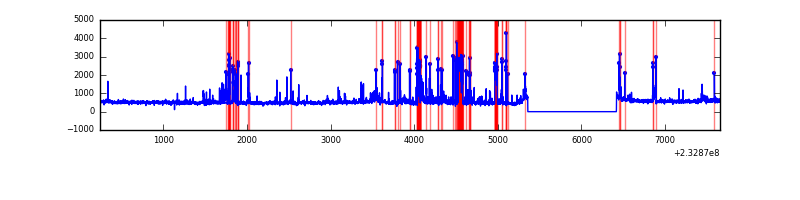 |
Top three noisy pixels from each quadrant. If the there are fewer than three noisy pixels in the level2.evt file, extra rows are filled as -1
| Pixel properties | Quadrant properties | ||||||
|---|---|---|---|---|---|---|---|
| Quadrant | DetID | PixID | Counts | Sigma | Mean | Median | Sigma |
| A | 8 | 5 | 659209 | 4265.66 | 760 | 743 | 154.4 |
| A | 5 | 16 | 120228 | 774.05 | 760 | 743 | 154.4 |
| A | 13 | 164 | 29512 | 186.37 | 760 | 743 | 154.4 |
| B | 6 | 51 | 16341 | 107.83 | 763 | 745 | 144.6 |
| B | 12 | 111 | 15187 | 99.85 | 763 | 745 | 144.6 |
| B | 11 | 111 | 12215 | 79.3 | 763 | 745 | 144.6 |
| C | 13 | 61 | 5754 | 29.27 | 744 | 746 | 171.1 |
| C | 14 | 67 | 4429 | 21.52 | 744 | 746 | 171.1 |
| C | 8 | 222 | 2496 | 10.23 | 744 | 746 | 171.1 |
| D | 13 | 105 | 541583 | 3052.75 | 733 | 712 | 177.2 |
| D | 8 | 195 | 323653 | 1822.72 | 733 | 712 | 177.2 |
| D | 1 | 52 | 108168 | 606.49 | 733 | 712 | 177.2 |
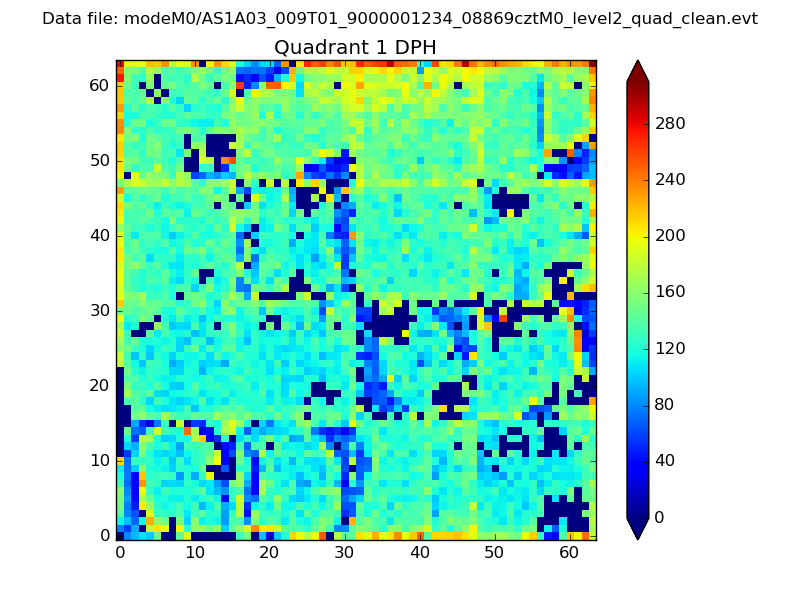
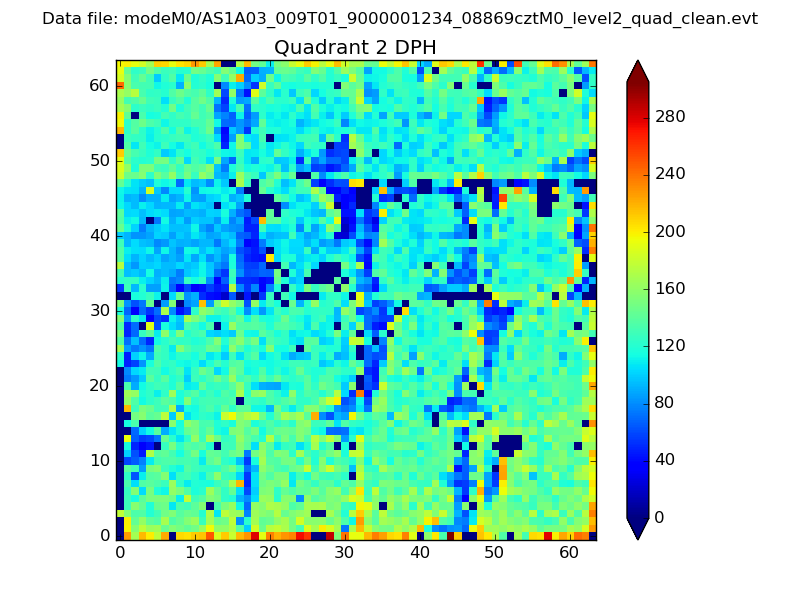
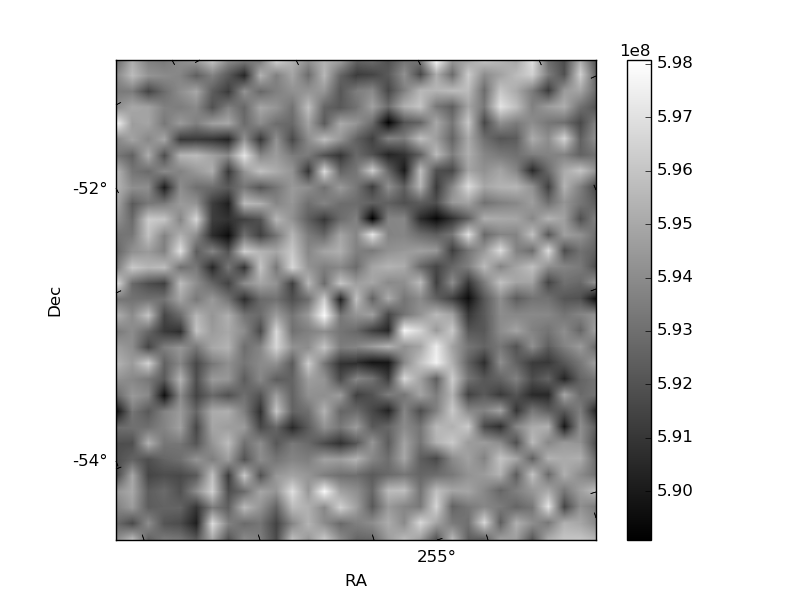
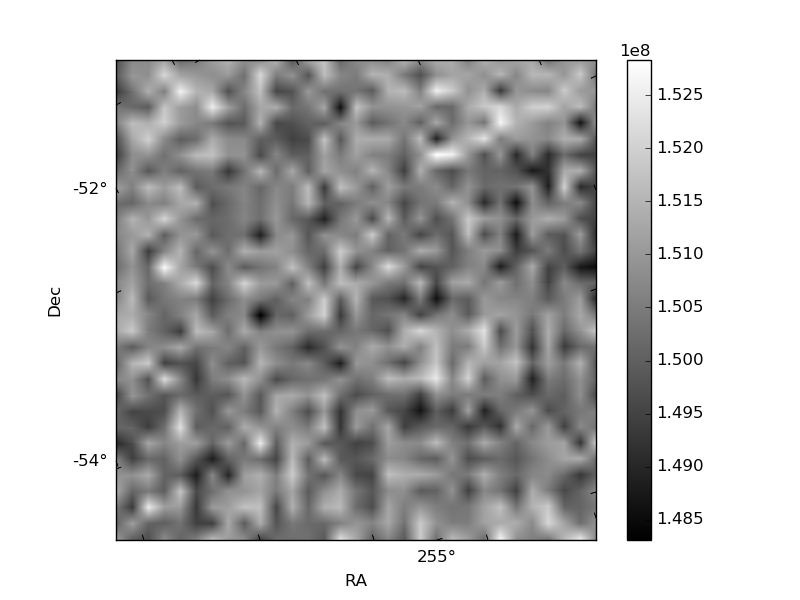
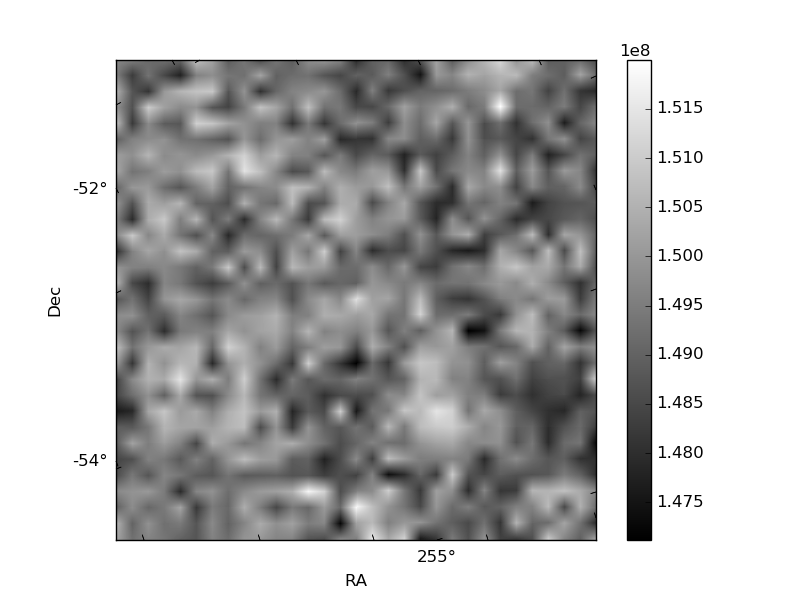
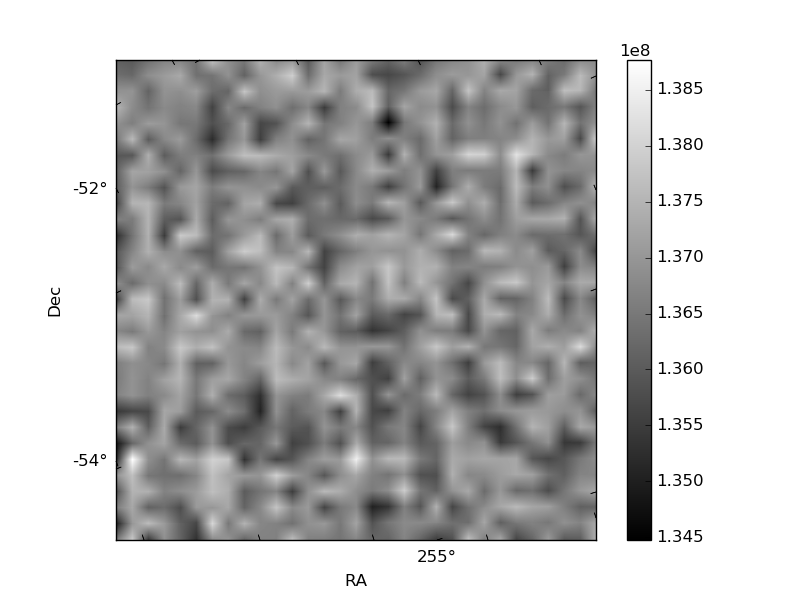
Histogram calculated using DETX and DETY for each event in the final _common_clean file
| Quadrant A | 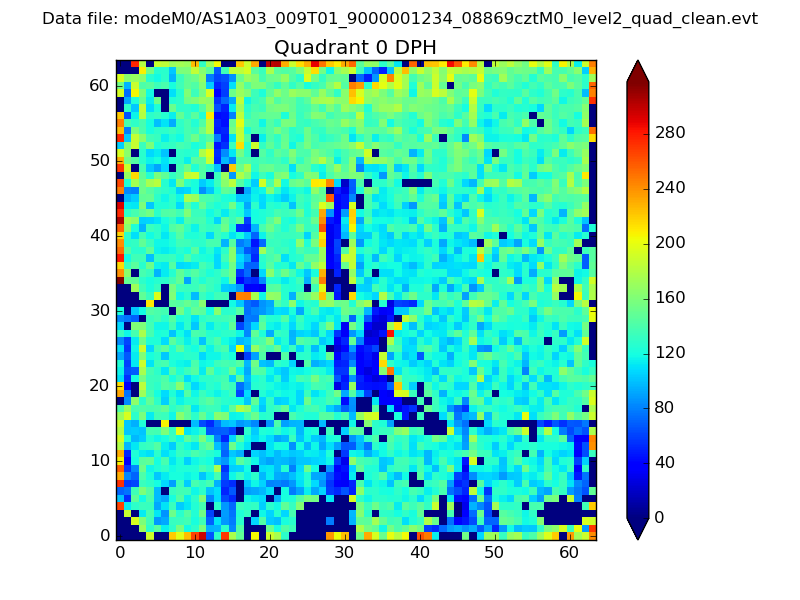 |
 |
Quadrant B |
|---|---|---|---|
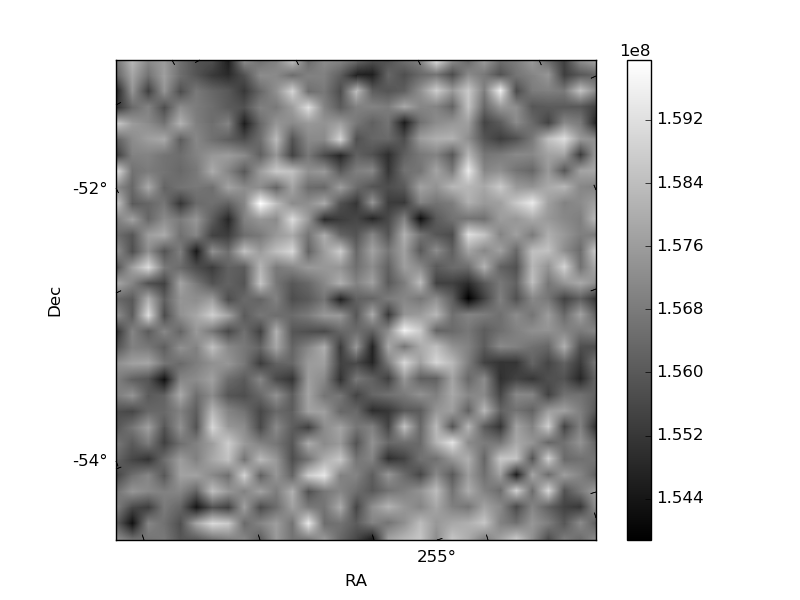
| Quadrant D | 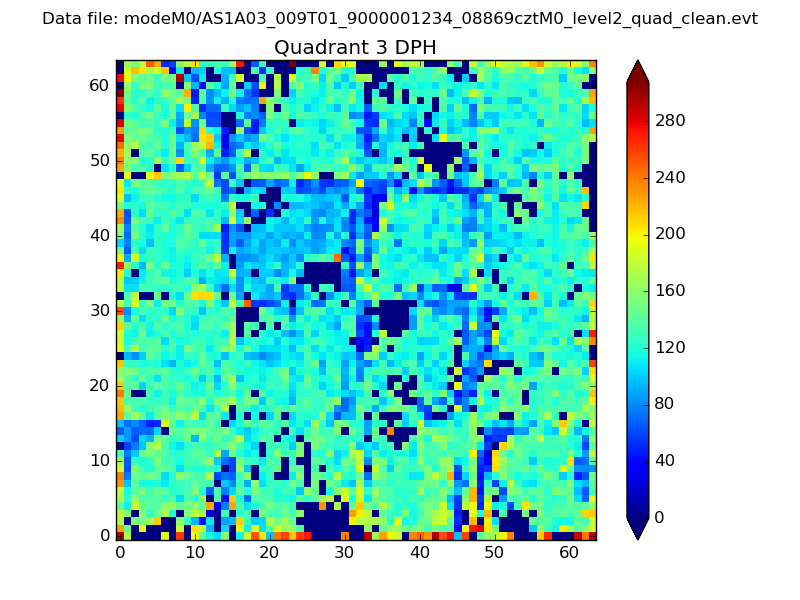 |
 |
Quadrant C |
| Plot type | Count rate plots | Images |
|---|---|---|
| Comparison with Poisson distribution Blue bars denote a histogram of data divided into 1 sec bins. Red curve is a Poisson curve with rate = median count rate of data. |
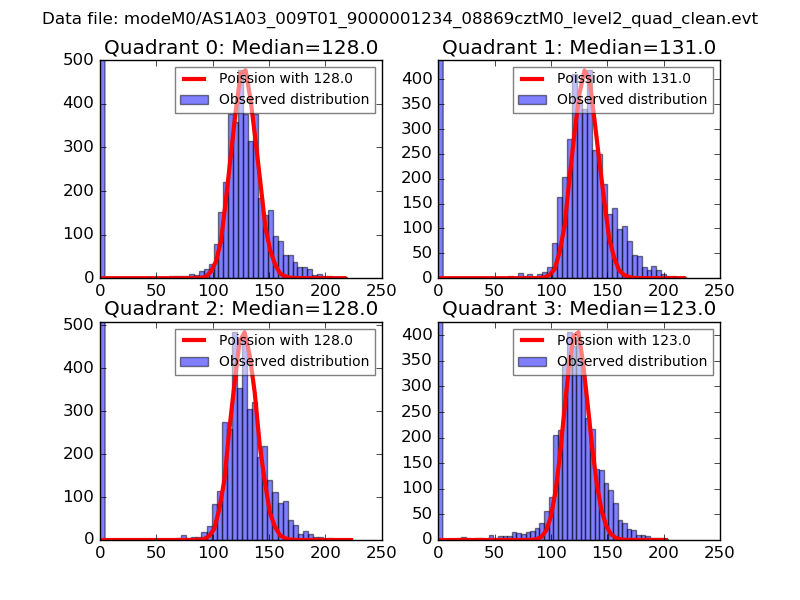 |
 |
| Quadrant-wise count rates Data is divided into 100 sec bins |
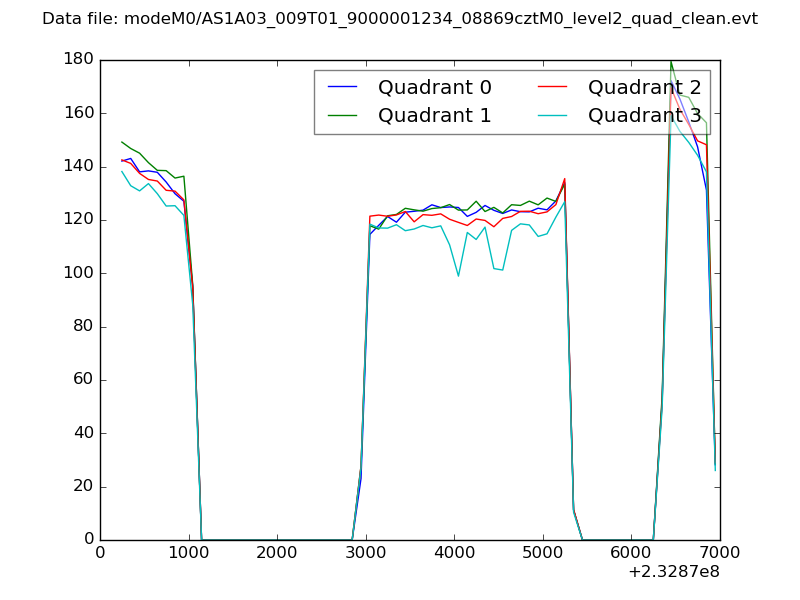 |
|
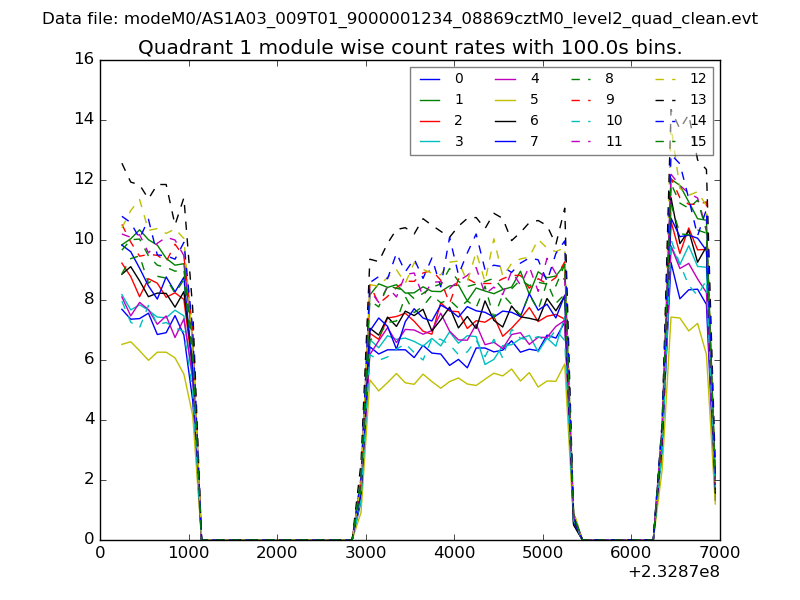
| Module-wise count rates for Quadrant A Data is divided into 100 sec bins |
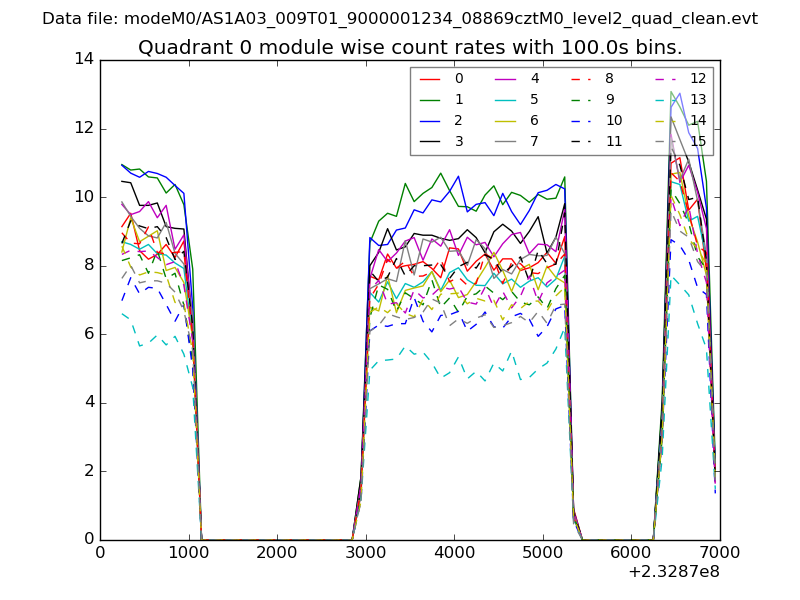 |
 |
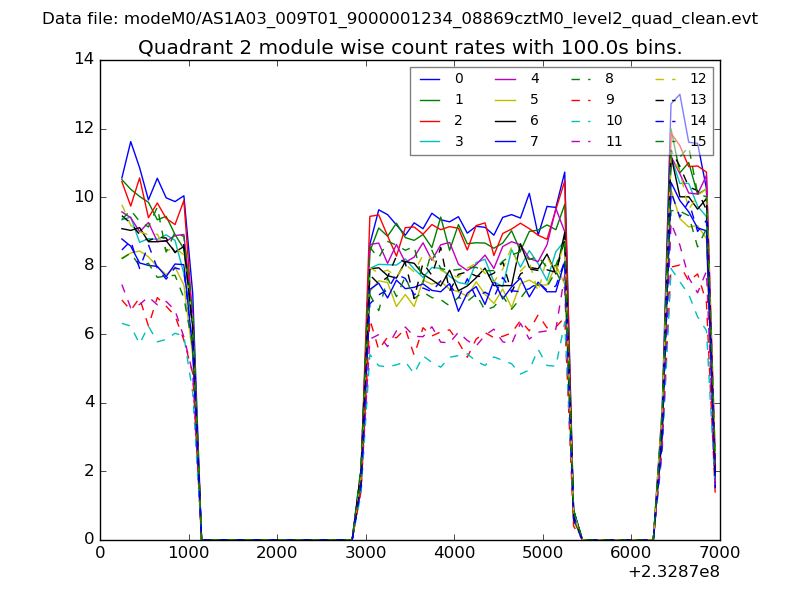
| Module-wise count rates for Quadrant B Data is divided into 100 sec bins |
 |
 |
| Module-wise count rates for Quadrant C Data is divided into 100 sec bins |
 |
 |
| Module-wise count rates for Quadrant D Data is divided into 100 sec bins |
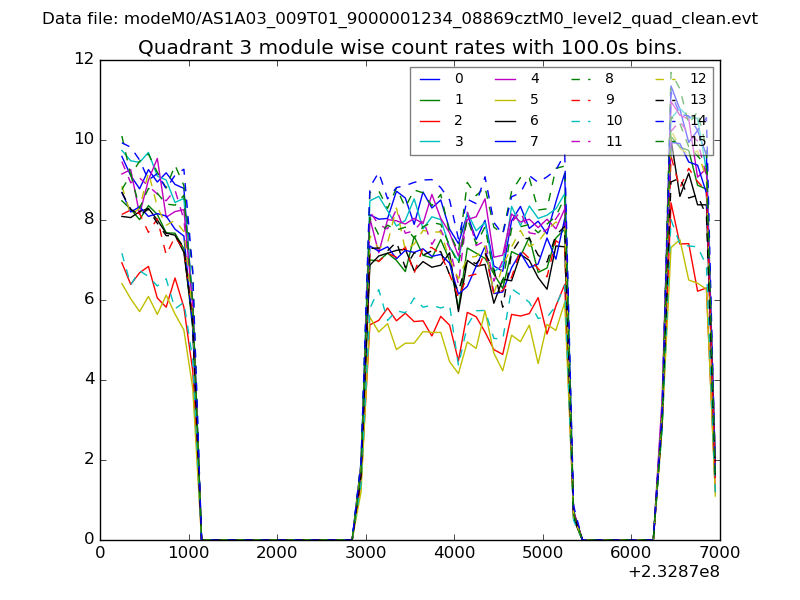 |
 |
| Parameter | Plot |
|---|---|
| CZT HV Monitor | 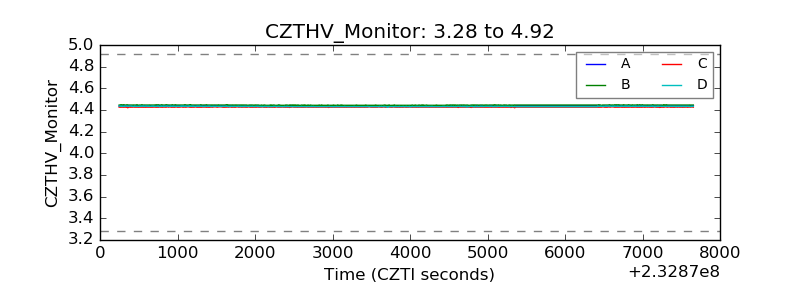 |
| D_VDD | 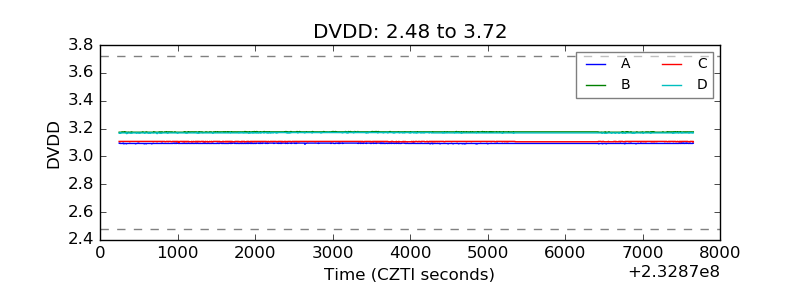 |
| Temperature 1 | 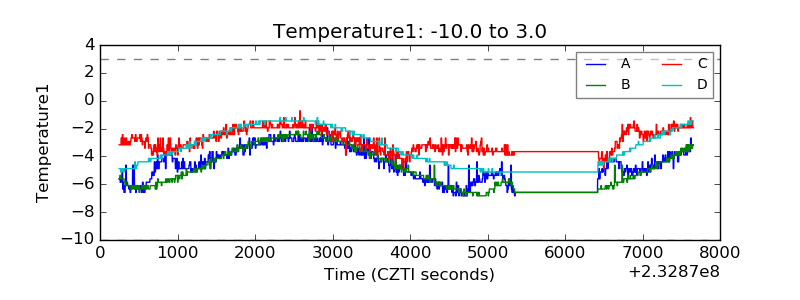 |
| Veto HV Monitor |  |
| Veto LLD | 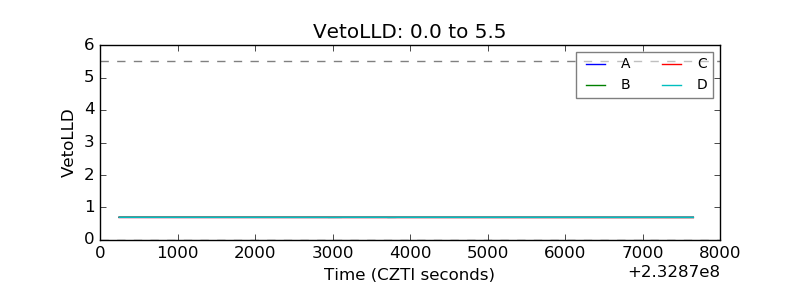 |
| Alpha Counter | 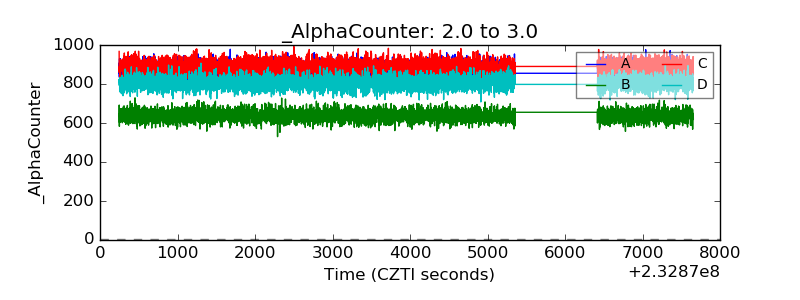 |
| _CPM_Rate | 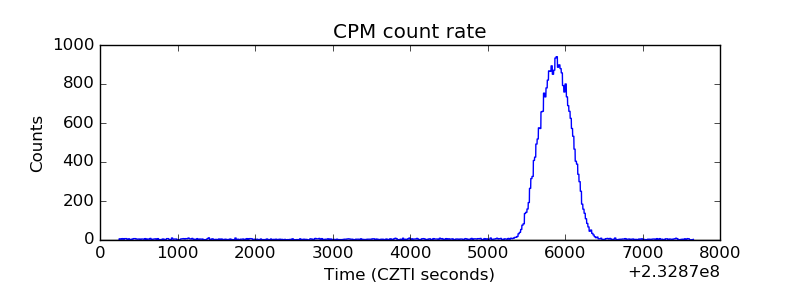 |
| CZT Counter | 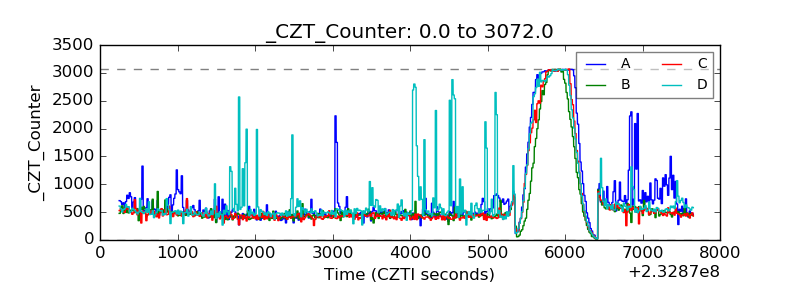 |
| +2.5 Volts monitor |  |
| +5 Volts monitor |  |
| _ROLL_ROT | 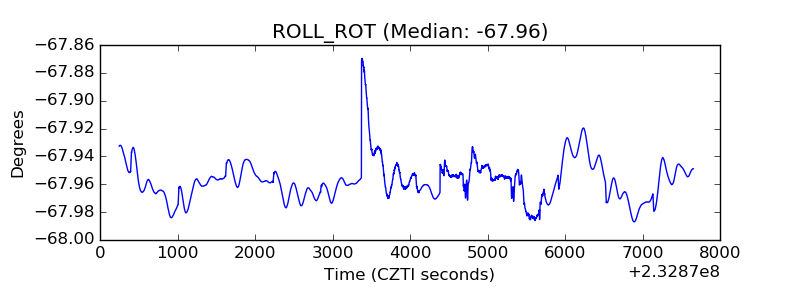 |
| _Roll_DEC | 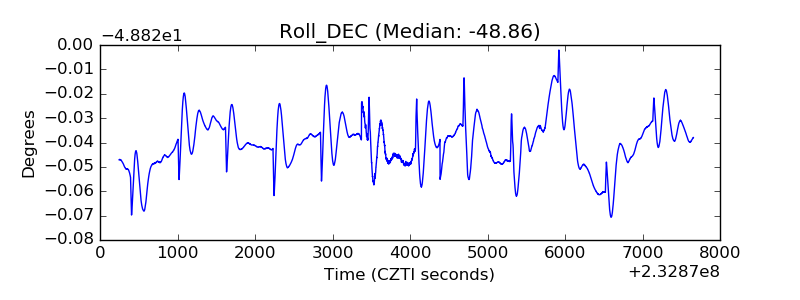 |
| _Roll_RA | 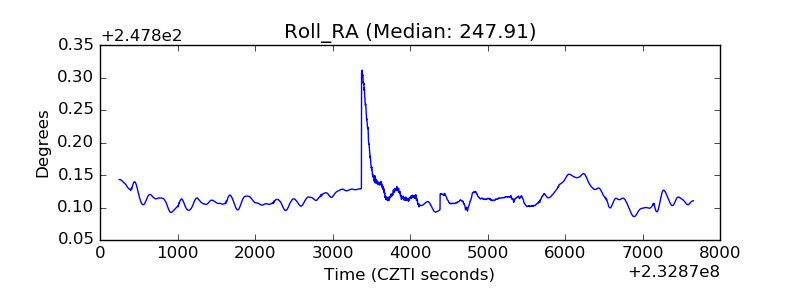 |
| Veto Counter | 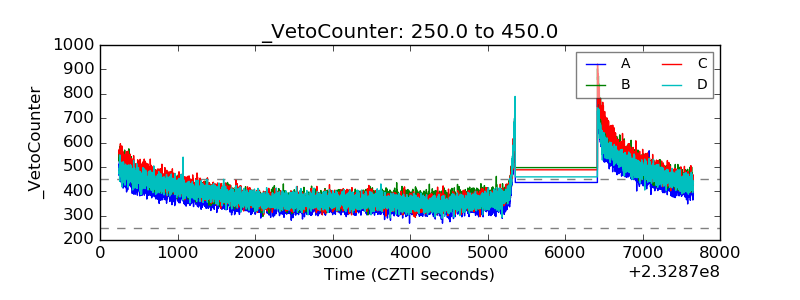 |